Download presentation
Presentation is loading. Please wait.

1
Flow Behavior of Granular Materials and Powders Part II
Asst. Prof. Dr. Muanmai Apintanapong

2
Mechanical properties : Flow Properties
To compare and optimize powders regarding flowability. To design powder handling equipment: silos, feeders, flow promoting devices and other bulk solid handling equipment (so that no flow problems occur e.g. flow obstructions, segregation, irregular flow, flooding,..)
")
3
Flow properties depend on:
Particle size distribution Particle shape Chemical composition of particles Moisture Temperature It is necessary to determine the flow properties in appropriate testing devices.

4
Stresses in bulk solids
Bulk solid element in container. Assumptions: infinite filling height, frictionless internal walls No shear stresses are acting at the lateral walls, since the lateral walls were assumed as frictionless. = 0 v = positive normal stress in vertical direction h = horizontal normal stress (result of vertical stress)
")
5
In bulk solid, h < v K or = ratio of horizontal stress to vertical stress (h/v) Typical values of K are between 0.3 and 0.6
 Typical values of K are between 0.3 and 0.6.")
6
In analogy to solids – in a bulk solid different stresses can be found in different cutting planes.
Stresses in cutting planes other than the vertical and the horizontal can be analyzed using a simple equilibrium of forces

7
Thus only the normal stresses shown are acting on the bulk solid from outside. Using a simple equilibrium of forces at a volume element with triangular cross-section cut from the bulk solid element shown in The normal stress (σα) and the shear stress (τα) acting on a plane inclined by an arbitrary angle α, can be calculated.
 and the shear stress (τα) acting on a plane inclined by an arbitrary angle α, can be calculated.")
8
The pair of values (σα, τα), which are to be calculated for all possible angles α, can be plotted in a σ,τ-diagram (normal stress, shear stress - diagram). If one joins all plotted pairs of values, a circle emerges; i.e., all calculated pairs of values form a circle in the σ,τ-diagram. This circle is called "the Mohr stress circle".

10
Mohr stress circle The Mohr stress circle represents the stresses in all cutting planes at arbitrary inclination angles α, i.e., in all possible cutting planes within a bulk solid element. Its centre is located at σm = (σv+σh)/2 and τm = 0. The radius of the circle is σm = (σv -σh)/2.
/2 and τm = 0. The radius of the circle is σm = (σv -σh)/2.")
11
Since the centre of the Mohr stress circle is always located on the σ-axis, each Mohr stress circle has two points of intersection with the σ-axis. The normal stresses defined through these points of intersection are called the principal stresses, whereby the larger principal stress – the major principal stress – is designated as σ1 and the smaller principal stress – the minor principal stress – is designated as σ2. If both principal stresses are given, the Mohr stress circle is well defined.

12
Summary A bulk solid can transmit shear stresses even if it is at rest. In different cutting planes different stresses are acting. Stress conditions can be represented with Mohr stress circles. A stress circle is defined clearly only if at least two numerical values are given, i.e., σ1 and σ2.

13
Uniaxial compression test
A hollow cylinder filled with a fine-grained bulk solid (crosssectional area A; internal wall of the hollow cylinder assumed as frictionless). The bulk solid is loaded by the stress σ1 – the consolidation stress – in the vertical direction.
. The bulk solid is loaded by the stress σ1 – the consolidation stress – in the vertical direction.")
14
The more the volume of the bulk solid specimen is reduced, the more compressible the bulk solid is.
In addition to the increase in bulk density from consolidation stress, one will observe also an increase in strength of the bulk solid specimen. Hence, the bulk solid is both consolidated and compressed through the effect of the consolidation stress. After consolidation, the bulk solid specimen is relieved of the consolidation stress, σ1, and the hollow cylinder is removed. If subsequently the consolidated cylindrical bulk solid specimen is loaded with an increasing vertical compressive stress, the specimen will break (fail) at a certain stress. The stress causing failure is called compressive strength or unconfined yield strength, σc (another common designation is fc).
 at a certain stress. The stress causing failure is called compressive strength or unconfined yield strength, σc (another common designation is fc).")
15
Incipient Flow At failure the consolidated bulk solid specimen starts to flow. Incipient flow is plastic deformation with decrease of bulk density. Since the bulk solid fails only at a sufficiently large vertical stress, which is equal to the compressive strength, there must exist a material-specific yield limit for the bulk solid. Only when this yield limit is reached does the bulk solid start to flow. Yield limits depend on materials and also its stress history.

16
Yield limit and Mohr stress circles

17
During the increasing vertical load in the second part of the test, the stress states at different load steps are represented by stress circles with increasing diameter (stress circles B1, B2, B3). The lesser principal stress, which is equal to the horizontal stress, is equal to zero at all stress circles.

18
At failure of the specimen the Mohr stress circle B3 represents the stresses in the bulk solid sample. Since the load corresponding to this Mohr stress circle causes incipient flow of the specimen, the yield limit of the bulk solid must have been attained in one cutting plane of the specimen. Thus, Mohr stress circle B3 must reach the yield limit in the σ,τ-diagram. The real course of the yield limit can not be determined with only the uniaxial compression test.

19
The Mohr stress circles B1 and B2, which are completely below the yield limit, cause only an elastic deformation of the bulk solid specimen, but no failure and/or flow. Stress circles larger than stress circle B3, and thus partly above the yield limit, are not possible: The specimen would already be flowing when the Mohr stress circle reaches the yield limit (failure), so that no larger load could be exerted on the specimen.
, so that no larger load could be exerted on the specimen..")
20
If, during the second part of the experiment (measurement of compressive strength), one were to apply also a constant horizontal stress σh > 0 on the specimen (in addition to the vertical stress, σv), one would likewise find stress circles that indicate failure of the specimen and reach the yield limit (e.g. stress circle C in Figure). Thus the yield limit is the envelope of all stress circles that indicate failure of a bulk solid sample.
. Thus the yield limit is the envelope of all stress circles that indicate failure of a bulk solid sample..")
22
Jenike shear tester This tester was the first one designed for the purposes of powder technology (e.g. measurement at small stresses), and still today shear testers are compared to the Jenike Shear Tester.
, and still today shear testers are compared to the Jenike Shear Tester.")
23
Jenike shear tester

24
Shear test procedure (yield locus)
")
25
Shear test data analysis
envelope Free flow i No flow Cohesion 1 i = angle of internal friction = C + tan i

26
i Cohesion 1 envelope Free flow No flow
Effective angle of internal friction Part II

27
Flow function (FF) It is the relationship between the unconfined yield pressure of a solid and the consolidation pressure c = (1) FF = d1 /dc
 FF = d1 /dc.")
28
Flow function (FF) To obtain FF curve of a solid, shear tests are conduct for several consolidating loads and the resulting 1 and c are plotted.
 To obtain FF curve of a solid, shear tests are conduct for several consolidating loads and the resulting 1 and c are plotted.")
29
Jenike (1964) classified solids according to their limiting flow function (FF)
FF < 2 very cohesive and non-flowing 4 > FF > 2 cohesive 10 > FF > 4 easy-flowing FF> 10 free flowing

30
Jenike (1964) showed that for a given hopper there exists a critical line such that as long as the flow function curve below this line, the strength of the solid is insufficient to support an arch c and 1 there would be no obstruction to flow. This critical line was referred to as the “critical flow factor” or “ff” of the hopper. It is the ratio of critical major consolidating pressure (1) to the critical unconfined yield pressure (c) determined experimentally. ff = (1 /c)critical = (F1 /Fc)critical This is the condition at which the bulk material is just on the point of forming an obstruction to flow. In other words, in a free-flowing solid. c = f(1)<ccritical = (1/ff) 1 Or 1 /c > ff
critical = (F1 /Fc)critical. This is the condition at which the bulk material is just on the point of forming an obstruction to flow. In other words, in a free-flowing solid. c = f(1)<ccritical = (1/ff) 1. Or 1 /c > ff.")
32
Example Tests were conducted using a shear cell on a granular material. The consolidating load was 8 lb and the cell diameter was 3.75 in. Estimate the following: Yield locus Angle of internal friction Effective yield locus Effective angle of internal friction Minor and major consolidating stress Unconfined yield stress Cohesion Value of flow function of the material Normal load (lb) Shear load (lb) 8.0 6.0 4.5 3.0 1.5 5.0 4.4 3.5 2.8 1.7
 Shear load (lb)")
33
FF = 1 /c Effective yield locus cohesion Yield locus
Minor consolidating stress Consolidating load = 8 lb Major consolidating stress Unconfined yield stress

34
Adhesive forces The flowability of a bulk solid depends on the adhesive forces between individual particles. Different mechanisms create adhesive forces. fine-grained, dry bulk solids : van der Waals interactions. moist bulk solids: liquid bridges between the particles (Both types are dependent on the distance between particles and on particle size.)
")
35
Time Consolidation The effect is occurred when some bulk solids continue to gain strength if stored at rest under compressive stress for a longer time interval (from the effects of adhesive forces).
.")
36
Possible Mechanisms of Time Consolidation
Solids bridges due to solid crystallizing when drying moist bulk solids, where the moisture is a solution of a solid and a solvent (e.g. sand and salt water). Solid bridges from the particle material itself, e.g. after some material at the contact points has been dissolved by moisture (e.g. crystal sugars with slight dampness). Bridges due to sintering during storage of the bulk solid at temperatures not much lower than the melting temperature. This can appear e.g. at ambient temperature during the storage of plastics with low melting points. Plastic deformation at the particle contacts, which leads to an increase in the adhesive forces through approach of the particles and enlargement of the contact areas. Chemical processes (chemical reactions at the particle contacts). Biological processes (e.g. due to fungal growth).
. Solid bridges from the particle material itself, e.g. after some material at the contact points has been dissolved by moisture (e.g. crystal sugars with slight dampness). Bridges due to sintering during storage of the bulk solid at temperatures not much lower than the melting temperature. This can appear e.g. at ambient temperature during the storage of plastics with low melting points. Plastic deformation at the particle contacts, which leads to an increase in the adhesive forces through approach of the particles and enlargement of the contact areas. Chemical processes (chemical reactions at the particle contacts). Biological processes (e.g. due to fungal growth).")
37
Particle size Adhesive forces increase with decreasing in particle size. Thus, as a rule, a bulk solid flows more poorly with decreasing particle size. Fine-grained bulk solids with moderate or poor flow behaviour due to adhesive forces are called cohesive bulk solids.

38
Production of tablets or briquettes
Characteristic of bulk solids: adhesive forces between the particles that are depended on external forces (especially for cohesive bulk solids). Evaluation of bulk solids behaviour: consider the forces or stresses previously acting on the bulk solid (the stress history). The stress history includes, the consolidation stress exerted on a bulk solid, leading to certain adhesive forces and hence to a certain strength of the bulk solid (e.g., the strength of a tablet is dependent on the maximum consolidation stress at tabletting).
. Evaluation of bulk solids behaviour: consider the forces or stresses previously acting on the bulk solid (the stress history). The stress history includes, the consolidation stress exerted on a bulk solid, leading to certain adhesive forces and hence to a certain strength of the bulk solid (e.g., the strength of a tablet is dependent on the maximum consolidation stress at tabletting).")
39
Flowability "Flowing" means that a bulk solid is deformed plastically due to the loads acting on it (e.g. failure of a previously consolidated bulk solid sample). The magnitude of the load necessary for flow is a measure of flowability. Good flow behaviour: a bulk solid flows easily and it does not consolidate much and flows out of a silo or a hopper due to the force of gravity alone and no flow promoting devices are required. Poorly flowing: flow obstructions or consolidate during storage or transport.
. The magnitude of the load necessary for flow is a measure of flowability. Good flow behaviour: a bulk solid flows easily and it does not consolidate much and flows out of a silo or a hopper due to the force of gravity alone and no flow promoting devices are required. Poorly flowing: flow obstructions or consolidate during storage or transport.")
40
Bulk density, ρb, and unconfined yield strength, σc, vs
Bulk density, ρb, and unconfined yield strength, σc, vs. consolidation stress, σ1 In Figure (curve A), bulk density, ρb, and unconfined yield strength, σc, typically increase with consolidation stress, σ1. Very rarely a progressive slope like in the left part of curve B is observed. The curve σc(σ1) is called the flow function.
, bulk density, ρb, and unconfined yield strength, σc, typically increase with consolidation stress, σ1. Very rarely a progressive slope like in the left part of curve B is observed. The curve σc(σ1) is called the flow function.")
41
Flow function (FF) It is the relationship between the unconfined yield pressure of a solid and the consolidation pressure c = (1) FF = d1 /dc
 FF = d1 /dc.")
42
Flow function (FF) To obtain FF curve of a solid, shear tests are conduct for several consolidating loads and the resulting 1 and c are plotted.
 To obtain FF curve of a solid, shear tests are conduct for several consolidating loads and the resulting 1 and c are plotted.")
43
Flow factor (ff) Jenike (1964) showed that for a given hopper there exists a critical line such that as long as the flow function curve below this line, the strength of the solid is insufficient to support an arch c and 1 there would be no obstruction to flow. This critical line was referred to as the “critical flow factor” or “ff” of the hopper. It is the ratio of critical major consolidating pressure (1) to the critical unconfined yield pressure (c) determined experimentally. ff = (1 /c)critical = (F1 /Fc)critical This is the condition at which the bulk material is just on the point of forming an obstruction to flow. In other words, in a free-flowing solid. c = f(1)<ccritical = (1/ff) 1 Or 1 /c > ff
 showed that for a given hopper there exists a critical line such that as long as the flow function curve below this line, the strength of the solid is insufficient to support an arch c and 1 there would be no obstruction to flow. This critical line was referred to as the critical flow factor or ff of the hopper. It is the ratio of critical major consolidating pressure (1) to the critical unconfined yield pressure (c) determined experimentally. ff = (1 /c)critical = (F1 /Fc)critical. This is the condition at which the bulk material is just on the point of forming an obstruction to flow. In other words, in a free-flowing solid. c = f(1)<ccritical = (1/ff) 1. Or 1 /c > ff.")
44
For flow function : curve A
ffc = 3.5 ffc = 1 For flow function : curve A If ff = 1 : there is no obstruction to flow If ff = 3.5 : there is obsrtruction to flow (no flow)
")
45
Flow function FF depends on the material only, the flow factor ff depends on both the material and the hopper geometry, surface wall characteristics, etc. If a solid with certain flow properties, represented by its FF curve, is placed in a hopper with a certain critical flow function ff, represented by a straight on the c versus 1 coordinates, then the critical values of c and 1 are given by the intersection of of the curve and the line. For different size hopper outlets, this point of intersection will determine the minimun size of the outlet required to avoid arching or piping.

46
Jenike (1964) classified solids according to their limiting flow function (FF)
FF < 2 very cohesive and non-flowing 4 > FF > 2 cohesive 10 > FF > 4 easy-flowing FF> 10 free flowing

47
Time consolidation (caking)
Some bulk solids increase in strength if they are stored for a longer time at rest under a compressive stress (e.g. in a silo or an intermediate bulk container). This effect is called time consolidation or caking. Time consolidation can be determined with uniaxial compression test (to simulate long-term storage in a silo).
. This effect is called time consolidation or caking. Time consolidation can be determined with uniaxial compression test (to simulate long-term storage in a silo).")
48
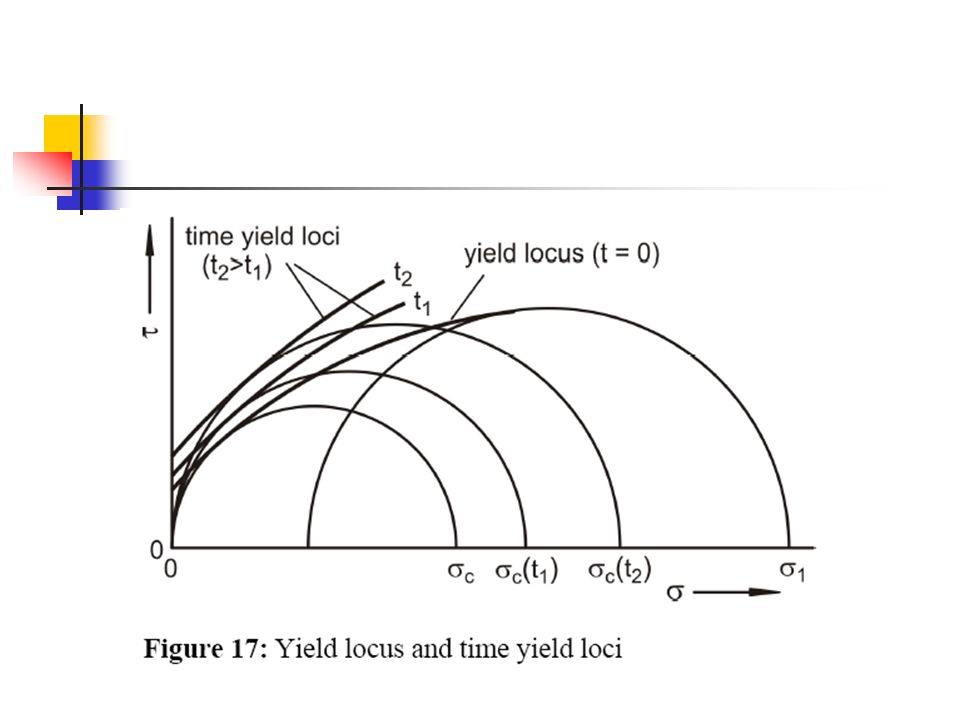
Flow function and time flow functions for two different storage times t1 and t2 > t1.
The unconfined yield strength, σc, increases with increasing Storage time. This result is true for many bulk solids, but not for all (e.g. dry quartz sand). These differences are due to the different physical, chemical, or biological effects that are the causes of consolidation over time, e.g. chemical processes, crystallizations between the particles, enlargement of the contact areas through plastic deformation, capillary condensation, or biological processes such as fungal growth.
. These differences are due to the different physical, chemical, or biological effects that are the causes of consolidation over time, e.g. chemical processes, crystallizations between the particles, enlargement of the contact areas through plastic deformation, capillary condensation, or biological processes such as fungal growth.")
49
Numerical characterization of flowability
Flowability of a bulk solid is characterized mainly by its unconfined yield strength, σc, in dependence on the consolidation stress, σ1, and the storage period, t. Usually the ratio ffc of consolidation stress, σ1, to unconfined yield strength, σc, is used to characterize flowability numerically:

50
Flow function and lines of constant flowability

51
Influence of storage time on flowability

52
Method for yield locus determination

53
Shear test procedure (yield locus)
The goal of a shear test is to measure the yield limit of a consolidated bulk solid. The yieldlimit is called yield locus in bulk solids technology.

54
Shear test procedure (yield locus)
")
55
Jenike shear tester This tester was the first one designed for the purposes of powder technology (e.g. measurement at small stresses), and still today shear testers are compared to the Jenike Shear Tester.
, and still today shear testers are compared to the Jenike Shear Tester.")
56
Jenike shear tester

57
Ring shear tester

58
Ring shear tester

59
Yield locus The parameters which describe the flow properties can be determined from the yield locus. Please note that the analogy between the uniaxial compression test and the shear test is used here for the explanation of the yield locus. In reality, the stress circles at uniaxial compression and at steady state flow are not exactly the same, and a uniaxial compression test usually results in a smaller unconfined yield strength than a shear test.

61
Time consolidation Before time consolidation can be measured, a yield locus must be determined at the same consolidation stress. The time consolidation, which describes the increase of the unconfined yield strength with time during storage at rest, is measured with a shear tester similar to the measurement of a yield locus. First a bulk solid specimen is presheared (consolidated). After preshear the specimen is stored for a period, t, under the vertically acting normal stress, σ, which is selected to be equal to the consolidation stress, σ1, of the corresponding yield locus. This ensures that during the consolidation period the same major principal stress (= consolidation stress, σ1) acts on the specimen as during steady-state flow at preshear.
. After preshear the specimen is stored for a period, t, under the vertically acting normal stress, σ, which is selected to be equal to the consolidation stress, σ1, of the corresponding yield locus. This ensures that during the consolidation period the same major principal stress (= consolidation stress, σ1) acts on the specimen as during steady-state flow at preshear.")
62
After the time consolidation period t the specimen is sheared to failure. For this, a vertical normal load, σsh < σ1, is selected. As with shear without time consolidation (measurement of a point of a yield locus), so also after time consolidation will one observe a shear stress maximum. If consolidation time affects the bulk solid under consideration, after the consolidation period the shear stress maximum will be larger than it would have been without a consolidation period between preshear and shear.
, so also after time consolidation will one observe a shear stress maximum. If consolidation time affects the bulk solid under consideration, after the consolidation period the shear stress maximum will be larger than it would have been without a consolidation period between preshear and shear..")
65
Bulk Solids Testing Wall Friction Testing
Powder Shear Testing - measures both powder internal friction and cohesion Compressibility Permeability

66
Sources of Cohesion (Binding Mechanisms)
Solids Bridges -Mineral bridges -Chemical reaction -Partial melting -Binder hardening -Crystallization -Sublimation Interlocking forces Attraction Forces -van der Waal’s -Electrostatics -Magnetic Interfacial forces -Liquid bridges -Capillary forces

67
Testing Considerations
Must consider the following variables - time - temperature - humidity - other process conditions

Similar presentations


 Geotechnical Properties of Soil>")


.>")
>")

