Download presentation
Presentation is loading. Please wait.

1
Updates on the Chinese Energy Sector and on the China LEAP Modeling Effort Yanjia Wang, Alun Gu, Aling Zhang EETC, Tsinghua University, China 4th Asia Energy Security Workshop 6-7 November 2006, Beijing, China

2
Part A: Update on the Chinese Energy Sector Yanjia Wang

3
Where Does China’s Energy Go? Basic facts in 2005 –Primary energy production 2.063 billion tce, 10% higher than previous year; –Total energy consumption 2.225 billion tce, 9.47% higher than 2004; –Coal consumption 2.14 billion ton, 11.4% higher –Power installed capacity: 517.18GW, 16.9% higher –Power generated: 2,497.5TWh, 13.82% higher –Crude oil consumption 3300 million ton, 13.8% higher –Crud oil import (net): 119 million ton, 1.4% higher –Petroleum import (net): 143.6 million ton, 5.2% less –Elasticity of energy production & consumption: 0.96 –Elasticity of electricity production: 1.24 –Elasticity of electricity consumption: 1.22
: 119 million ton, 1.4% higher –Petroleum import (net): million ton, 5.2% less –Elasticity of energy production & consumption: 0.96 –Elasticity of electricity production: 1.24 –Elasticity of electricity consumption:")
4
Where Does China’s Energy Go? Macro control effected, but still a long way to go 2002200320042005 Elasticity of energy consumption 0.661.531.590.96 Elasticity of electricity consumption 1.301.561.521.22 Growth of crude oil import (net)--33.4%41.4%1.45% Growth of oil products import (net) --49.3%83.6%-33.9% Commissioned power capacity50GW66.7GW Total energy consumption growth rate 6.0%15.3%16.1%9.5%
--33.4%41.4%1.45% Growth of oil products import (net) %83.6%-33.9% Commissioned power capacity50GW66.7GW Total energy consumption growth rate 6.0%15.3%16.1%9.5%.")
5
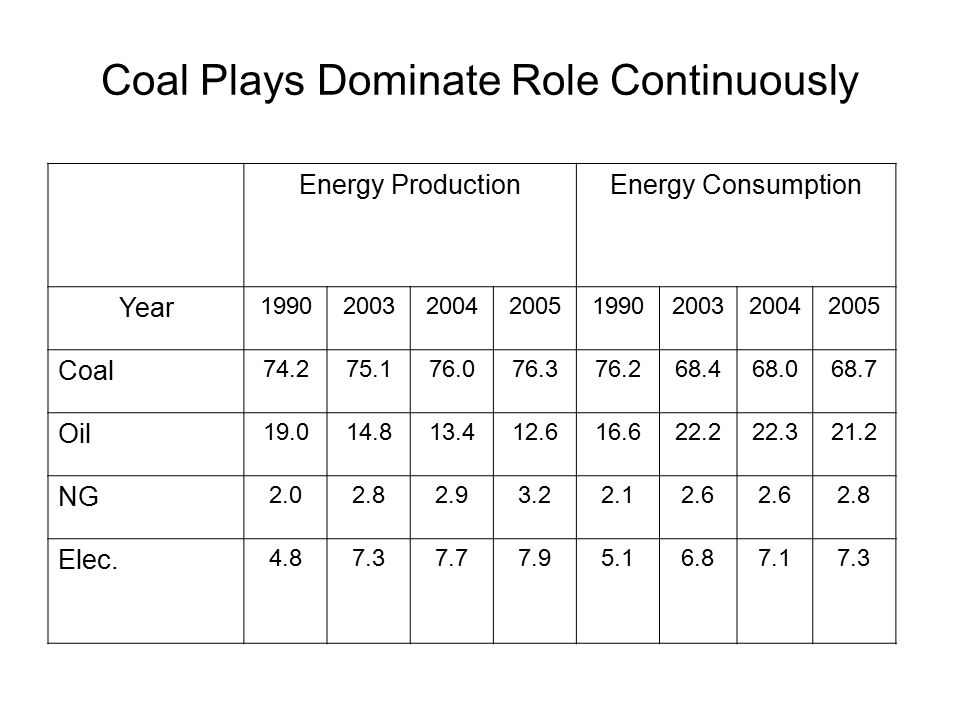
Coal Plays Dominate Role Continuously Energy ProductionEnergy Consumption Year 19902003200420051990200320042005 Coal 74.275.176.076.376.268.468.068.7 Oil 19.014.813.412.616.622.222.321.2 NG 2.02.82.93.22.12.6 2.8 Elec. 4.87.37.77.95.16.87.17.3
7
Power Industry YearCapacity/GWShare/% TotalThermalHydroNuclearTotalThermalHydroNuclear 198065.945.620.3--10069.230.8-- 1990137.89101.8436.05--10073.926.1-- 1995217.22162.9452.182.1010075.024.00.1 2000319.32237.5479.252.1010074.424.80.1 2003391.41289.7794.906.1910074.024.21.6 2005517.85391.37116.528.7 Wind 1.26GW PV 15MW 10075.9022.51.6

8
1972-2004 New Constructed Power Plant (10 4 kW)
")
9
??? ENERGY EFFICIENCY IN CHINA

10
Renewable Energy Law Effected on Jan. 1 st 2006 NDRC issued a document for pricing renewable energy for power generation on Jan. 4 th 2006. Biomass for power tariff = coal-fired tariff (including deSOx) + 0.25yuan/kWh for 15 years Wind power: tendering price and lowest bidder’s price PV, geothermal, wave..: project based approval price
 yuan/kWh for 15 years Wind power: tendering price and lowest bidder’s price PV, geothermal, wave..: project based approval price.")
11
20% Energy Efficiency Target National 11 th Five-Year Plan(2006-2010): Energy intensity of GDP will decrease about 20% within 5 years. Give a quantified target on energy efficiency for the first time in five-year plans Divide total target to provincial, large industrial group, city, large energy consumers’ target to implement.

12
Tremendous Efforts Must be Made on Energy Efficiency Improvement GDP Annual Growth Rate (2006-2010) (%) Total GDP Growth during 2006 to 2010 ( Times ) Energy Elasticity 7.01.4030.303 7.5 ( Government anticipation 2006-2010 ) 1.4360.341 8.51.5040.403 9.0 ( 2000-2005 average ) 1.5390.429 9.9 ( growth rate of 2005 ) 1.6030.468 10.01.6150.472 11.01.6850.508 15.0 ( GDP double within 5 years ) 2.0110.602
 (%) Total GDP Growth during 2006 to 2010 ( Times ) Energy Elasticity ( Government anticipation ) ( average ) ( growth rate of 2005 ) ( GDP double within 5 years )")
13
Three Gorge Hydropower Fully Operate for the First Time 14×700MW generators fully operate on Oct. 18 2006 14×700MW generators commissioned on Sept. 2005 The first generator commissioned on July 2003 26×700MW generators will commission by the end of 2008 Sluice will reach designed level-- 156 meter Water level before 156 meter (bottom) (taken on Aug. 8 th 2006) Water level reached 154.24 meter (top) (taken on Oct. 22, 2006)
 (taken on Aug. 8 th 2006) Water level reached meter (top) (taken on Oct. 22, 2006).")
14
40GW Nuclear Power by 2020 First phase in Tianwan, Russian Pressed Water Reactor, being built. First and Second Phases in Qinshan, domestic Pressed Water Reactor, operating; The third phase in Qinshan, Canadian Heavy Water Reactor, being built; Sanmen, 6GW, domestic Pressed Water Reactor Yangjiang, authorized, technique to be chosen. Daya Bay, Ling’ao, French Pressed Water Reactor, operating Yangjiang 6GW, 2012 finished ☆ ☆ ☆ ☆ ☆ ☆ ☆ ☆ ☆ Northeast Beijing North China Northwest Southwest East China Central South Weihai, 195MW Domestic Gas cooling reactor, Another two plants in Rongchen, Hai Yang are under planning Hongheyan 2GW, 2011 finished

15
Operated Nuclear Power Plant List

16
Qinshan I

17
Qinshan II

18
China Vice Primary Minister and Canadian Primary Minister attend the creamery of Qinshan III commissioned Qinshan III 2×700 MW US$2.88 billion

19
Daya Bay

20
Location of Nuclear Power Plants in Asia

21
Part B:China LEAP Modeling Effort

22
Basic assumptions Base year: 2000 (2005) Target year: 2030 Dataset: AES2005 LEAP2006 (slow calculation) Three scenarios: BAU, NAP,RAP Check inputs and outputs of base year (finish) GDP adjustment in 2004
 Target year: 2030 Dataset: AES2005 LEAP2006 (slow calculation) Three scenarios: BAU, NAP,RAP Check inputs and outputs of base year (finish) GDP adjustment in 2004")
23
The construction of new socialist countryside in China Narrow the widening gap between rural and urban China Improve agricultural production, living standards and public administration in the rural areas Rural facilities will be improved Rural consumption structure will be changed

24
Wind power industry update Wind power installed capacity in 2005: 1.26GW, increment: 0.498 GW (39%) Localization of 70% Initial investment: 7500-8500 yuan/kW In 2020, wind power installed capacity: 30GW (finish)
 Localization of 70% Initial investment: yuan/kW In 2020, wind power installed capacity: 30GW (finish)")
25
CDM projects in China CDM projects will decrease the operation cost in power industry in China (doing) Emission factor in China: about 0.8 kgCO2e/kWh(coal-fired) CERs (Certified emission reductions): US $ 10/tCO2e Emission reduction benefits: 0.064yuan/kWh Average electricity tariff: 0.309 yuan/kWh
 Emission factor in China: about 0.8 kgCO2e/kWh(coal-fired) CERs (Certified emission reductions): US $ 10/tCO2e Emission reduction benefits: 0.064yuan/kWh Average electricity tariff: yuan/kWh")
26
Nuclear power scenarios in China

27
Nuclear

28
Adjustment

29
Ongoing Transport sector (substitute fuel development) Renewable energy development in China: renewable energy power plants…......
 Renewable energy development in China: renewable energy power plants…......")
30
Thank you! gal@tsinghua.edu.cn

Similar presentations

 Embassy of India Washington DC, 20008.>")

 Tsinghua University & China.>")


