Download presentation
Presentation is loading. Please wait.

1
Improving Efficiency in Clinical Laboratory
Dr Farooq Ghani Aga Khan University

2
Over 70% of Healthcare Decisions are based on Medical Tests

3
Clinical Lab Process Improvement
Online connectivity of the main lab to11 regional labs and 187 phlebotomy centers throughout the country Barcoding samples at collection site Lab Automation

4
Online Connectivity & Barcoding

5
Routine Lab Practice Blood Samples Whole blood Hematology
~25 % Serum based / plain blood ~75 % Chemistry / Immuno chem Other assays Automation ~ 90 % ~ 10 %

6
“The first rule of any technology used in an organization is that automation applied to an efficient operation will magnify the efficiency. The second is that automation applied to an inefficient operation will magnify the inefficiency” Bill Gates

8
Personnel Optimisation
Increase Capacity Reduce Errors Faster TAT Laboratory Automation Space Utilization Personnel Optimisation

9
High Gain Opportunities
Turnaround Time High Gain Opportunities

10
Goal: Reduce Costs and Turnaround Time
17 Steps Samples manually logged into laboratory Verification of Collection at LIS Load individual tubes into centrifuge Centrifuge Samples Unload each tube from centrifuge Split samples for separate workstation Distribute samples to each workstation Visualize Serum Indices Check QC Load sample tube on wheel Results validated and verified at LIS Samples Stored Delta Checking Program tests not validated Rerun tests not validated Identify samples for reflex testing Reflex Testing Fewer steps equal faster, more consistent turnaround Costs & TAT 9 Steps Samples manually logged into laboratory Verification of Collection at LIS Load racks into centrifuge Centrifuge samples Unload racks from centrifuge Place racks on analyzer Rerun tests not validated Identify samples for reflex testing Reflex Testing 5 Steps 3 Steps Samples placed into inlet station Place racks on analyzer Rerun test not validated Reflex Testing automatically Samples stored Samples placed into inlet station Review by exception Samples stored Current Lab Process System-Based Automation Discrete Automation Connected Automation Productivity Increases

11
Steps Automated in the Diagnostic Laboratory
Post-Analytical Pre-Analytical prepare order collect sample transport to lab Sample retrieval accession sample store samples centrifuge dispose of waste post-sort decap tubes transmit test results pre-sort/aliquot technical validation transport to analyzer Analytical

12
Solutions to Streamline the Process
X Pre-Analytics EDTA tubes X Track X Tube Storage & Retrieval X Informatics Receive into lab Sort Sample tubes Load centrifuge Unload centrifuge Decap Label aliquot tubes Aliquot Sort Load in Input Queue Walk to analyzers Pre-Analytics (100% of tubes / >50% of labor) Load analyzers Post-Analytics (100% of tubes / 8% of labor) Store racks Archive tubes Recap tubes Walk to storage area Unload analyzers Verify/ Manage exceptions Rerun exceptions Locate exceptions Verify at LIS To summarize, with Abbott you will have the flexibility to implement some or all of our solutions which will help streamline your process. This diagram depicts a typical laboratory process. By implementing a pre-analytic automation such as ACCELERATOR APS you will be able to automate the most labor intensive processes in the lab. Informatics can address many of the post-analytic steps such as archiving and results validation. Implementation of a track will eliminate the sneaker net and tube storage and retrieval will automate add-on and repeat testing. Furthermore, APS gives you the flexibility to any or all of these components at any time ensuring that your system will grow and change as you do. Find tube Load on analyzer Verify at LIS Unload analyzer Recap tube Archive tubes Store racks Exceptions (10% of tubes)
 Load. analyzers. Post-Analytics (100% of tubes / 8% of labor) Store. racks. Archive. tubes. Recap. tubes. Walk. to storage. area. Unload. analyzers. Verify/ Manage. exceptions. Rerun. exceptions. Locate. exceptions. Verify. at LIS. To summarize, with Abbott you will have the flexibility to implement some or all of our solutions which will help streamline your process. This diagram depicts a typical laboratory process. By implementing a pre-analytic automation such as ACCELERATOR APS you will be able to automate the most labor intensive processes in the lab. Informatics can address many of the post-analytic steps such as archiving and results validation. Implementation of a track will eliminate the sneaker net and tube storage and retrieval will automate add-on and repeat testing. Furthermore, APS gives you the flexibility to any or all of these components at any time ensuring that your system will grow and change as you do. Find. tube. Load on. analyzer. Verify at. LIS. Unload. analyzer. Recap. tube. Archive. tubes. Store. racks. Exceptions (10% of tubes)")
13
Understanding your Processes
Process Mapping Analyze your processes Identify opportunities Eliminate waste Another tool we use in understanding your processes is process mapping. There are different types of process maps that we use to uncover different information, from flow charts and timing diagrams, to Value Stream Mapping and SIPOC illustrations. These different methods and tools all have three things in common, they help analyze your business and processes, 2) Identify opportunities for improvements, and 3) help to identify and uncover wasted efforts or steps that are not needed. Ultimately these drive the future processes.
 Identify opportunities for improvements, and 3) help to identify and uncover wasted efforts or steps that are not needed. Ultimately these drive the future processes.")
14
Metrics for Success Tube Arrival Test/Tube Testing Volume TAT Analysis
Capacity Planning Efficiency The third step in our methodology is to collect measures and metrics for success. These metrics are used for understanding the current state and for designing the future solutions that will optimize the operations of the laboratory. Having a defined understanding of where you are will allow you know how far you need to go to reach your goals. The analysis performed for your laboratory is customized based on your workflow.

15
Laboratory Automation
New Generation of Laboratory Automation

16
Laboratory Automation
New Generation of Laboratory Automation

17
Automated Core Laboratory
New Generation of Laboratory Automation

18
Core Lab We need to have less text on the three bullit points to make the slide easier and be able to talk around it.

19
Regional Labs We need to have less text on the three bullit points to make the slide easier and be able to talk around it.

20
Satellite Labs We need to have less text on the three bullit points to make the slide easier and be able to talk around it.

26
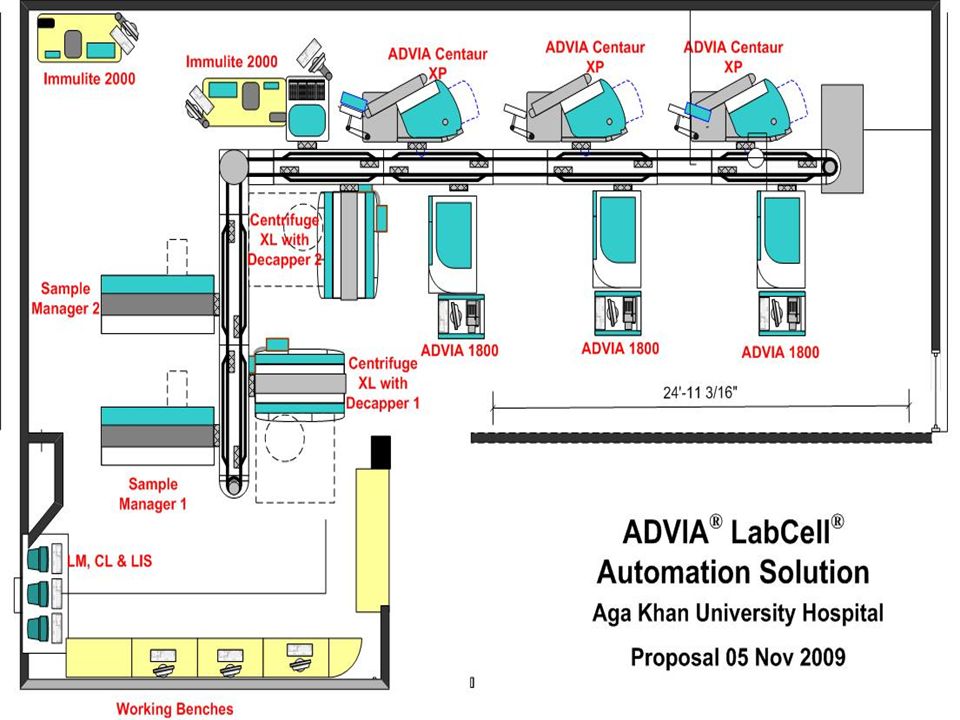
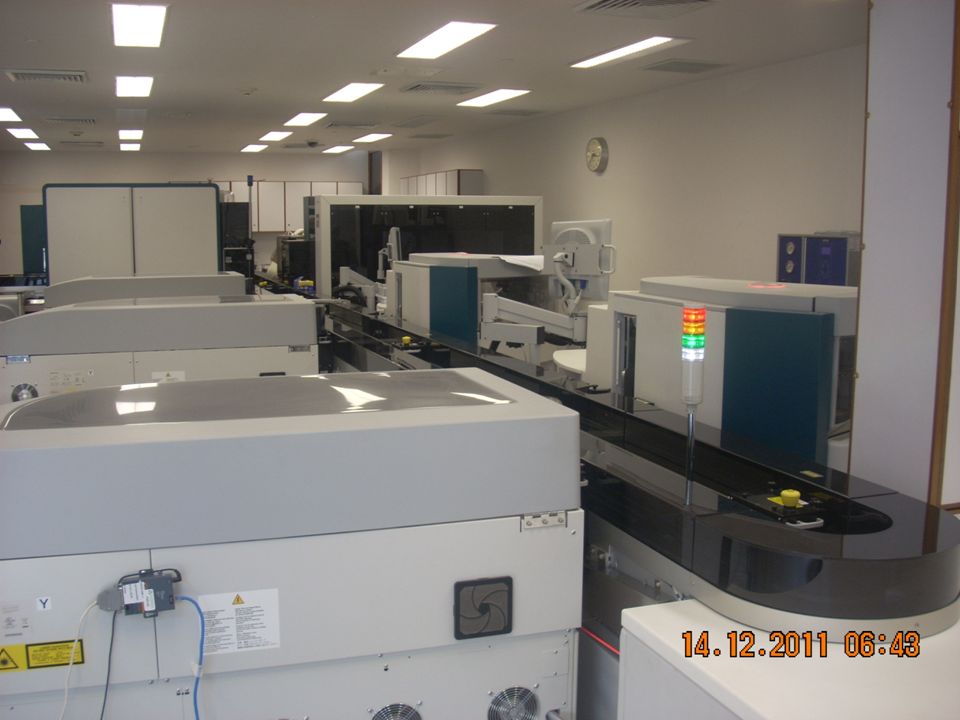
ADVIA® Automation Let me now provide you with a brief overview of what Siemens automation is. Siemens automation basically has three aspects: Sample Manager, Track and Instrument (in this case, IMMULITE, ADVIA 1800 and Centaur XP) The sample manager is the heart of the system. It is the area in which you load and unload specimens…therefore, only one area to perform testing on three different platforms (in this example). The Sample Manager has capacity for 1000 tubes (separated into 10 trays of 100 tubes). Once you load a tray, which you see in the video in just a moment, the sole robotic arm within the SM loads the specimens, one at a time, onto the track. Once they are put onto the track, the barcode is read, the specimen is auto-received (or accessioned) and then it is routed to where it needs to go. Once it has travelled to the appropriate instruments and components, it is routed back to the SM for post-analytical sorting. In other words, when the SM unloads tubes from the track, it sorts them into pre-designated trays for archival. Run Video
 The sample manager is the heart of the system. It is the area in which you load and unload specimens…therefore, only one area to perform testing on three different platforms (in this example). The Sample Manager has capacity for 1000 tubes (separated into 10 trays of 100 tubes). Once you load a tray, which you see in the video in just a moment, the sole robotic arm within the SM loads the specimens, one at a time, onto the track. Once they are put onto the track, the barcode is read, the specimen is auto-received (or accessioned) and then it is routed to where it needs to go. Once it has travelled to the appropriate instruments and components, it is routed back to the SM for post-analytical sorting. In other words, when the SM unloads tubes from the track, it sorts them into pre-designated trays for archival. Run Video.")
27
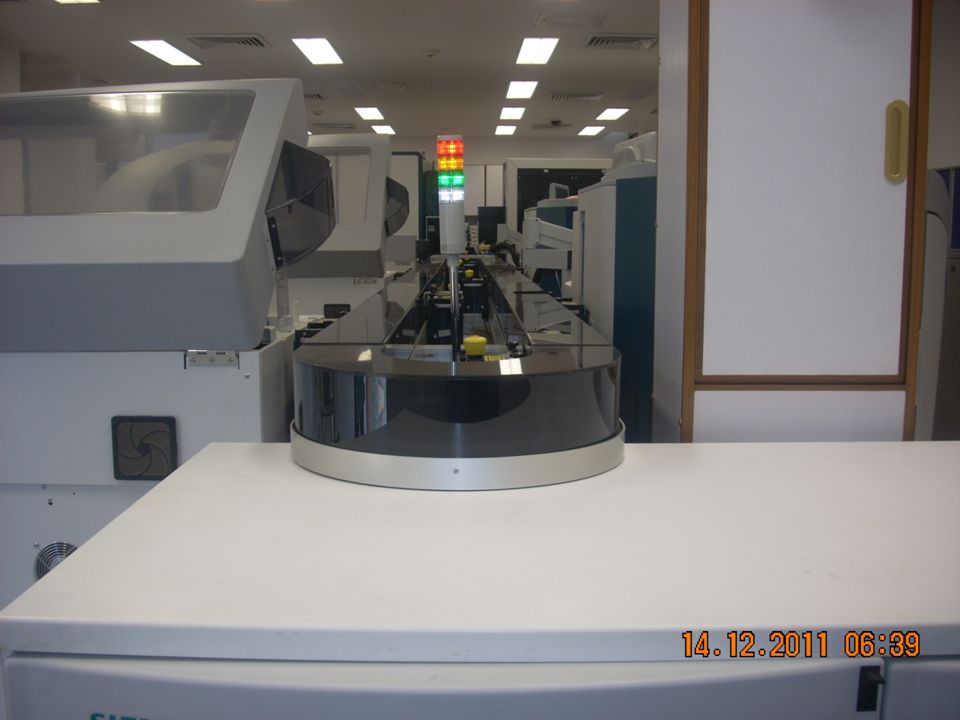
ADVIA® Automation Next let’s look at the track. The track system is a two-lane, puck-based, system. In other words, tubes are handled individually (they go to where they need to go ONLY)..and the two lane system maximizes efficiency because the tube ahead is never impeding the one behind, as it all tubes are routed to “divert lanes” or service roads when a particular test is requested. Run Video
..and the two lane system maximizes efficiency because the tube ahead is never impeding the one behind, as it all tubes are routed to divert lanes or service roads when a particular test is requested. Run Video.")
28
ADVIA® Automation Solution User Outcomes
2004 2006 2007 2008 Reporting errors 60% reduction in error And lastly, U of M also realize a 60% decrease in reporting errors from ’04 to ’08. How much is an error worth? Individual results may vary.

29
Process Efficiency Tubes (thousands) 5 4 3 2 Primary tubes 1 % 100 75
50 25 Aliquots $1,600 savings 98% reduction This slide represents outcome evidence from an existing customer of ours, ACM in Rochester NY…whereby they implemented ADVIA Automation and realized significant efficiencies…specifically surrounding this concept of maximizing their automated menu. By connecting multiple instruments to a common track, they were able to share tubes between systems without the need of creating incremental (daughter or aliquot) tubes. This saved them nearly 2,000/day, which totalled $1,600 in savings per month….just in tubes! They were able to accomplish this b/c of their decreased requirement to aliquot - by 98% (remember, tubes = work…the more tubes you create the more work you create). Not to mention the pure cost of creating tubes (tube costs, label costs, tips costs etc…) Prior to ADVIA Automation, they were virtually aliquotting everything! Lastly, due to the fact that ACM was handling their tubes less (performing less aliquots and generating less tubes) they have reduced their chance of mis-labelling to a 1:1600 chance! By the way, just like most ADVIA Automation peak performance labs, their workload nearly doubled to approx. 5MM tests/year! Source: ACM lthcare Diagnostics Inc. Individual results may vary.
 tubes. This saved them nearly 2,000/day, which totalled $1,600 in savings per month….just in tubes! They were able to accomplish this b/c of their decreased requirement to aliquot - by 98% (remember, tubes = work…the more tubes you create the more work you create). Not to mention the pure cost of creating tubes (tube costs, label costs, tips costs etc…) Prior to ADVIA Automation, they were virtually aliquotting everything! Lastly, due to the fact that ACM was handling their tubes less (performing less aliquots and generating less tubes) they have reduced their chance of mis-labelling to a 1:1600 chance! By the way, just like most ADVIA Automation peak performance labs, their workload nearly doubled to approx. 5MM tests/year! Source: ACM. lthcare Diagnostics Inc. Individual results may vary.")
30
Technology Adoption Life Cycle

31
Thank You

32
Thank You

Similar presentations


 examples of Input Devices. Define the term Data. In what phase of the DPLC would you find data? 1/18/2012Ms.>")


 and Specimen Quality Emergency Department “I want SPEED” “I want specimen QUALITY & PURITY”>")


 are.>")


. You can freely download, adapt, and distribute this.>")
