Download presentation
Presentation is loading. Please wait.

1
Using Data to Improve Student Achievement Secondary Mathematics Preschool Inservice 2006

2
Outcomes 1.Know why we need to look at data 2.Identify two types of tests 3.Understand three types of scores 4.Understand Summative & Formative Assessments 5.Be able to interpret Summative Assessment Reports 6.Know how to use data in instructional planning for increased student learning

3
Why Look at Data? The purpose of data is to give educators: INSIGHT DIRECTION DIRECTIONFEEDBACK

4
Types of Tests Norm-Referenced Test (NRT) Norm-Referenced Test (NRT) Criterion- Referenced Test (CRT) Criterion- Referenced Test (CRT)
 Norm-Referenced Test (NRT) Criterion- Referenced Test (CRT) Criterion- Referenced Test (CRT)")
5
What is a Norm-Referenced Test (NRT)? A standardized assessment in which all students perform under the same conditions. Compares the performance of a student to other students nationally. Norm groups are students in the same grade and age. Example: FCAT NRT

6
What is a Criterion-Referenced Test (CRT)? An assessment comparing one student's performance to a specific learning objective or performance standard and not to the performance of other students. For example: FCAT SSS (Sunshine State Standards)
.")
7
Summary NRT and CRT TYPE Norm- referenced Test (NRT) Criterion- referenced Test (CRT) DEFINITION Shows how a student does in relation to a norm group Shows how a student does in relation to a standard EXAMPLES FCAT NRT PSAT FCAT SSS Class Tests AP Exams SAT/ACT
 Criterion- referenced Test (CRT) DEFINITION Shows how a student does in relation to a norm group Shows how a student does in relation to a standard EXAMPLES FCAT NRT PSAT FCAT SSS Class Tests AP Exams SAT/ACT")
8
Types of Scores

9
Raw Score (RS) The number of items a student answers correctly on a test. John took a 20 item mathematics test (where each item was worth one point) and correctly answered 17 items. His raw score for this assessment is 17.
 and correctly answered 17 items. His raw score for this assessment is 17..")
10
Scale Score (SS) Mathematically converted raw scores based on level of difficulty per question. For FCAT-SSS, a computer program is used to analyze student responses and to compute the scale score. Scale Scores reflect a more accurate picture of the student’s achievement level.

11
Scale Score (SS) Higher scale scores indicate higher proficiency. On a continuous, vertical scale across grade levels you can track a student's progress from lower to upper grade levels on one scale. Growth in scale score units indicates growth in proficiency. For FCAT-SSS, the Developmental Scale Score is used to determine a student’s annual progress from grade to grade.

12
Gain Scores Commonly referred to as “Learning Gains” The amount of progress a student makes in one school year.

13
Learning Gains: Who Qualifies? Students from all subgroups (all students, ESE, LEP, etc.) with matched, consecutive year (i.e. 2005 & 2006) FCAT SSS results (a pre- and post-test) in grades 4-10, who were enrolled in the same school during the October & February FTE Count.
 with matched, consecutive year (i.e & 2006) FCAT SSS results (a pre- and post-test) in grades 4-10, who were enrolled in the same school during the October & February FTE Count..")
14
Learning Gains: Which Scores? Gains apply in reading and math, not writing or science. Pre-tests may be from same school, same district, or anywhere in the state.

15
Learning Gains: What equals Adequate Yearly Progress (AYP)? A. I mprove FCAT Achievement Levels from 2005 to 2006 (e.g. 1-2, 2-3, 3-4, 4-5) or B. Maintain “satisfactory” Achievement Levels from 2005-2006 (e.g. 3-3, 4-4, 5-5) or C. Demonstrate more than one year’s growth within Level 1 or Level 2 - determined by DSS Cut Points (not applicable for retained students)
 or B. Maintain satisfactory Achievement Levels from (e.g. 3-3, 4-4, 5-5) or C. Demonstrate more than one year’s growth within Level 1 or Level 2 - determined by DSS Cut Points (not applicable for retained students).")
16
FCAT SSS Developmental Scale

17
MATH Graduation Passing Score DSS 1889 or Higher Grade Level 1 Level 2 Level 3 Level 4 Level 5 3375-10781079-12681269-15081509-17491750-2225 4581-12761277-14431444-16571658-18621863-2330 5569-14511452-16311632-17681769-19561957-2456 6770-15531554-16911692-18591860-20182019-2492 7958-16601661-17851786-19381938-20792080-2572 81025-17321733-18501851-19971998-20912092-2605 91238-17811782-19001901-20222023-21412142-2596 101068-18311832-19461947-20492050-21922193-2709

18
Learning Gains: Retainees A retained student can only be counted as making adequate progress if he/she: Moves up one level. (e.g. 1-2, 2-3, 3-4, 4-5) Maintains a level 3, 4, or 5.
 Maintains a level 3, 4, or 5..")
19
Developmental Scale Score Gains Table (DSS Cut Points) Students achieving within Level 1 (or within Level 2) for two consecutive years must gain at least one point more than those listed in the table in order to satisfy the “making annual learning gains” component of the school accountability system. Grade Level Change ReadingMathematics 3 to 4 230162 4 to 5 166119 5 to 6 13395 6 to 7 11078 7 to 8 9264 8 to 9 7754 9 to 10 7748

20
Learning Gains: Activity Using the data on the following table, determine: 1.Which students made a learning gain? 2.What percentage of the teacher’s students made a learning gain?

21
Data Display for FCAT Mathematics Results Student 04/05 Grade Level 05/06 Grade Level Pre-test Achievement Level Pre- test DSS Post-test Achievement Level Post- test DSS Learning Gain Determination A78 Level 1 Level 2 Yes or No Reason: A, B, or C B78 Level 4 Yes or No Reason: A, B, or C C78 Level 2 1598 1743 Yes or No Reason: A, B, or C D88 Level 1 Level 2 Yes or No Reason: A, B, or C E88 Level 3 Yes or No Reason: A, B, or C F88 Level 1 1486 1653 Yes or No Reason: A, B, or C G78 Level 5 Level 4 Yes or No Reason: A, B, or C

22
Teacher Learning Gains Based on Data Display 5 out of 7 students made learning gains. 71% of this teacher’s students made learning gains and add points towards the school’s grade. No points are given to the school for Student F because he was retained and stayed within level 1 – even though he made significant gains in DSS points. No points are given to Student G because he decreased a level. Total Number of Students with a Pre and Post-test who qualify for learning gain calculations: Reason A Increased 1 or more Achievement Levels Reason B Maintains “satisfactory” levels (3, 4, or 5) Reason C DSS Target Gain (More than a year’s growth) 7221
 Reason C DSS Target Gain (More than a year’s growth)")
23
FCAT Parent Report Spring 2005 Florida Comprehensive Assessment Test (FCAT) SSS Mathematics Student and Parent Report Grade 10 Your 2005 Math Results You have passed the grade 10 FCAT Mathematics test and your score is on grade level. You answered many of the questions on FCAT correctly. Aprobaste el examen de Lectura del FCAT para el grado 10 y tu al nivel. Respondiste a muchas de las preguntas del FCAST correctamente. Aprobaste el examen de Lectura del FCAT para el grado 10 y tu calificación está al nivel. Respondiste a muchas de las preguntas del FCAST correctamente. Ou pase eqzamen Leketi FCAT yo bay Klas nan epi ou yon ki nan nivo klas la. Ou reponn anpil nan kesvon FCAT yo san fot. Ou pase eqzamen Leketi FCAT yo bay Klas 10yèm nan epi ou fè yon nòt ki nan nivo klas la. Ou reponn anpil nan kesvon FCAT yo san fot. CONTENT SCORES Objective Number Possible Number Correct Number Sense & Operations 2013 Patterns, Relationships, Algebra 106 Data, Statistics, & Probability 87 Geometry & Measurement 105

24
Types of Data Results(Summative) Data used to make decisions about student achievement at the end of a period of instruction. Process(Formative) Data gathered at regular intervals during the instructional period; used to provide feedback about student progress and to provide direction for instructional interventions.
 Data gathered at regular intervals during the instructional period; used to provide feedback about student progress and to provide direction for instructional interventions..")
25
A Closer Look at Results Data Examples:

26
What tools do we have? FCAT Inquiry (Summative) Teacher Tools for Data Collection (Can be Summative or Formative) Histogram Pareto Chart Run Chart Scatter Diagram Item Analysis
 Teacher Tools for Data Collection (Can be Summative or Formative) Histogram Pareto Chart Run Chart Scatter Diagram Item Analysis.")
27
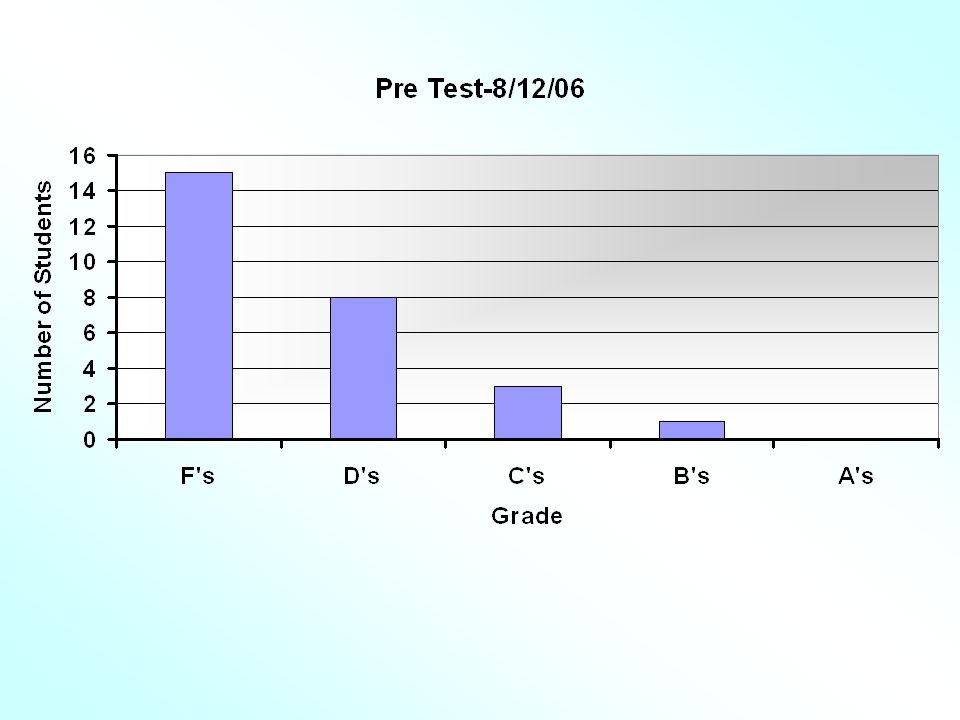
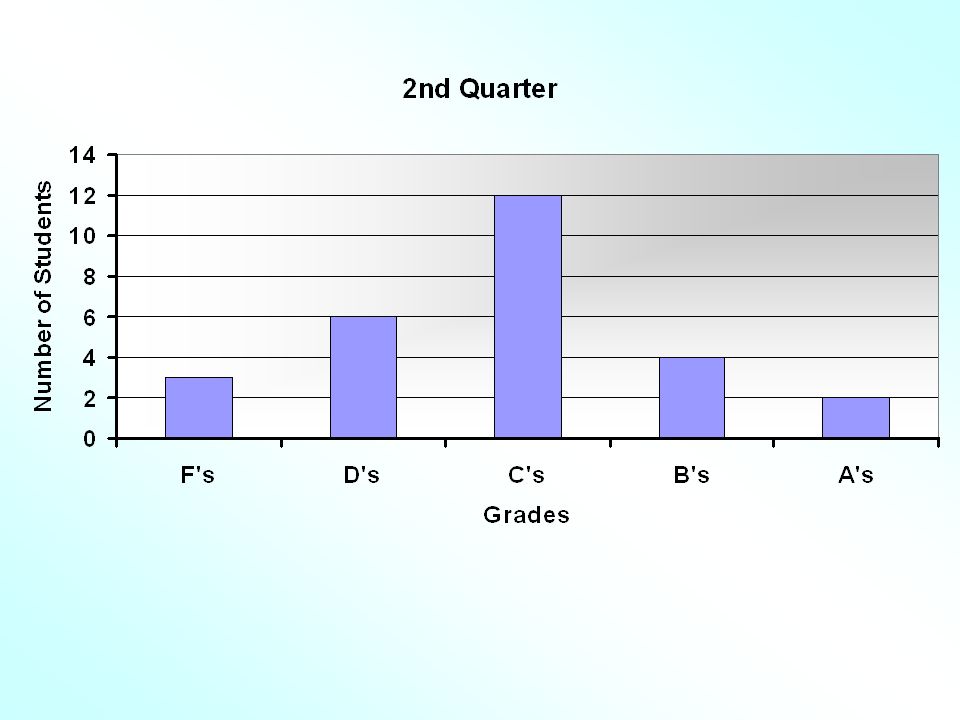
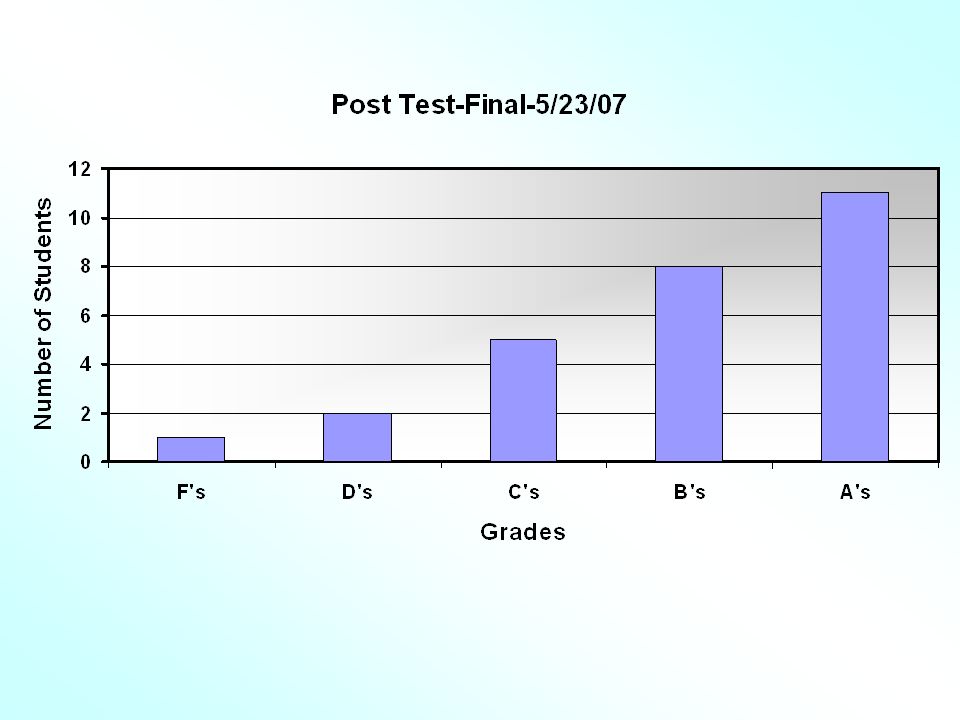
Histogram Bar chart representing a frequency distribution of student scores Heights of the bars represent number of students scoring at same level/score Used to Monitor progress

28
Histogram: Pre-Algebra Midterm Test Percentage Correct Number of Students

32
Histogram: Grade Distribution in 8th Grade Math Frequency 0 10 20 30 40 50 6070 0-10 11-20 21-30 31-40 41-50 51-60 61-70 71-80 81-90 91-100 Grade

33
Activity Lee County Grade 8 Mathematics Scores Percentage of Students by Achievement Level YearLevel 1Level 2 Levels 1-2Level 3Level 4Level 5 Levels 3-5 20012322453314956 200222 443314855 20032023433514857 200423214431151157 200521204134151059 20061921403516960

34
Activity Answer

35
Pareto Chart Use to: Rank issues in order of occurrence Decide which problems need to be addressed first Find the issues that have the greatest impact Monitor impact of changes

36
Pareto Chart: Types of mistakes in Division Problems 0 10 20 30 40 50 60 70 80 90 100 IncorrectmultiplicationIncorrect subtraction subtraction No decimal Other Mistake Percent 0 10 20 30 40 50 60 70 80 90 100 Cumulative percentage

37
Pareto Chart Data FCAT Errors by subtest for one student Strand Frequency of Errors Percentage of Errors Cumulative Percentage Geometry7 7/24 = 29% 29% Measurement5 5/24 = 21% 50% Algebra5 71% Number Sense 4 4/24 = 17% 88% Data Analysis 3 3/24 = 12% 100% Total24 24/24 = 100%

38
Megan Smith - Grade 9 - FCAT Subtest Scores

39
2005/2006 - 9th Grade - Lee County FCAT Errors by Subtest

40
Computation Computation Number Sense Number Sense Measurement Measurement Geometry Geometry Statistics & Probability Statistics & Probability Number Facts Number Facts Whole Number Concepts Whole Number Concepts Patterns Patterns Problem Solving Problem Solving Fractions & Decimals Fractions & Decimals Computation in Context Computation in Context FCAT Scores for One Teacher Where are the errors (or improvements)?
")
41
Run Chart Use to: Monitor progress over time Display data in simplest form Run Chart: Percent of Students Scoring at Least 80% on Weekly Math Quiz Number of Students Percent

42
Student Run Charts The place to start is with students graphing their own progress.

43
Run Chart: Number of Math Vocabulary Words 140 145 150 155 160 165 170 175 180 123456789 Week Number of Words Correct

44
Class Goal: By the end of 9 weeks, 100% of our class will have an average of at least 80% on our weekly math quizzes. Class Run Chart: Percent of Students Averaging at Least 80% on Weekly Math Quizzes 0 10 20 30 40 50 60 70 80 90 100 123456789 Week Percent w/ avg. of at least 80%

45
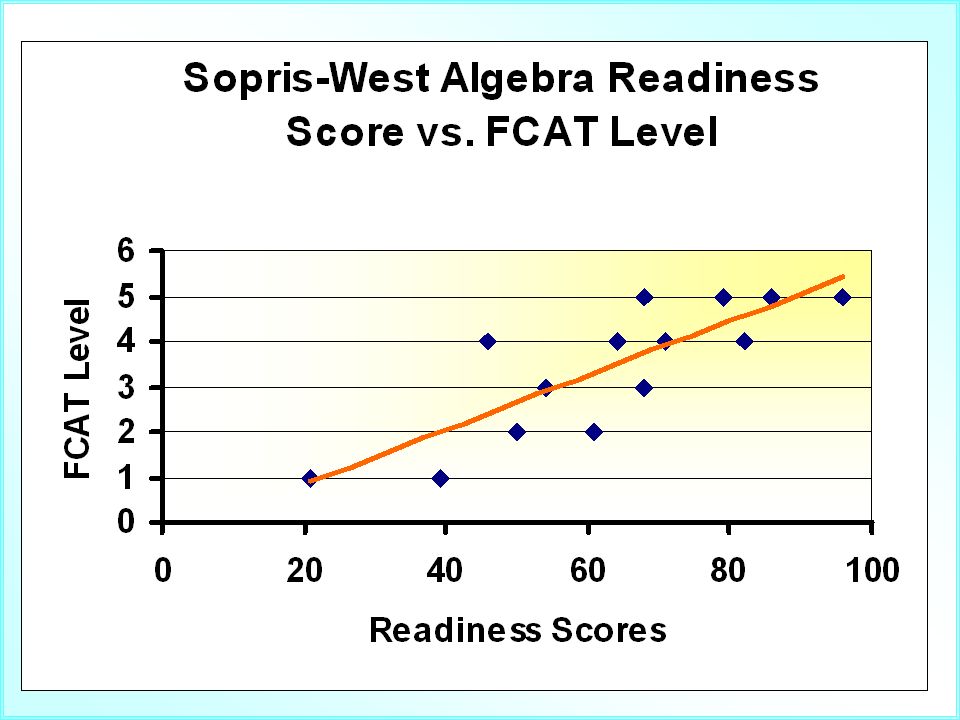
Scatter Diagram Scatter Diagram: Teacher Salary vs. FCAT Test Scores 1 2 3 4 5 0 20406080100 Teacher Salary FCAT Test Scores 0

46
Scatter Diagram: Number of Siblings vs Grade Point Average vs Grade Point Average0.0 0.5 1.0 1.5 2.0 2.5 3.0 3.5 4.0 4.5 0 123456 Number of Siblings Grade Point Average

47
Scatter Diagram: Hours of Sleep vs. Mistakes on Test 0 2 4 6 8 10 12 0 12345678910 Hours of Sleep Mistakes

48
StudentScoreLevel 1965 2644 3685 4865 5714 6865 7824 8795 9683 10464 11502 12391 13211 14543 15612

50
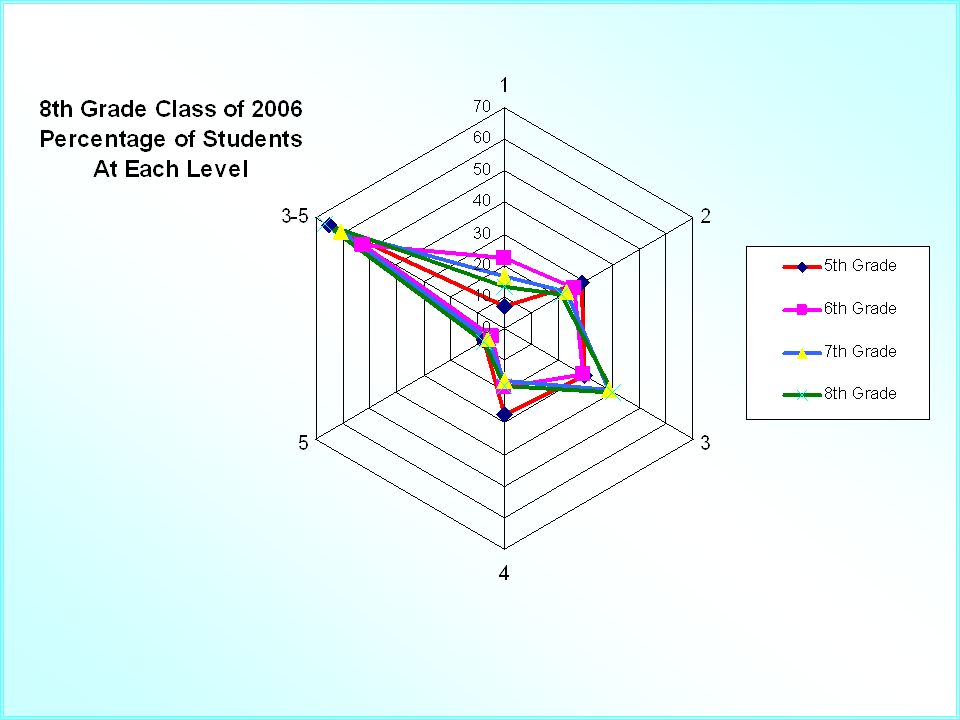
Radar Chart

51
Example 8 TH Grade Class of 2006 Total Students Tested Percentage of Total Scoring at Level 123453-5 5 th Grade 3227.128.329.827.37.564.6 6 th Grade 353 22.125.528.918.45.152.4 7 th Grade 34316.32338.216.36.160.6 8 th Grade 43913214018866

53
Item Analysis Use to: Determine mastered content content Determine most common mistakes mistakes

54
CLASSROOM TEST ANALYSIS BENCHMARK ASSESSED ITEM # NUMBER CORRECT NUMBER INCORRECT NUMBER PARTIAL CREDIT NUMBER DISTRACTOR A/1 NUMBER DISTRACTOR B/2 NUMBER DISTRACTOR C/3 NUMBER DISTRACTOR D/4 NUMBER NO ANSWER 1 2 3 4 5 6 7 8 9 10

55
Studentq1q2q3q4q5q6q7q8q9q10 111 44233 11 2 2124423422 2 3124423132 2 41244233 11 2 513 44231134 612442334 31 73 24423244 2 81241 233 132 9123 4233 14 2 1012444 31121 114 2442312 33 1212444 33 133 131244234232 Correct Answer 1244231132 ITEM ANALYSIS ACTIVITY

56
Using Formative Data for Continuous Improvement

57
Random sampling of end-of the year items provides students a constant review of what has been taught and a constant preview of what is yet to be taught.

58
The square root of “n” is an ample sample size for accurate data, if collected weekly or bi-weekly.

59
Random Selection Drawing from a “hat” or fishbowl Dice Computer spread sheets Graphing Calculator www.randomizer.org Popsicle Sticks Ping-pong balls Bingo Transparency question 100- sided die from Gamescience (228) 392-4177
")
60
Data analysis provides: Insight and Questions

61
Adapted from Getting Excited About Data, Edie Holcomb www.corwinpress.com WWWWhat question are we trying to answer? WWWWhat can we tell from the data? WWWWhat can we NOT tell from the data? WWWWhat else might we want to know? WWWWhat good news is here for us to celebrate? WWWWhat opportunities for improvement are suggested by the data? Questions to Ponder…

62
Action Answers! Provides

63
Implement the plan. Analyze the results. Make improvements. Steps to Improvement PLAN DO STUDY ACT What information have I gained from my data? What interventions can I put in place?

64
Personal Action Plan What data can I access? What tools can I use to help me monitor progress toward our class goals? What/who else do I need to help me? What is my start date? How will I evaluate the results? P D S A

Similar presentations


 Curt Nath Director of Curriculum Ocean City School District.>")


