Download presentation
Presentation is loading. Please wait.

1
1 Canadian Institute for Health Information

2
Chartbook: Trends in National Health Expenditure, 1975 to 2013 2

3
The following slides are provided to facilitate reuse in your own presentations Please cite as follows: Canadian Institute for Health Information. Chartbook: Trends in National Health Expenditures, 1975 to 2013. Ottawa, ON: CIHI; 2013. To download the data tables in Excel format, please visit www.cihi.ca/nhex. www.cihi.ca/nhex 3

4
This presentation Key findings –How much is being spent on health care? –What is the money being spent on? –Why is health spending increasing? –How does Canada compare internationally? Looking forward –Issues to monitor in the future 4

5
How much will we spend on health in 2013? 5

6
What is the money being spent on? 6

7
Where does the money come from? 7

8
What is the money being spent on? 8

9
How do the provinces and territories compare? 9

10
How does Canada compare internationally? 10 2010 is the latest year available. *

11
How much is being spent on health care? 11

12
There have been three distinct periods of growth in health spending since 1975 12 2013

13
A fourth period is emerging 13

14
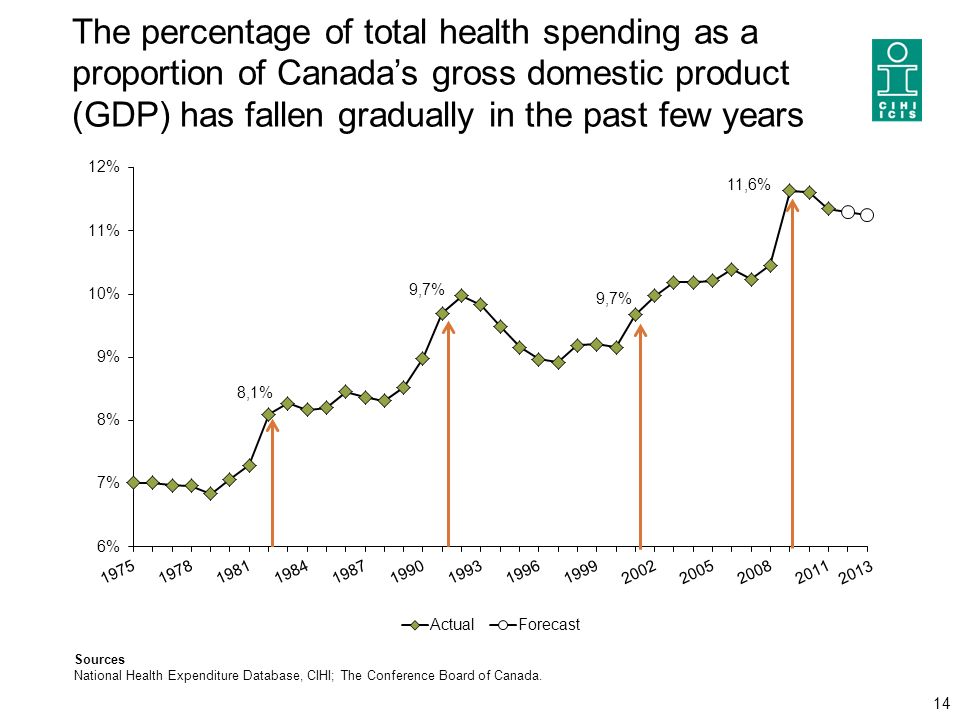
The percentage of total health spending as a proportion of Canada’s gross domestic product (GDP) has fallen gradually in the past few years 14 Sources National Health Expenditure Database, CIHI; The Conference Board of Canada. 2013
15
Public/private split unchanged 15 Source National Health Expenditure Database, CIHI.

16
Where does the money come from? 16 Note 2011 actual data. Sources National Health Expenditure Database, CIHI; Statistics Canada. Public Sector Private Sector

17
There is a difference of $1,600 between the highest and lowest spenders 17 Note f: forecast. Sources National Health Expenditure Database, CIHI; Statistics Canada.

18
On average, provincial/territorial governments spend almost 40% of their budgets on health care 18 20082012f Canada Average39%38% Note f: forecast. Sources National Health Expenditure Database, CIHI; Statistics Canada.

19
Public-sector health spending is growing faster than revenues; spending on other government programs also continues to increase 19 Source Statistics Canada.

20
What is the money being spent on? 20

21
About 60% of total health spending is directed to hospitals, drugs and physicians 21 Note 2011 actual data. Source National Health Expenditure Database, CIHI.

22
Spending on hospitals declined in the last decade as spending on drugs and other expenditures increased 22 Note f: forecast. Source National Health Expenditure Database, CIHI. 2013 f1993

23
On average, we spend three times more on older seniors than on younger seniors 23 Sources National Health Expenditure Database, CIHI; Statistics Canada.

24
Share of health spending on seniors has risen only slightly since 2001 24 Sources National Health Expenditure Database, CIHI; Statistics Canada.

25
Compared with 2001, share of spending on older adults (55 to 64) and older seniors (75+) is higher 25 Sources National Health Expenditure Database, CIHI; Statistics Canada.
 and older seniors (75+) is higher 25 Sources National Health Expenditure Database, CIHI; Statistics Canada.")
26
How does Canada compare internationally? 26

27
Canada’s per person spending is just more than half of what is spent on health care in the U.S. but higher than the OECD average 27 Average: $3,410 Notes * Data for 2010. ‡ Data for 2008. Source OECD Health Data 2013, June edition.

28
Canada spends more on health as a percentage of its economy than most OECD countries 28 Notes * Data for 2010. ‡ Data for 2008. Source OECD Health Data 2013, June edition.

29
The ratio of health spending to GDP increased in all G7 countries in the last decade 29

30
The share of health spending funded by the public sector in Canada is less than the OECD average 30 Average: 73.3% Notes * Data for 2010. ‡ Data for 2008. Source OECD Health Data 2013, June edition.

31
As GDP grows, so does per person health spending 31

32
Health spending growth in 2013 mainly driven by inflation and population growth, unlike period 2001 to 2011 32 Average Annual Growth Rate, 2001 to 2011 Note f: forecast. Sources National Health Expenditure Database, CIHI; Statistics Canada.

33
The contribution of population increases and aging to growth in health spending varied from province to province (2001 to 2011) 33
 33")
34
Looking forward: Issues to monitor in the future New Canada Health Transfer formula –Growth in health care funding in line with GDP growth Moderating effects of economic growth and government deficits Growth in number of physicians and physician compensation Population aging and potential impact on spending 34

35
Why is health spending increasing? Canadians are using more health services Increased number of health care providers, with higher wages Newer and more costly drugs, diagnostic tests and surgical procedures 35

36
More Information The annual report National Health Expenditure Trends, 1975 to 2013 provides an overview of How much is spent on health care every year What the money is used for Where that money comes from To download the annual report, information sheets, presentations, methodological notes or up-to-date data tables, all free of charge, visit our website at www.cihi.ca/nhex www.cihi.ca/nhex Feedback and questions are welcome at nhex@cihi.canhex@cihi.ca 36

37
Thank you 37

Similar presentations


 Demidov A. Klischenkova N. Kulygina.>")


 Central Government sets insurance standards through.>")
