Download presentation
Presentation is loading. Please wait.

1
Ilulissat Climate Days, Greenland, 4 June 2015 Greenland – a white spot on the map of the internationally coordinated glacier monitoring? Michael Zemp, Richard Armstrong, Florence Fetterer, Isabelle Gärtner-Roer, Martin Hoelzle, Fabia Hüsler, Andreas Kääb, Jeff Kargel, Nico Mölg, Samuel Nussbaumer, Frank Paul, Bruce Raup

2
Greenland – a white spot on the map of the int. coordinated glacier monitoring? www.discover-the-world.co.uk Glaciers around the GIS How much glacier ice around the GIS? How fast are these glacier changing? Do we have a double counting in sea level rise contribution from Greenland?

3
gtn-glaciers ¦ distribution ¦ changes ¦ conclusions International Council for Science (ICSU): “A basic requirement for advancing research is free and unrestricted international sharing of high-quality, long-term, and standardized data and information products.” As a consequence, the Global Climate Observing System (GCOS) set in place a Global Terrestrial Network (GTN) for all Essential Climate Variables in support of the United Nations Framework Convention on Climate Change (UNFCCC). www.gtn-g.org

4
Glacier distribution around the Greenland Ice Sheet gtn-glaciers ¦ distribution ¦ changes ¦ conclusions Weidick (1998): >70,000 km 2 Weidick (1998)
: >70,000 km 2 Weidick (1998)")
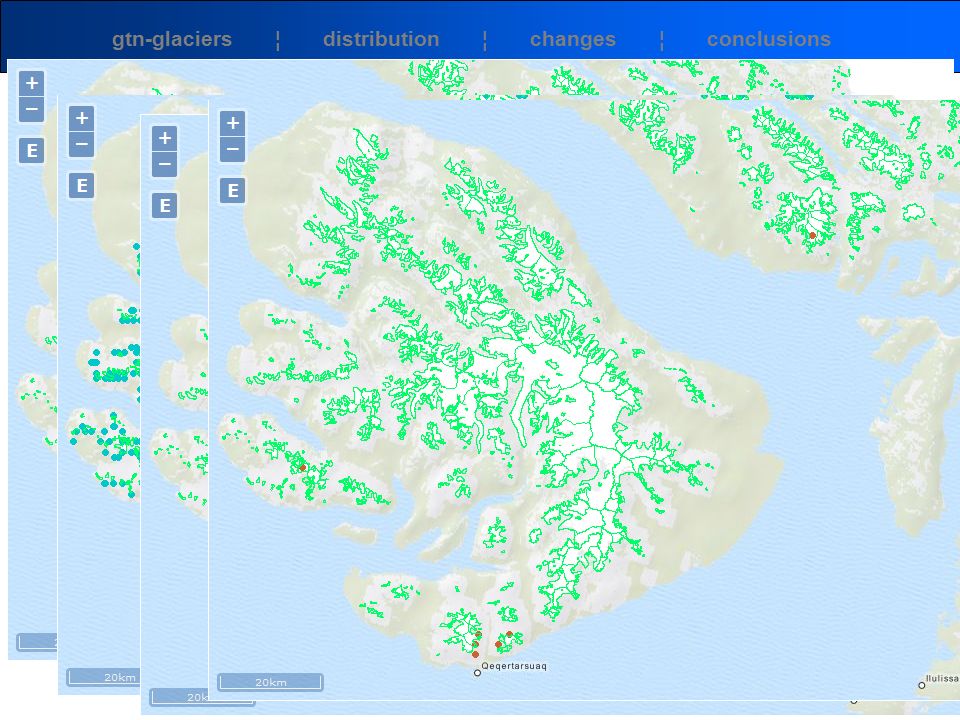
5
Glaciers surface area gtn-glaciers ¦ distribution ¦ changes ¦ conclusions www.gtn-g.org Weidick (1998): >70,000 km 2 Rastner et al. (2012): 20,280 glaciers > 0.05 km 2 89,720 km2 (CL0&CL1) 130,076 km2 (CL0&CL1&CL2) 70 Landsat scenes 1999-2002
: 20,280 glaciers > 0.05 km 2 89,720 km2 (CL0&CL1) 130,076 km2 (CL0&CL1&CL2) 70 Landsat scenes")
6
gtn-glaciers ¦ distribution ¦ changes ¦ conclusions Rastner et al (2012)
")
7
Gärtner-Roer et al. (2014) Glaciers volume gtn-glaciers ¦ distribution ¦ changes ¦ conclusions Radic & Hock (2010) based on WGI 17,865 km 3 = 44 mm SLE Huss & Farinotti (2012) based on RGI 19,042 km 3 = 47 mm SLE Radic & Hock (2010) based on WGI 17,865 km 3 = 44 mm SLE Huss & Farinotti (2012) based on RGI 19,042 km 3 = 47 mm SLE Uncertainty: 30-50% (Gärtner-Roer et al. 2013) www.gtn-g.org
 Glaciers volume gtn-glaciers ¦ distribution ¦ changes ¦ conclusions Radic & Hock (2010) based on WGI 17,865 km 3 = 44 mm SLE Huss & Farinotti (2012) based on RGI 19,042 km 3 = 47 mm SLE Radic & Hock (2010) based on WGI 17,865 km 3 = 44 mm SLE Huss & Farinotti (2012) based on RGI 19,042 km 3 = 47 mm SLE Uncertainty: 30-50% (Gärtner-Roer et al. 2013)")
8
Glaciers volume gtn-glaciers ¦ distribution ¦ changes ¦ conclusions Radic & Hock (2010) based on WGI 17,865 km 3 = 44 mm SLE Huss & Farinotti (2012) based on RGI 19,042 km 3 = 47 mm SLE Uncertainty: 30-50% (Gärtner-Roer et al. 2013) www.gtn-g.org Knecht (2014)
 Knecht (2014).")
9
Glacier changes gtn-glaciers ¦ distribution ¦ changes ¦ conclusions Front variations from 78 glaciers Back to mid 19 th century Leclercq et al. (2012) www.gtn-g.org
")
10
Glacier changes gtn-glaciers ¦ distribution ¦ changes ¦ conclusions Front variations from 78 glaciers Back to mid 19 th century Glaciol. balances from 8 glaciers Mittivakkat since 1995 Freya since 2007 Amitsuloq 1981-90 Geodetic balances from 1 glacier Flade Isblink Ice Cap 2002-09 www.gtn-g.org

11
Glacier changes gtn-glaciers ¦ distribution ¦ changes ¦ conclusions From glaciological and geodetic obs.: Ba1980s/90s/00s: -0.6/-0.9/-1.1 m w.e. a -1 SLR contribution: 50-100 Gt per year …but based on very few glaciers! …representativeness for SLR contr.? www.gtn-g.org Zemp et al. (in press)
.")
12
Glacier changes gtn-glaciers ¦ distribution ¦ changes ¦ conclusions From glaciological and geodetic obs.: Ba1980s/90s/00s: -0.6/-0.9/-1.1 m w.e. a -1 SLR contribution: 50-100 Gt per year …but based on very few glaciers! …representativeness for SLR contr.? From ICESat based on Bolch et al. (2013): SLR contribution 2003-08… ..28 Gt per year for C0&C1 ..41 Gt per year for C0&C1&C2 => 2.5 times the specific mass loss of the GIS => up to 20% of the GIS contribution to SLR Bolch et al. (2013)
: SLR contribution … ..28 Gt per year for C0&C1 ..41 Gt per year for C0&C1&C2 => 2.5 times the specific mass loss of the GIS => up to 20% of the GIS contribution to SLR Bolch et al. (2013).")
13
Do we have a double-counting in SLR contribution from Greenland? Gardner et al. (2013) gtn-glaciers ¦ distribution ¦ changes ¦ conclusions
 gtn-glaciers ¦ distribution ¦ changes ¦ conclusions.")
14
www.discover-the-world.co.uk Conclusions Over the past five years, we have strongly improved our knowledge about glaciers around the Greenland Ice Sheet. However, we still need… ..more, longer, and richer obs. series ..a better coordination between the glacier and the ice sheet research communities, Need for glacier data? (GCOS need a home for the ice sheet data…) www.gtn-g.org
")
16
Kääb et al. (2013) Elevation changes from ICESat
 Elevation changes from ICESat")
17
gtn-glaciers ¦ distribution ¦ changes ¦ conclusions

Similar presentations


, all ice sheet (ph. 2) SEC: Surface elevation changes, ERS/Envisat/CryoSat, 1991-2014 GLL: Grounding.>")


