Download presentation
Presentation is loading. Please wait.

1
Understanding General Aid Erin Fath, Assistant Director, School Financial Services Team, DPI Bob Avery, Director of Business Services, Beaver Dam Unified School District Karen Kucharz Robbe, Finance Consultant, School Financial Services Team, DPI

2
Review of Underlying Principles of Equalization Aid Walk-Thru the Equalization Aid Worksheet Discuss Other General Aid Programs, including “Special Adjustment” (aka “Hold Harmless”) Aid 2
 Aid 2")
3
A.Sample District (% method Equalization Aid) District-Specific 2013-14 October 15 Certification (% method Equalization Aid) B.Simplified Percentage Method Scenario Handout District-Specific 2014-15 July 1 Estimate (statutory method Equalization Aid) C.Sample Longitudinal Equalization Aid District-Specific Longitudinal Equalization Aid Power Point Slides
 District-Specific October 15 Certification (% method Equalization Aid) B.Simplified Percentage Method Scenario Handout District-Specific July 1 Estimate (statutory method Equalization Aid) C.Sample Longitudinal Equalization Aid District-Specific Longitudinal Equalization Aid Power Point Slides")
4
4 4 Under Article 10 of WI State Constitution, the State Legislature is responsible for establishing school districts which are to be: “as uniform as practicable … ” “free and without charge for tuition to all children” “each town and city shall be required to raise by tax, annually, for the support of common schools therein……” “each town and city shall be required to raise by tax, annually, for the support of common schools therein……” How does the Legislature achieve this?

5
5 ($1,000,000/1,000) x $10 = $10,000
 x $10 = $10,000")
6
6 6 The State provides financial assistance in the form of Equalization/General Aid to school districts in order to: Reduce the reliance upon the local property tax as the sole source of revenue for educational programs. Guarantee that a basic educational opportunity is available to all pupils regardless of the local fiscal capacity of the district in which they reside. A student should not be unfairly disadvantaged as a consequence of where he or she lives.

7
7 7 The fundamental purpose of the Equalization Aid formula is to “level the playing field” by providing assistance (distributing aid) to poorer districts (those with lower property value) to make up for what they can’t get from their property tax base.
 to poorer districts (those with lower property value) to make up for what they can’t get from their property tax base.")
8
8 Equalization Aid Property Tax Base

9
$1,000,000$2,000,000$3,000,000$4,000,000$5,000,000 Number of Children to Educate to Educate 2010 $100,000$400,000 $250,000 $300,000$200,000 Notice how the tax base, as a measure of wealth, changes after incorporating the number of children to educate.

10
10

11
11 # of Districts Receiving Aid 14-15 July 1 Aid Estimate (Prior to Choice/Charter deductions) % of General Aid Appropriation Equalization405$4,391,233,37998.1% Inter-District22$20,778,7460.5% Intra-District4$44,800,8951.0% Special Adjustment72$19,145,7750.4% Total General Aid *422$4,475,958,795100.0% No General Aid2$0 * Some districts receive more than one type of aid.
 % of General Aid Appropriation Equalization405$4,391,233, % Inter-District22$20,778,7460.5% Intra-District4$44,800,8951.0% Special Adjustment72$19,145,7750.4% Total General Aid *422$4,475,958, % No General Aid2$0 * Some districts receive more than one type of aid.")
12
12 All 4 aid types are considered “General Aid” & are included in Line 12A of the Revenue Limit Worksheet. Equalization Aid: based on Membership, Shared Costs, Equalized Values – “ability to pay” determines position in formula Inter-District Aid: based on eligible costs / pupils (only 22 districts) Intra-District Aid: based on eligible pupils / Equalization Aid (only 4 districts) Special Adjustment Aid: ensures districts receive at least 85% of the prior year’s General Aid eligibility (Equalization/Inter-/Intra- Aids)
 Intra-District Aid: based on eligible pupils / Equalization Aid (only 4 districts) Special Adjustment Aid: ensures districts receive at least 85% of the prior year’s General Aid eligibility (Equalization/Inter-/Intra- Aids).")
13
Why do you need to know how to calculate aid when DPI calculates it for you? Because you will be asked by your board members, constituents, and the media. So you can figure out why your aid has changed AND explain why. Because you may want to do estimates and “what ifs”…

14
3 District Factors Spending (Shared Cost) Wealth (Property Tax Base) Number of Students to Educate (Membership)
 Wealth (Property Tax Base) Number of Students to Educate (Membership)")
15
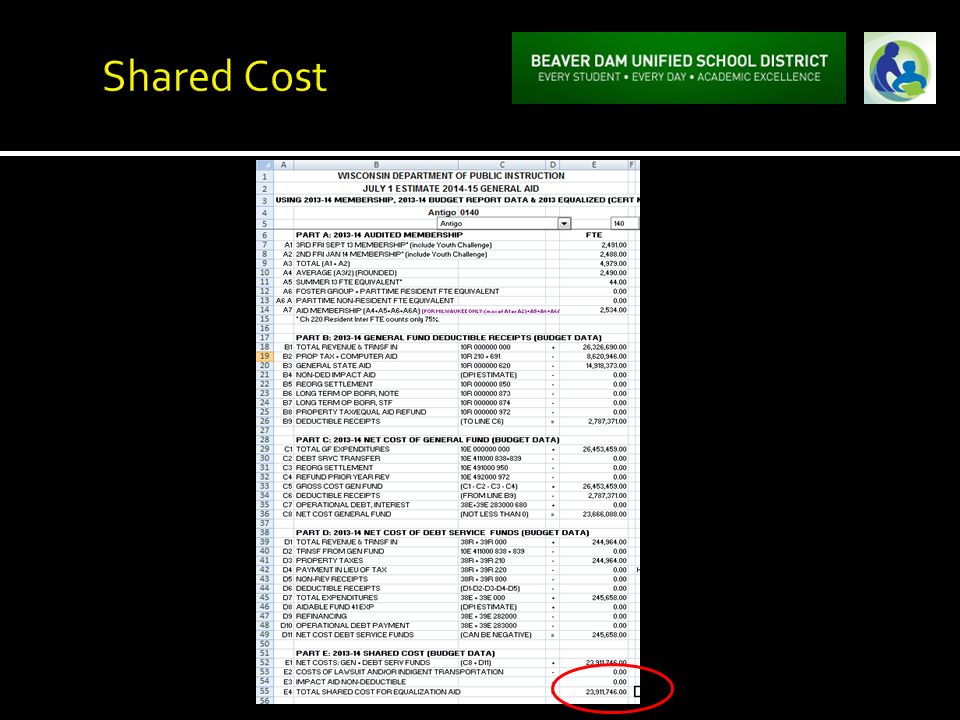
Total General Fund (Fund 10) Expenditures + (plus) Total Debt Service Funds (Funds 38 & 39) Expenditures - (minus) all local misc. revenue, grant revenue, and categorical aid. Result is “Shared Cost”

19
Property tax base is used to determine district wealth and ability to support district expenditures. Uses Equalized Valuation or Fair Market Value. (NOT Assessed Value) Values certified in May are used in the following year’s aid calculations.
 Values certified in May are used in the following year’s aid calculations..")
20
Average of 3rd Friday F.T.E. - September 2nd Friday F.T.E. - January (each count includes parttime attendance, residents and non-residents) + Summer School F.T.E F.T.E. = full-time equivalent 2 halftime (.50) kindergarten students = 1 F.T.E. Summer School = 48,600 minutes of instruction = 1 F.T.E.
 + Summer School F.T.E F.T.E. = full-time equivalent 2 halftime (.50) kindergarten students = 1 F.T.E. Summer School = 48,600 minutes of instruction = 1 F.T.E..")
21
The computation is actually 3 individual computations…….. The results of all 3 are summed to get the district’s total aid.

22
3 State Factors Cost Ceilings Guaranteed Property Valuations Per Member Amount of Money to Distribute

23
Positive Primary Aid Positive Secondary Aid District Value per Member 10%90% 75%25% 50%50% Equalization Aid Positive Tertiary Aid

24
DISTRICT 10% x $1,000=$100 25% x $8,000=$2,000 50% x $3,000=$1,500 $3,600 STATE 90% x $1,000=$900 75% x $8,000=$6,000 50% x $3,000=$1,500 $8,400 $3,600 + $8,400 = $12,000

25
Positive Primary Aid Positive Secondary Aid PositiveTertiary Aid Aid Negative Tertiary Aid Equalization Aid

26
DISTRICT 30% x $1,000=$300 75% x $8,000=$6,000 150% x $3,000=$4,500 $10,800 STATE 70% x $1,000=$700 25% x $8,000=$2,000 -50% x $3,000=$-1,500 $1,200 $10,800 + $1,200 = $12,000

27
“October 15, 2013 ACT 46 Equalization Aid Computation – Percentage Method – Algebraic Format” http://sfs.dpi.wi.gov/sfs_buddev_eq Location: SFS Homepage > Longitudinal Data > Equalization Aid (handout)
")
28
Positive Primary Aid Positive Secondary Aid Positive Tertiary Aid District Value per Member Negative Tertiary Aid Negative Secondary Aid No Equalization Aid Equalization Aid

29
http://sfs.dpi.wi.gov/sfs_buddev_eq Location: SFS Homepage > Longitudinal Data > Equalization Aid “2013-14 Equalization Aid Formula Position”

30
Positive Primary Aid Positive Secondary Aid Positive Tertiary Aid District Value per Member Negative Tertiary Aid Negative Secondary Aid No Equalization Aid Equalization Aid

31
Watch Value Per Member Over Time

32
http://sfs.dpi.wi.gov/sfs_buddev_valuation Location: SFS Homepage > Longitudinal Data > Property Valuation (handout) “Longitudinal Equalization Aid Value-Per-Member History”
 Longitudinal Equalization Aid Value-Per-Member History")
33
Knowing where your district is in the formula will help you better explain how changes in local finances might affect your state aid. Simplified percentage method scenarios: http://sfs.dpi.wi.gov/sfs_workexe What if we underspend our budget? How does that affect our aid? If we go to referendum, how will our aid change?

34
1. One (1) pot of money is split over 424 school districts based on district values, membership, and expenditures. Changes in individual district’s data affect each other’s aid. 2. Equalization Aid membership is an average of the September & January FTE counts, plus 100% of the Summer FTE. (includes parttime attendance) 3. Depending on district value-per member, some districts increase their aid by increasing expenses, while others decrease their aid by increasing expenses. It’s important to know where your district is in the formula. 4. Be aware of what is happening to your district over time.
 pot of money is split over 424 school districts based on district values, membership, and expenditures. Changes in individual district’s data affect each other’s aid. 2. Equalization Aid membership is an average of the September & January FTE counts, plus 100% of the Summer FTE. (includes parttime attendance) 3. Depending on district value-per member, some districts increase their aid by increasing expenses, while others decrease their aid by increasing expenses. It’s important to know where your district is in the formula. 4. Be aware of what is happening to your district over time..")
35
1.) How would a district’s aid change if the membership was 10% higher? 10% lower? 2.) How would a district’s aid change if there was 10% more cost and same number of kids? 10% less cost? Value per member would change. All things being equal, more membership, less value-per-member, more aid …and vice versa. Which tier changes? Positively-aided would get more aid, negatively-aided would get less aid...and vice versa.
 How would a district’s aid change if there was 10% more cost and same number of kids. 10% less cost. Value per member would change. All things being equal, more membership, less value-per-member, more aid …and vice versa. Which tier changes. Positively-aided would get more aid, negatively-aided would get less aid...and vice versa..")
36
3.) How would a district’s aid change if the value was 10% higher? 10% lower? Value per member would change. All things being equal, more value would mean less aid …and vice versa.

37
4.) I’ve heard about 2/3rds funding. Does this mean I will get reimbursed for 66% of my Shared Cost? No. The percentage aid a district will get in the aid formula depends on the district’s spending and value per member. 2/3rds NEVER meant anything that applied specifically to districts. This was a calculation done at the state level that added together several revenue sources (total school levies, total state and categorical aid and total levy credit) to determine the “pot” of aid to be distributed by the formula. 2/3rds is no longer law.
 to determine the pot of aid to be distributed by the formula. 2/3rds is no longer law..")
38
2013-14 Final Aid Eligibility* Equalization Aid (Line H1)$914,004 Inter-District (Line I1)$0 Intra-District (Line I1)$0 Special Adjustment (Line I1)$31,833 Total$945,837 X.85 85% Minimum for 2014-15$803,961 2014-15 Aid Eligibility* Equalization Aid (Line H1)$523,943 Inter-District (Line I1)$0 Intra-District (Line I1)$0 Special Adjustment (Line I1)$280,018 Total$803,961 X.85 85% Minimum for 2015-16$683,367 Special Adjustment Aid ensures the district receives at least 85% of the prior year’s General Aid eligibility. * Prior to Choice/Charter Deductions.

39
Bruce Anderson, Consultant608-267-9707 Carey Bradley, Consultant608-267-3752 Dan Bush, Consultant608-267-9212 Karen Kucharz Robbe, Consultant608-266-3464 Gene Fornecker, Auditor608-267-7882 Michele Gundrum, Auditor608-267-9218 Brian Kahl, Auditor608-266-3862 Vacant, Assistant Director608-267-9209 Bob Soldner, Director608-266-6968 Email: dpifin@dpi.wi.govdpifin@dpi.wi.gov Phone: (608) 267-9114 Fax:(608) 266-2840
 Fax:(608)")
40
Transfer Key Pieces of the Revenue Limit to Your Budget Papers Revenue Limit Calculation

Similar presentations


 to Successfully Navigating the DPI SAFR PI-1505 Annual Report Tuesday, April 28, 2015 Session #9 9:15 - 10:00 AM Carey.>")


 Aid.>")
 PI 80 Permanent Rule and one-time non-levy fund balance transfer option.>")