Download presentation
Presentation is loading. Please wait.

1
The Influence of Specific Gravity Distributions on Fuel Properties Pete Rozelle U.S. Department of Energy ARIPPA, October 31, 2006

2
The Influence of Specific Gravity Distributions on Fuel Properties Ash Content Distributions in Coal Refuse by Specific Gravity Distributions of Mineral and Ash Components Example of Using these Things to get a Cost Advantage for a CFB Power Plant Turning Bad Material into Useful Fuel (an Example)
")
3
Attributes that Vary with Specific Gravity Ash Content Mineral Content Particle Density Ash Chemistry Ash Fusion Characteristics Where the Stuff Ends up in a CFB Boiler (Ash Split)
")
4
The Math of Summing Fuel Properties - an Example Using Ash Content Run of MineRefuse Dump Cogen Fuel 250 Tons750 Tons1000 Tons 15% Ash 1.4% S 50% Ash 3.5% S 41.3% Ash 3.0% S

5
The Math of Summing Fuel Properties - an Example Using Ash Content Fraction Run of Mine (M 1 ) Fraction Refuse Dump (M 1 ) 1 Mass of Cogen Fuel
 Fraction Refuse Dump (M 1 ) 1 Mass of Cogen Fuel")
6
The Math of Summing Fuel Properties - an Example Using Ash Content Fraction Run of Mine X Ash Content of Run of Mine (M 1 A 1 ) Fraction Refuse Dump X Ash Content of Refuse Dump (M 2 A 2 ) Ash Content of Cogen Fuel
 Fraction Refuse Dump X Ash Content of Refuse Dump (M 2 A 2 ) Ash Content of Cogen Fuel")
7
The Specific Gravity Distribution of Ash Content- the Float Sink Table DirectCumulative Float SinkFloatWt%Ash%Sulfur%Wt%Ash%Sulfur% 1.3025.12%4.03%1.19%25.12%4.03%1.19% 1.301.4036.29%8.25%1.46%61.41%6.52%1.35% 1.401.507.66%18.76%2.26%69.07%7.88%1.45% 1.501.602.70%28.13%3.24%71.77%8.64%1.52% 1.6028.23%47.37%5.33%100.00%19.57%2.59% B Seam Run of Mine, Cambria County, Pa

8
The Specific Gravity Distribution of Ash Content- One Way to Look at it B Seam Run of Mine, Cambria County, Pa

9
The Specific Gravity Distribution of Ash Content B Seam Refuse Dump, From the ROM in the Last Slide DirectCumulative SinkFloatWt%Ash%S%Wt%Ash%S% 1.4015.9%6.9%1.4%15.9%6.9%1.4% 1.401.502.5%19.7%3.3%18.4%8.6%1.6% 1.501.602.4%29.3%2.9%20.8%11.0%1.8% 1.601.703.6%38.9%2.2%24.4%15.1%1.9% 1.701.806.9%49.0%1.5%31.3%22.6%1.8% 1.802.0017.7%58.1%1.6%49.0%35.4%1.7% 2.0051.0%78.9%5.0%100.0%57.6%3.4%

10
The Specific Gravity Distribution of Ash Content- One Way to Look at it B Seam Refuse Dump, Cambria County, Pa

11
Float Sink Tables for Refuse Dumps The Good: –Deep Mined, Flat Coal –Not Dense Medium Cleaned –Old The Bad: –Newer –Refuse Quality wasn’t under the Microscope The Ugly: –Surface Mining of Old Workings –Pitched Coal –Dense Medium Cleaning

12
The Specific Gravity Distribution of Ash Content- The Good B Seam Refuse Dump, Cambria County, Pa DirectCumulative SinkFloatWt%Ash%S%Wt%Ash%S% 1.408.5%6.5%1.1%8.5%6.5%1.1% 1.401.505.7%21.8%1.5%14.2%12.6%1.2% 1.501.6015.6%31.2%1.4%29.7%22.4%1.3% 1.601.7021.7%39.6%1.5%51.5%29.7%1.4% 1.701.8013.6%47.9%1.6%65.0%33.5%1.4% 1.802.0011.8%55.3%2.7%76.8%36.8%1.6% 2.0023.5%67.2%11.6%100.3%43.9%4.0%

13
The Specific Gravity Distribution of Ash Content- The Good B Seam Refuse Dump, Cambria County, Pa

14
The Specific Gravity Distribution of Ash Content- The Bad Pittsburgh Seam Refuse Dump (Old) DirectCumulative SinkFloatWt%Ash%S%Wt%Ash%S% 1.4018.6%9.2%1.5%18.6%9.2%1.5% 1.401.504.1%21.3%3.8%22.7%11.3%1.9% 1.501.603.2%27.7%3.9%25.9%13.4%2.2% 1.601.702.9%37.5%4.3%28.7%15.8%2.4% 1.701.802.1%43.1%4.2%30.9%17.7%2.5% 1.802.003.7%52.8%4.9%34.6%21.5%2.8% 2.0065.4%86.2%3.7%100.0%63.8%3.4%
 DirectCumulative SinkFloatWt%Ash%S%Wt%Ash%S% %9.2%1.5%18.6%9.2%1.5% %21.3%3.8%22.7%11.3%1.9% %27.7%3.9%25.9%13.4%2.2% %37.5%4.3%28.7%15.8%2.4% %43.1%4.2%30.9%17.7%2.5% %52.8%4.9%34.6%21.5%2.8% %86.2%3.7%100.0%63.8%3.4%")
15
The Specific Gravity Distribution of Ash Content- The Bad Pittsburgh Seam Refuse Dump (Old)
")
16
The Specific Gravity Distribution of Ash Content- The Ugly Anthracite Refuse (Active Mine in 1960’s) DirectCumulative SinkFloatWt%Ash%S%Wt%Ash%S% 1.601.4%9.4%0.8%1.4%9.4%0.8% 1.601.701.0%26.4%1.1%2.4%16.4%0.9% 1.701.805.5%37.3%1.0%7.9%30.9%1.0% 1.802.0019.2%49.7%1.2%27.1%44.2%1.1% 2.0072.9%81.3%1.4%100.0%71.2%1.3%
 DirectCumulative SinkFloatWt%Ash%S%Wt%Ash%S% %9.4%0.8%1.4%9.4%0.8% %26.4%1.1%2.4%16.4%0.9% %37.3%1.0%7.9%30.9%1.0% %49.7%1.2%27.1%44.2%1.1% %81.3%1.4%100.0%71.2%1.3%")
17
The Specific Gravity Distribution of Ash Content- The Ugly Anthracite Refuse (Active Mine in 1960’s)
")
18
Minerals in Coal Waste Illite: –K 3 (Al 6 FeMg)(Si 14 Al 2 )O 40 (OH) 8 Kaolinite –Al 2 O 3 ·2SiO 2 ·2H 2 O Pyrophyllite –Al 2 O3· 2 SiO 2 ·H 2 O Pyrite –FeS 2 Rutile –TiO 2
(Si 14 Al 2 )O 40 (OH) 8 Kaolinite –Al 2 O 3 ·2SiO 2 ·2H 2 O Pyrophyllite –Al 2 O3· 2 SiO 2 ·H 2 O Pyrite –FeS 2 Rutile –TiO 2")
19
Minerals in Coal Waste Example of Mineral Content Variations by Specific Gravity- An Anthracite Bank Wt% of Mineral Matter SinkFloatWt%IlliteKaolinite Pyrophyllite KaoliniteQuartzPyriteRutile 1.601.4%26.8%66.2%-2.4%1.3%3.3% 1.602.0012.7%37.4%49.4%-9.2%1.5%2.5% 2.002.4042.9%39.9%41.8%-14.8%1.9%1.6% 2.402.6032.8%28.7%-30.8%36.7%2.9%0.9% 2.6010.2%45.1%-38.4%7.2%8.3%1.0%

20
Minerals in Coal Waste Pittsburgh Seam Refuse- Specific Gravity Variations in Ash Analysis Wt% of Ash SinkFloatWt%Wt% AshSiO 2 Al 2 O 3 Fe 2 O 3 CaOMgO 1.417.0%7.8%58%26%12%1.6%0.1% 1.41.64.9%17.7%50%18%20%2.7%0.1% 1.61.85.9%40.0%42%17%16%11.0%1.5% 1.822.8%50.7%44%17% 11.0%1.4% 22.22.7%59.3%51%16%21%4.0%0.1% 2.22.44.6%69.6%54%19%20%4.0%0.1% 2.42.610.7%82.4%61%23%12%1.8%0.1% 2.62.845.2%88.7%57%22%6%1.7%0.1% 2.82.961.6%66.1%24%9%60%1.7%0.0% 2.964.6%61.3%11%2%83%1.2%1.6%

21
Minerals in Coal Waste Anthracite Refuse

22
Minerals in Coal Waste Anthracite Refuse- Specific Gravity Variations in Ash Analysis Wt% of Ash SinkFloatWt%Wt% AshSiO 2 Al 2 O 3 Fe 2 O 3 CaOMgO 1.64.9%17.7%54%25%11%0.7%0.1% 1.61.85.9%40.0%55%24%6%0.3%0.6% 1.822.8%50.7%55%27%6%0.3%0.1% 22.22.7%59.3%55%24%5%0.3%0.1% 2.22.44.6%69.6%55%29%4%0.5%0.1% 2.42.610.7%82.4%55%28%4%0.7%0.1% 2.62.845.2%88.7%55%27%6%0.8%0.1% 2.82.961.6%66.1%31%13%54%2.8%2.1% 2.964.6%61.3%12%3%75%1.5%1.7%

23
Minerals in Coal Waste West Virginia Refuse

24
Minerals in Coal Waste Pittsburgh Seam Refuse- Specific Gravity Variations in Ash Analysis Wt% of Ash SinkFloatWt%Wt% AshSiO 2 Al 2 O 3 Fe 2 O 3 CaOMgO 1.417.0%7.8%50%28%17%2.0%0.1% 1.41.64.9%17.7%54%26%13%1.4%0.1% 1.61.85.9%40.0%55%26%11%1.9%0.1% 1.822.8%50.7%56%25%10%1.2%0.1% 22.22.7%59.3%57%23%7%1.1%0.1% 2.22.44.6%69.6%58%25%7%0.6%1.1% 2.42.610.7%82.4%56%23%6%0.3%1.5% 2.62.845.2%88.7%57%24%6%0.2%1.5% 2.82.961.6%66.1%26%9%52%1.1%0.5% 2.964.6%61.3%7%2%90%0.4%0.0%

25
Mineral and Ash Analyses Vary with Specific Gravity- What about Fusion Temperatures? Degrees F SinkFloat Wt% Ash Initial Deformation Temperature Softening TemperatureFluid Temperature 1.451.7%2,720 2,820 1.451.502.8%2,8902,910+ - 1.501.557.8%2,910+ - - 1.551.6015.7%2,3602,4102,460 1.601.6516.2%2,3402,3902,490 1.651.7024.3%2,2502,3002,350 1.701.7526.7%2,1902,2502,300 1.751.8031.6%2,2102,2602,310 1.801.8534.5%2,3402,3902,490 1.851.9042.9%2,5202,5702,700 1.9069.7%2,1202,1602,200 Anthracite

26
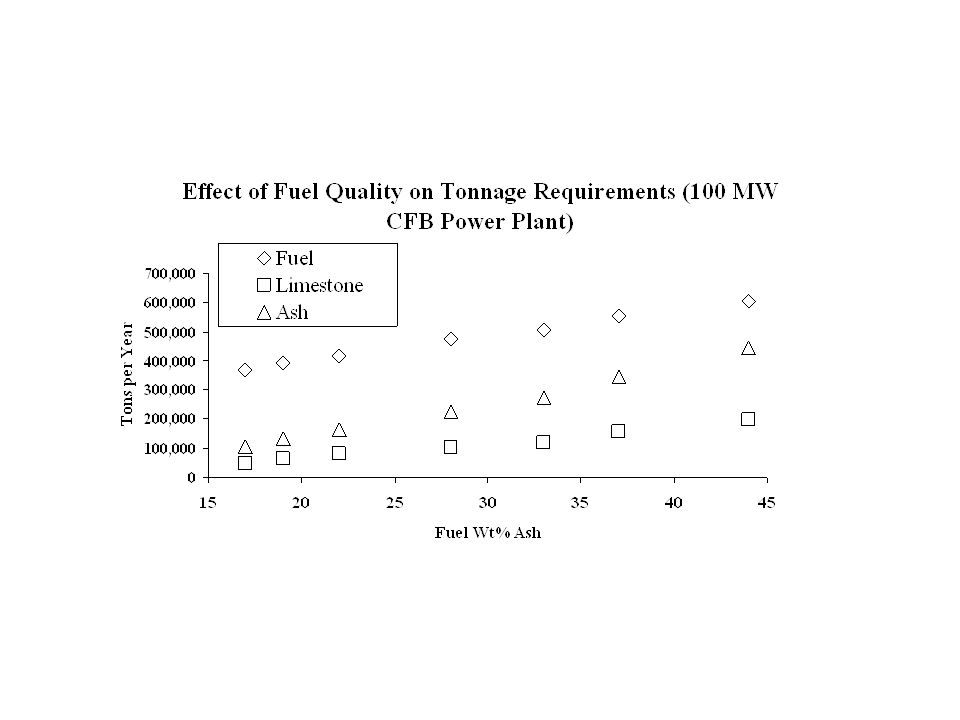
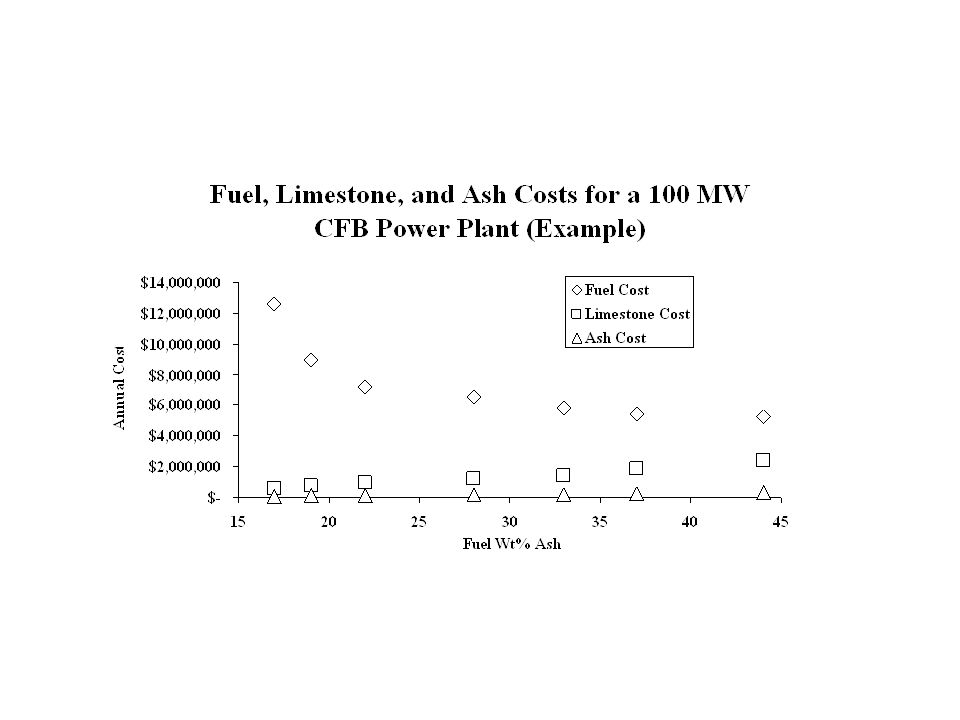
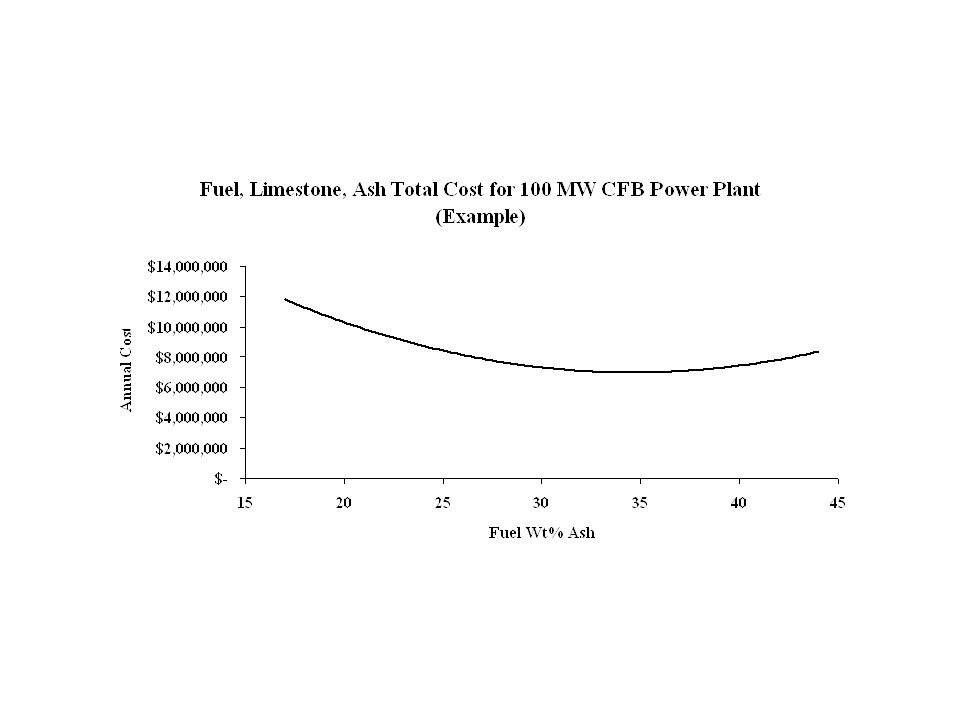
An Example of Getting a Cost Advantage for a CFB Power Plant Not all Potential Fuel is Located Close to the Power Plant Low Quality Materials May not Make Sense to Truck Long Distances Improved Fuel Quality can: –Reduce Transportation Costs –Reduce Limestone requirements –Reduce Ash Disposal Costs –Increase Mean Bed Residence Time

27
Economics of Waste Coal Reprocessing CpCp Product Cost/ton CfCf Feedstock Cost/ton CoCo Plant Operating Cost/ton Feed CrCr Refuse Disposal Cost/ton YPlant Yield

33
Examples of the Application of Coal Preparation Vessels to Coal Refuse Dense Medium Cyclone- Commonwealth of Pennsylvania, 1960’s: –Feed Ash Content: 56 wt% –Cyclone Feed Gravity =1.80, Product = 20% Yield, 38% Ash –Cyclone Feed Gravity = 1.90, Product = 28% Yield, 42% Ash

34
Examples of the Application of Coal Preparation Vessels to Coal Refuse Horsfall, Grobelaar, and Van Eck and Lurie (South Africa) –High Gravity Separations for Rerunning Coal Refuse Dense Medium Vessels Dense Medium Cyclones Other Systems
 –High Gravity Separations for Rerunning Coal Refuse Dense Medium Vessels Dense Medium Cyclones Other Systems")
35
Examples of the Application of Coal Preparation Vessels to Coal Refuse Water Only Cyclone- Penn State University –Feed: up to 30% Ash –Product at 30% Ash Feed = 20% Ash

36
Potential Economics of Prepared Fuel from Low Quality Coal Refuse Simulation for the Following: –Coarse Coal Dense Medium Vessel (1.60 to 1.80 Gravity) –Dense Medium Cyclones (1.60-1.90 Feed Gravity) –Generic Process for Recovery of -28 Mesh Material
 –Dense Medium Cyclones ( Feed Gravity) –Generic Process for Recovery of -28 Mesh Material")
37
Potential Economics of Prepared Fuel from Low Quality Coal Refuse Dump Assumptions: –Royalty = $1.00/Raw Ton –Load and Carry Cost = $1.00/Raw Ton –Prep Plant Cost= $2.50/Raw Ton –Prep Plant refuse Cost = $0.50/Ton

38
The Specific Gravity Distribution of Ash Content- The Bad Pittsburgh Seam Refuse Dump (Old) 64 Wt% Ash 3.3 Wt% S
 64 Wt% Ash 3.3 Wt% S")
39
Potential Economics of Prepared Fuel from Low Quality Coal Refuse Dump (Pittsburgh) Results: –24 Wt% Ash –2.5 Wt% S –~$0.72/MM BTU Production Cost Blended with Run of Bank (65/35) Yields: –34 Wt% Ash –2.8 Wt% S –~$0.60/MM BTU Production Cost
 Results: –24 Wt% Ash –2.5 Wt% S –~$0.72/MM BTU Production Cost Blended with Run of Bank (65/35) Yields: –34 Wt% Ash –2.8 Wt% S –~$0.60/MM BTU Production Cost")
40
The Specific Gravity Distribution of Ash Content B Seam Refuse Dump, Cambria County, Pa 64 Wt% Ash 3.3 Wt% S

41
Potential Economics of Prepared Fuel from Low Quality Coal Refuse Dump (B Seam) Results: –30 Wt% Ash –2.1 Wt% S –~$0.62/MM BTU Production Cost
 Results: –30 Wt% Ash –2.1 Wt% S –~$0.62/MM BTU Production Cost")
42
What about Currently Produced Prep Plant Refuse? Pittsburgh Bed Refuse from Active Operation in 1988- As Sampled: –49 Wt% Ash –5.5 Wt% Sulfur

43
What about Currently Produced Prep Plant Refuse? Pittsburgh Bed Refuse from Active Operation in 1988- As Sampled: –49 Wt% Ash –5.5 Wt% Sulfur After a Laboratory Process: –65% Yield –41 Wt% Ash –3.9 Wt% Sulfur

44
Up Next: Makes Bottom Ash Makes Flyash

Similar presentations


 are waste products generated by the mining industry. When these.>")


 with a small amount of other.>")
