Download presentation
Presentation is loading. Please wait.

1
Rapid Ecoregional Assessment

2
Climate was primarily modeled using models and data from the Scenarios Network for Alaska and Arctic Planning. See www.snap.uaf.edu for details. www.snap.uaf.edu

3
Rapid Ecoregional Assessment Change Agent: Climate Global Circulation Models (AR4) 5 highest-performing models Inputs to ALFRESCO, Cliomes model, and GIPL permafrost model; creation of freeze, thaw, and season length interpolations Biome shift model PRISM data Monthly projected data, temp and precip, to 2100, for 3 emission scenarios Permafrost model 5-model composite, A2 scenario, baseline plus 2020s, 2050s, 2060s (decadal averages) Fire model GCM testing and selection Downscaling Data processing Data selection Climate model Selection of key variables pertinent to CEs See separate model schematics for full inputs
 5 highest-performing models Inputs to ALFRESCO, Cliomes model, and GIPL permafrost model; creation of freeze, thaw, and season length interpolations Biome shift model PRISM data Monthly projected data, temp and precip, to 2100, for 3 emission scenarios Permafrost model 5-model composite, A2 scenario, baseline plus 2020s, 2050s, 2060s (decadal averages) Fire model GCM testing and selection Downscaling Data processing Data selection Climate model Selection of key variables pertinent to CEs See separate model schematics for full inputs")
4
Rapid Ecoregional Assessment Change Agents: Climate Raw data sources: Weather station data Climate grids mathematically scaled down to the local level Global Circulation Models (based on the balance of the sun’s energy and conditions in the atmosphere and oceans) Downscaling: Based on CRU and PRISM algorithms GCM output (ECHAM5) 2.5 x 2.5 degrees; 2 km SNAP data
 Downscaling: Based on CRU and PRISM algorithms GCM output (ECHAM5) 2.5 x 2.5 degrees; 2 km SNAP data")
5
Rapid Ecoregional Assessment Inter-model standard deviations in projected monthly temperature (°C) and precipitation (mm), A2 emission scenario. Assessing standard deviations between the five models used to create climate projections offers one methods of assessing uncertainty, although not all sources of uncertainty are captured here.

6
Rapid Ecoregional Assessment

7
Temperatures (°C) are averaged across watersheds (5 th level HUCs) surrounding communities. Error bars represent maximum and minimum values for 771m pixels within those HUCs.

8
Rapid Ecoregional Assessment

9
Temperatures (°C) are averaged across watersheds (5 th level HUCs) surrounding communities. Error bars represent maximum and minimum values for 771m pixels within those HUCs.

10
Rapid Ecoregional Assessment

11
Precipitation (mm) is averaged across ecological sub-regions.
 is averaged across ecological sub-regions.")
12
Rapid Ecoregional Assessment

13
Precipitation (mm rainwater equivalent) is averaged across ecological sub-regions.
 is averaged across ecological sub-regions.")
14
Rapid Ecoregional Assessment Data at which the running mean temperature crosses the freezing point in the autumn.

15
Rapid Ecoregional Assessment

16
Data at which the running mean temperature crosses the freezing point in the spring.

17
Rapid Ecoregional Assessment

19
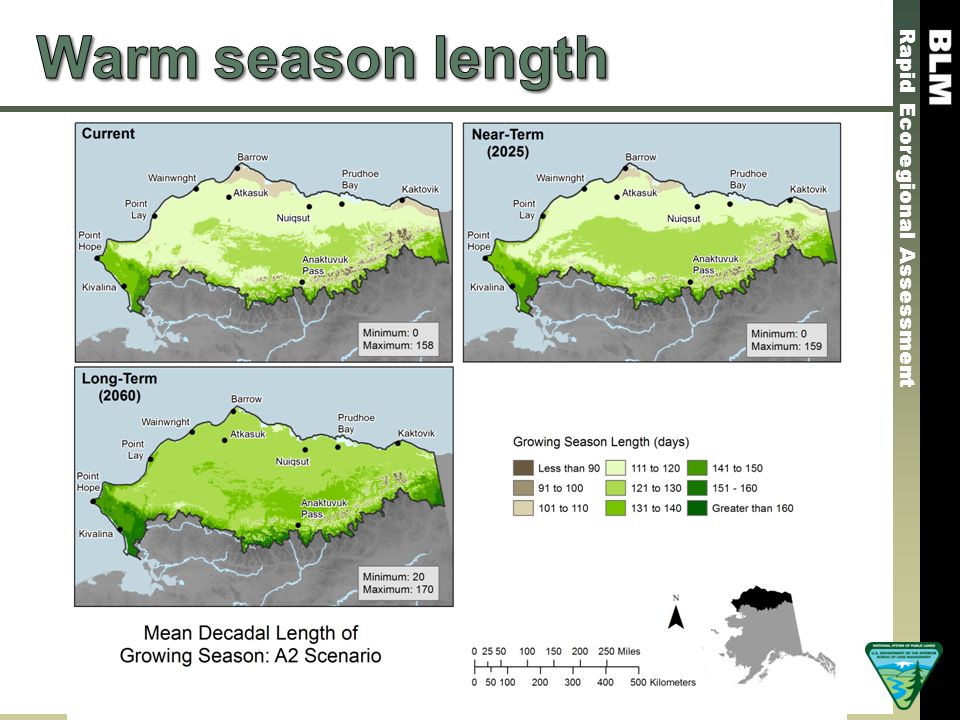
Warm season length is the number of days between DOT and DOF. Values are averaged across watersheds (5 th level HUCs) surrounding communities. Error bars represent maximum and minimum values for 771m pixels within those HUCs.
 surrounding communities. Error bars represent maximum and minimum values for 771m pixels within those HUCs..")
20
Rapid Ecoregional Assessment Change in snow day fraction: percentage of days in which precipitation, were it to fall, would be expected to be snow rather than rain. May (top) and September (bottom).
 and September (bottom)..")
21
Rapid Ecoregional Assessment

22
Length of above-freezing season and GDD by cluster. Days above freezing were estimated via linear interpolation between monthly mean temperatures. Growing degree days (GDD) were calculated using 0°C as a baseline. Warm-season and cold-season precipitation by cluster. The majority of precipitation in months with mean temperatures below freezing is assumed to be snow (measured as rainwater equivalent).
 were calculated using 0°C as a baseline. Warm-season and cold-season precipitation by cluster. The majority of precipitation in months with mean temperatures below freezing is assumed to be snow (measured as rainwater equivalent)..")
23
Rapid Ecoregional Assessment Projected cliomes for the five-model composite, A1B (mid-range ) climate scenario. Alaska and the Yukon are shown at 2km resolution and NWT at 10 minute lat/long resolution. Climate- biome Projections Original 18 clusters

24
Rapid Ecoregional Assessment 2010s2020s2060s Anaktuvuk Pass121112 Kaktovik333 Kivalina8810 Point Hope910 Point Lay336 Barrow333 Nuiqsut335 Atkasuk666 Prudhoe Bay336 Wainwright333

25
Rapid Ecoregional Assessment Projected CE change based on climate change? Some climate variables not presented in this overview may be pertinent to a particular species. Changing climate is likely to affect human uses of the landscape, either indirectly (e.g., as ecosystem changes alter subsistence harvest patterns) or directly (e.g., as longer summer seasons make travel across snow or ice impossible during shoulder seasons).
 or directly (e.g., as longer summer seasons make travel across snow or ice impossible during shoulder seasons)..")
26
Rapid Ecoregional Assessment Torre Jorgenson

27
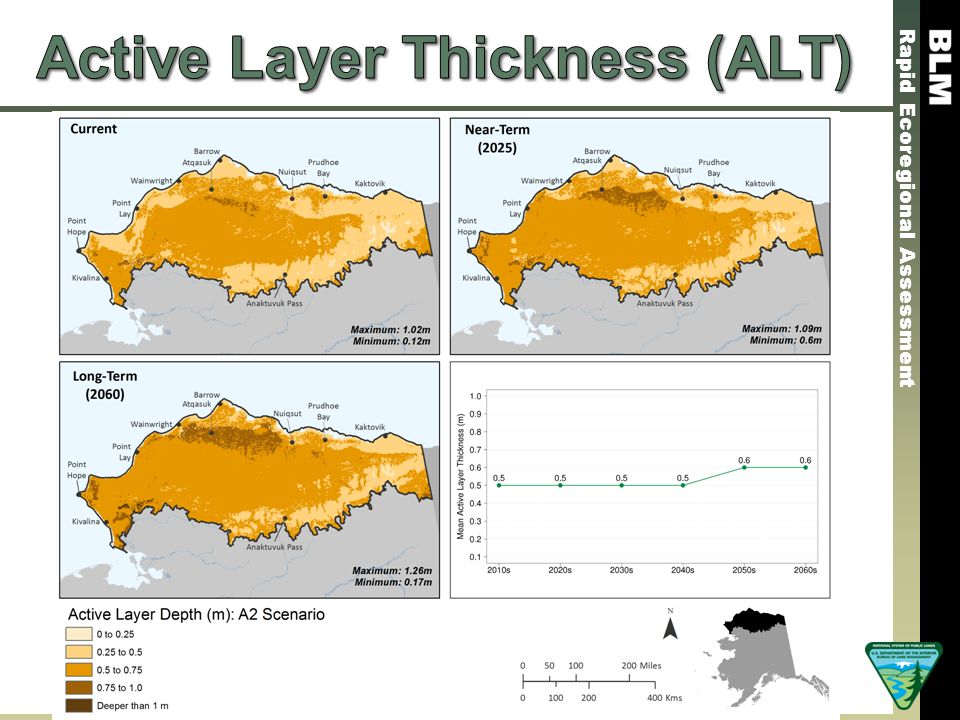
Rapid Ecoregional Assessment Permafrost thaw leads to multiple effects, including frost heaves, pits, gullies, differential tussock growth, localized drying, and changes in shrub and moss species abundance, productivity, and mortality

28
Rapid Ecoregional Assessment

30
Values are averaged across watersheds (5 th level HUCs) surrounding communities. Error bars represent maximum and minimum values for 771m pixels within those HUCs.

31
Rapid Ecoregional Assessment

32
Change Agent: Fire Simulated fire Historical fire perimeters, 1950-2007 Historical climate data (CRU and PICIR climate data, 1862-2002) Vegetation distribution and age structure (3 classes of tundra, black spruce, white spruce, hardwoods, and unvegetated) Simulated landscape 1860 Generate simulated landscapes Simulated landscape, current SNAP climate projections (single model, monthly mean temperature and precipitation) Generate simulated linkages between climate and fire Model outputs: simulated fire and time since fire in the NOS REA for designated time periods Apply future climate to simulated landscape to generate simulated fires Regional analysis of projected fire dynamics and effects on vegetation Average results across all five SNAP climate models and hundreds of stochastic model runs
 Vegetation distribution and age structure (3 classes of tundra, black spruce, white spruce, hardwoods, and unvegetated) Simulated landscape 1860 Generate simulated landscapes Simulated landscape, current SNAP climate projections (single model, monthly mean temperature and precipitation) Generate simulated linkages between climate and fire Model outputs: simulated fire and time since fire in the NOS REA for designated time periods Apply future climate to simulated landscape to generate simulated fires Regional analysis of projected fire dynamics and effects on vegetation Average results across all five SNAP climate models and hundreds of stochastic model runs")
33
Rapid Ecoregional Assessment Change Agent: Fire SNAP climate data and the ALFRESCO model allow for simulation of fire on a spatial landscape using multiple cover types and age classes, with model runs specifically calibrated for the REA area.

34
Rapid Ecoregional Assessment seagrant.uaf.edu

35
Rapid Ecoregional Assessment

36
Historical (1950-2011) ALFRESCO replicates
 ALFRESCO replicates")
37
Rapid Ecoregional Assessment

Similar presentations


Develop climate-based land-cover categories (cliomes) for Alaska and western Canada using down-scaled gridded historic climate data from the Scenarios.>")


 Clare Goodess Climatic Research Unit>")


 tell us – What are trends in the current observational.>")


 Project is funded by the Climate Change Action Fund and provides climate change scenarios and related information.>")
