Download presentation
Presentation is loading. Please wait.

1
I. EARTH SYSTEMS & RESOURCES

2
A. Earth Science Concepts Geologic time scale; plate tectonics, earthquakes, volcanism; seasons; solar intensity and latitude B. The Atmosphere Composition; structure; weather and climate; atmospheric circulation and the Coriolis Effect; atmosphere–ocean interactions; ENSO C. Global Water Resources and Use Freshwater/saltwater; ocean circulation; agricultural, industrial, and domestic use; surface and groundwater issues; global problems; conservation D. Soil and Soil Dynamics Rock cycle; formation; composition; physical and chemical properties; main soil types; erosion and other soil problems; soil conservation

3
GEOLOGIC PROCESSES Earth’s interior consists of:
Core: innermost zone with solid inner core & molten outer core; extremely hot, IRON most abundant element found in core Mantle: solid rock; rigid outer part asthenosphere; melted pliable rock Crust: Outermost zone underlies continents; OXYGEN most abundant

4
Oceanic crust (lithosphere) Abyssal plain Continental slope
Folded mountain belt Volcanoes Abyssal plain Abyssal floor Oceanic ridge Abyssal floor Abyssal hills Trench Craton Oceanic crust (lithosphere) Abyssal plain Continental slope Continental shelf Continental rise Mantle (lithosphere) Continental crust (lithosphere) Mantle (lithosphere) Figure 15.2 Natural capital: major features of the earth’s crust and upper mantle. The lithosphere, composed of the crust and outermost mantle, is rigid and brittle. The asthenosphere, a zone in the mantle, can be deformed by heat and pressure. Mantle (asthenosphere) Fig. 15-2, p. 336
 Abyssal plain. Continental slope. Continental shelf. Continental rise. Mantle (lithosphere) Continental crust (lithosphere) Mantle (lithosphere) Figure Natural capital: major features of the earth’s crust and upper mantle. The lithosphere, composed of the crust and outermost mantle, is rigid and brittle. The asthenosphere, a zone in the mantle, can be deformed by heat and pressure. Mantle (asthenosphere) Fig. 15-2, p")
5
Tectonic plate Inner core
Spreading center Collision between two continents Oceanic tectonic plate Ocean trench Oceanic tectonic plate Plate movement Plate movement Tectonic plate Oceanic crust Oceanic crust Subduction zone Continental crust Continental crust Material cools as it reaches the outer mantle Cold dense material falls back through mantle Hot material rising through the mantle Mantle convection cell Figure 15.3 Natural capital: the earth’s crust is made up of a mosaic of huge rigid plates, called tectonic plates, which move around in response to forces in the mantle. Mantle Two plates move towards each other. One is subducted back into the mantle on a falling convection current. Hot outer core Inner core Fig. 15-3, p. 337

6
The Earth’s Major Tectonic Plates
Figure 15-4

7
Tectonic plates Huge rigid plates that are moved with convection cells or currents by floating on magma or molten rock.

8
Earth’s Major Tectonic Plates
The extremely slow movements of these plates cause them to grind into one another at convergent plate boundaries, move apart at divergent plate boundaries and slide past at transform plate boundaries. Figure 15-4

9
Divergent – the plates move apart in opposite directions.

10
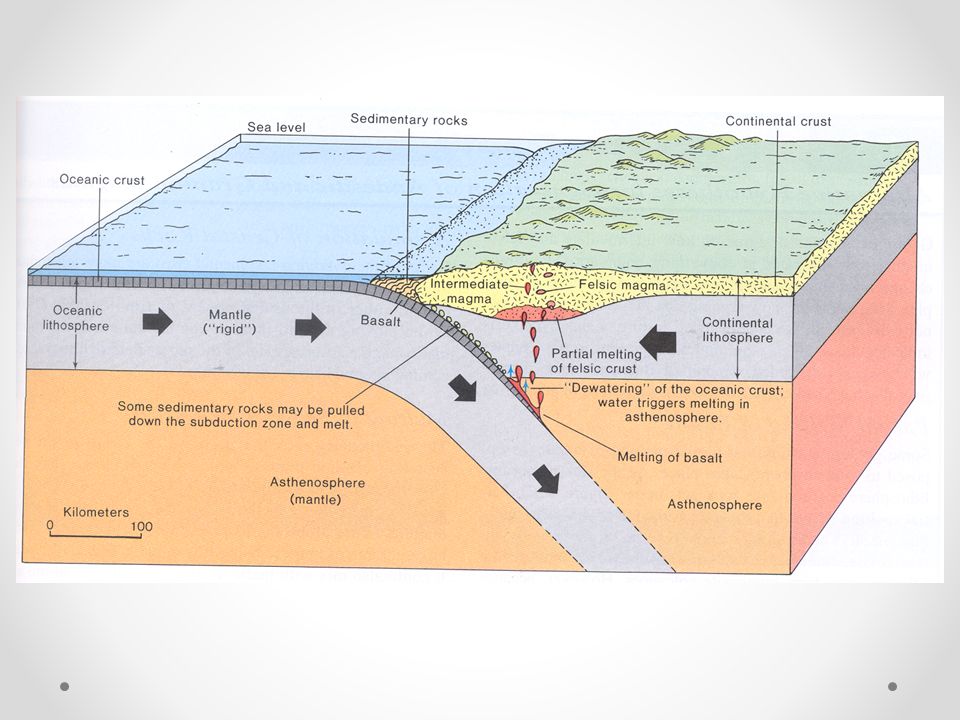
Convergent – the plates push together by internal forces.
The oceanic lithosphere is carried downward under the island or continent. Earthquakes are common here forms an ocean ridge or a mountain range.

12
Transform – plates slide next or past each other in opposite directions along a fracture.
California will not fall into the ocean!

13
GEOLOGIC PROCESSES The San Andreas Fault is an example of a transform fault. Figure 15-5

14
Importance Plate movement adds new land at boundaries, produces mountains, trenches, earthquakes and volcanoes.

15
ATMOSPHERE COMPOSITION
The atmosphere consists of several layers with different temperatures, pressures, and compositions.

16
Atmospheric pressure (millibars)
Temperature Pressure Thermosphere Mesopause Heating via ozone Mesosphere Altitude (kilometers) Stratopause Altitude (miles) Stratosphere Figure 19.2 Natural capital: the earth’s atmosphere is a dynamic system that consists of four layers. The average temperature of the atmosphere varies with altitude (red line). Most UV radiation from the sun is absorbed by ozone (O3), found primarily in the stratosphere in the ozone layer 17–26 kilometers (10–16 miles) above sea level. QUESTION: How did living organisms lead to the formation of the ozone layer? Tropopause Ozone “layer” Heating from the earth Troposphere Pressure = 1,000 millibars at ground level (Sea level) Temperature (˚C) Fig. 19-2, p. 440
 Stratopause. Altitude (miles) Stratosphere. Figure Natural capital: the earth’s atmosphere is a dynamic system that consists of four layers. The average temperature of the atmosphere varies with altitude (red line). Most UV radiation from the sun is absorbed by ozone (O3), found primarily in the stratosphere in the ozone layer 17–26 kilometers (10–16 miles) above sea level. QUESTION: How did living organisms lead to the formation of the ozone layer Tropopause. Ozone layer Heating from the earth. Troposphere. Pressure = 1,000 millibars at ground level. (Sea level) Temperature (˚C) Fig. 19-2, p")
17
Troposphere 75% of mass of atmosphere- 11 miles in altitude
78% nitrogen, 21% oxygen, trace amounts of water vapor and CO2 Earth’s weather & climate Temperature decreases with altitude until the next layer is reached, where there is a sudden rise in temperature

18
Stratosphere 11 miles to 30 miles Temperature increases with altitude
Contains 1000x the OZONE of the rest of the atmosphere; OZONE forms in an equilibrium reaction when oxygen is converted to O3 by lightning and/or sunlight 99% of ultraviolet radiation (especially UV-B) is absorbed by the stratosphere
 is absorbed by the stratosphere.")
19
Mesosphere Thermosphere 30 to 50 miles in altitude
Temperature decreases with increasing altitude Thermosphere 50 to 75 miles Temperature increases with increasing altitude Very HIGH temps

20
Weather & Climate Weather- Condition in the atmosphere at a given place and time temperature, atmospheric pressure, precipitation, cloudiness, humidity, and wind. Climate average weather conditions that occur in a place over a period of time temperature and precipitation

21
Seasons The Earth’s 23.5 degree incline on its axis remains the same as it travels around the sun. As the earth spins around the sun the seasons change.

22
Solar Energy and Global Air Circulation: Distributing Heat
Global air circulation is affected by the uneven heating of the earth’s surface by solar energy, seasonal changes in temperature and precipitation.

23
Coriolis Effect Global air circulation is affected by the rotation of the earth on its axis.

24
Cold deserts Westerlies Forests Northeast trades Hot deserts Forests
Equator Figure 5.4 Natural capital: because of the Coriolis effect the earth’s rotation deflects the movement of the air over different parts of the earth, creating global patterns of prevailing winds that help distribute heat and moisture in the troposphere. Southeast trades Hot deserts Forests Westerlies Cold deserts Fig. 5-4, p. 102

25
Wind Coriolis Effect Forces in the atmosphere, created by the rotation of the Earth on its axis, that deflect winds to the right in the N. Hemisphere and to the left in the S.Hemisphere.

26
Convection Currents Global air circulation is affected by the properties of air, water, and land.

27
Convection Cells Heat and moisture are distributed over the earth’s surface by vertical currents, which form six giant convection cells at different latitudes.

28
Tropical deciduous forest
Cold, dry air falls Cell 3 North Moist air rises — rain Polar cap Cell 2 North Arctic tundra Evergreen coniferous forest 60° Cool, dry air falls Temperate deciduous forest and grassland 30° Desert Cell 1 North Tropical deciduous forest Moist air rises, cools, and releases Moisture as rain 0° Equator Tropical rain forest Tropical deciduous forest 30° Desert Figure 5.6 Natural capital: global air circulation and biomes. Heat and moisture are distributed over the earth’s surface by vertical currents, which form six giant convection cells at different latitudes. The resulting uneven distribution of heat and moisture over the planet’s surface leads to the forests, grasslands, and deserts that make up the earth’s biomes. Cell 1 South Temperate deciduous forest and grassland Cool, dry air falls 60° Cell 2 South Polar cap Cold, dry air falls Moist air rises — rain Cell 3 South

29
Circulation Patterns Convection Cells
Ocean water transfers heat to the atmosphere, especially near the hot equator. Creates convection cells transport heat and water from one area to another. Resulting convection cells circulate air, heat, and moisture both vertically and from place-to-place in the troposphere, leading to different climates & patterns of vegetation.

30
Ocean Currents: Distributing Heat and Nutrients

31
WATER’S IMPORTANCE, AVAILABILITY, AND RENEWAL
Water keeps us alive, moderates climate, sculpts the land, removes and dilutes wastes and pollutants, and moves continually through the hydrologic cycle. Only about 0.02% of the earth’s water supply is available to us as liquid freshwater.

32
WATER’S AVAILABILITY Comparison of population sizes and shares of the world’s freshwater among the continents.

33
Unconfined Aquifer Recharge Area Evaporation and transpiration
Precipitation Evaporation and transpiration Evaporation Confined Recharge Area Runoff Flowing artesian well Recharge Unconfined Aquifer Stream Well requiring a pump Figure 14.3 Natural capital: groundwater system. An unconfined aquifer is an aquifer with a permeable water table. A confined aquifer is bounded above and below by less permeable beds of rock where the water is confined under pressure. Some aquifers are replenished by precipitation; others are not. Infiltration Water table Lake Infiltration Unconfined aquifer Less permeable material such as clay Confined aquifer Confining impermeable rock layer

34
WATER’S AVAILABILITY AND RENEWAL
Some precipitation infiltrates the ground and is stored in soil and rock (groundwater). Water that does NOT sink into the ground or evaporate into the air runs off (surface runoff) into bodies of water. land from which the surface water drains into a body of water is called its watershed or drainage basin.
. Water that does NOT sink into the ground or evaporate into the air runs off (surface runoff) into bodies of water. land from which the surface water drains into a body of water is called its watershed or drainage basin.")
35
Unconfined Aquifer Recharge Area Evaporation and transpiration
Precipitation Evaporation and transpiration Evaporation Confined Recharge Area Runoff Flowing artesian well Recharge Unconfined Aquifer Stream Well requiring a pump Figure 14.3 Natural capital: groundwater system. An unconfined aquifer is an aquifer with a permeable water table. A confined aquifer is bounded above and below by less permeable beds of rock where the water is confined under pressure. Some aquifers are replenished by precipitation; others are not. Infiltration Water table Lake Infiltration Unconfined aquifer Less permeable material such as clay Confined aquifer Confining impermeable rock layer

36
WATER’S AVAILABILITY AND RENEWAL
We currently use MORE than half of the world’s reliable runoff of surface water could be using 70-90% by 2025. About 70% of the water we withdraw from rivers, lakes, and aquifers is NOT returned. IRRIGATION biggest user of water (70%), followed by industries (20%) and cities and residences (10%).
, followed by industries (20%) and cities and residences (10%).")
37
OCEAN AREA & TEMPERATURE
Saltwater (SALINTY) covers about 71% of the earth’s surface Solar HEAT is distributed by ocean CURRENTS & as ocean water evaporates. Regulates earth’s climate & HUGE CO2 reservoir help regulate temperature of the TROSPHERE.
 covers about 71% of the earth’s surface. Solar HEAT is distributed by ocean CURRENTS & as ocean water evaporates. Regulates earth’s climate & HUGE CO2 reservoir help regulate temperature of the TROSPHERE.")
38
Zones of the Marine Environment
2 major zones that break up into smaller zones: COASTAL & OPEN SEA

39
Intertidal or Beach Zone
Broken up into 5 areas

40
Lower Shoreface The deepest part of the beach; farther into the water, before the breaker bar that forms waves

41
Upper Shoreface Shallow zone where the waves begin to form

42
Forebeach Contains the swash zone – place where the waves crash.

43
Backbeach Only under water during high tide

44
Fore-Island Dunes Sand dunes doesn't flood often, except during hurricanes, etc. Constantly changing due to wind

45
Where fresh water and salt water meet
Estuary Where fresh water and salt water meet An estuary is a coastal body of water, partly surrounded by land, with access to the open ocean and a large supply of fresh water from a river

46
Fertility of Estuaries
Estuaries are the most fertile ecosystems in the world greater productivity than either adjacent ocean or fresh water Nutrients are transported from the land into rivers that flow into the estuary tidal action circulates nutrients and helps remove wastes A high level of light due to shallow water many plants provide extensive photosynthetic carpet

47
The Open Ocean Euphotic Zone
Lots of light. From meters. Photosynthesis takes place here.

48
Bathyal Zone The dimly lit part of ocean. From meters.

49
Benthic Characteristics (ocean floor)
The ocean floor consists of sediments (mostly sand and mud) Many marine animals, like worms and clams, burrow Bacteria are common & can go down 500 meters below ocean floor. The Benthic environment extends from the shore to the deep.
 Many marine animals, like worms and clams, burrow. Bacteria are common & can go down 500 meters below ocean floor. The Benthic environment extends from the shore to the deep.")
50
Sea Grass Beds Flowering plants that have adapted to complete submersion in salty water; found in shallow water to depths of 10 meters to photosynthesize Sea grasses quiet, temperate, tropical, and subtropical waters; not in polar waters.

51
Abyssal Zone Completely dark. Extends to a depth of 4000 to 6000 meters (2.5 to 3.7 miles). Water here is very cold & has little dissolved oxygen.

52
Kelp The largest of the brown algae, many reach lengths of 60 meters (200 feet). Common in cooler water & are found along rocky coasts. Provide habitat for many animals like tubeworms, sponges, clams, fish, & mammals Some animals eat the kelp.

53
Coral Reefs Built from layers of calcium carbonate warm, shallow sea water where light hits, often poor in nutrients Most diverse of all marine ecosystems. Provides a habitat for a wide variety of marine organisms, protects coasts from shoreline erosion & provides humans with seafood, pharmaceuticals, and tourism dollars

54
Coral Reef Risks Silt washing from downstream has smothered the reefs
High salinity from fresh water diversion, over-fishing, boat groundings, fishing with dynamite or cyanide, hurricane damage, disease, coral bleaching, land reclamation, tourism, and the mining of coral for building materials. Oceans dilute, disperse, and degrade large amounts of raw sewage, sewage sludge, oil, and some types of industrial waste, especially in deep-water areas. Marine life has proved to be more resilient than some scientists expected, some suggest it is safer to dump sludge & other hazardous wastes into the deep ocean than to bury them on land or burn them.

55
Differences of Opinion
Oceans dilute, disperse, and degrade large amounts of raw sewage, sewage sludge, oil, and some types of industrial waste, especially in deep-water areas. Marine life has proved to be more resilient than some scientists expected, some suggest it is safer to dump sludge & other hazardous wastes into the deep ocean than to bury them on land or burn them.

56
Differences of Opinion
Other scientists disagree, pointing out that we know less about the deep ocean than we do about space. They say that dumping waste in the ocean would delay urgently needed pollution prevention and promote further degradation of this vital part of the earth’s life-support system.

57
Niches

58
What Kinds of Organisms Live in Aquatic Life Zones?
Aquatic systems contain floating, drifting, swimming, bottom-dwelling, and decomposer organisms. Plankton: important group of weakly swimming, free-floating biota. Phytoplankton (plant), Zooplankton (animal), Ultraplankton (photosynthetic bacteria) Necton: fish, turtles, whales. Benthos: bottom dwellers (barnacles, oysters). Decomposers: breakdown organic compounds (mostly bacteria).
, Zooplankton (animal), Ultraplankton (photosynthetic bacteria) Necton: fish, turtles, whales. Benthos: bottom dwellers (barnacles, oysters). Decomposers: breakdown organic compounds (mostly bacteria).")
59
Phytoplankton Description – small drifting plants
Niche – they are producers that support most aquatic food chains Example – cyanobacteria & many types of algae

60
Zooplankton Description – herbivores that feed on phytoplankton or other zooplankton Niche – food stock for larger consumers Example – krill; small crustaceans

61
Nekton Description – larger, strong-swimming consumers
Niche – top consumers in the aquatic ecosystem Example – fish, turtles, and whales

62
Benthos Description – bottom-dwelling creatures
Niche – primary consumers, decomposers Example – barnacles, oysters, and lobsters

63
Freshwater Ecosystems

64
FRESHWATER LIFE ZONES Freshwater life zones include:
Standing (lentic) water such as lakes, ponds, and inland wetlands. Flowing (lotic) systems such as streams and rivers.
 water such as lakes, ponds, and inland wetlands. Flowing (lotic) systems such as streams and rivers.")
65
Flowing Water Ecosystems
Because of different environmental conditions in each zone, a river is a system of different ecosystems.

66
Ecological Services of Rivers
Natural Capital Ecological Services of Rivers Deliver nutrients to sea to help sustain coastal fisheries Deposit silt that maintains deltas Purify water Renew and renourish wetlands Provide habitats for wildlife Figure 12.11 Natural capital: important ecological services provided by rivers. Currently, the services are given little or no monetary value when the costs and benefits of dam and reservoir projects are assessed. According to environmental economists, attaching even crudely estimated monetary values to these ecosystem services would help sustain them. QUESTIONS: Which two of these services do you think are the most important? Which two of these services do you think we are most likely to decline? Fig , p. 267

67
Freshwater Streams and Rivers: From the Mountains to the Oceans
Water flowing from mountains to the sea creates different aquatic conditions and habitats.

68
Headwater Stream Characteristics
A narrow zone of cold, clear water that rushes over waterfalls and rapids. Large amounts of oxygen and fish are present.

69
Downstream Characteristics
Slower-moving water, less oxygen, warmer temperatures, and lots of algae and cyanobacteria.

70
Energy Source Gravity

71
Standing Water Ecosystems Lakes, ponds, etc.

72
Life in Layers Life in most aquatic systems is found in surface, middle, and bottom layers. Temperature, access to sunlight for photosynthesis, dissolved oxygen content, nutrient availability changes with depth. Euphotic zone (upper layer in deep water habitats): sunlight can penetrate.
: sunlight can penetrate.")
73
Lakes: Water-Filled Depressions
Lakes are large natural bodies of standing freshwater formed from precipitation, runoff, and groundwater seepage consisting of: Littoral zone (near shore, shallow, with rooted plants). Limnetic zone (open, offshore area, sunlit). Profundal zone (deep, open water, too dark for photosynthesis). Benthic zone (bottom of lake, nourished by dead matter).
. Limnetic zone (open, offshore area, sunlit). Profundal zone (deep, open water, too dark for photosynthesis). Benthic zone (bottom of lake, nourished by dead matter).")
74
Littoral Zone A shallow area near the shore, to the depth at which rooted plants stop growing. Ex. frogs, snails, insects, fish, cattails, and water lilies.

75
Limnetic Zone Open, sunlit water that extends to the depth penetrated by sunlight.

76
Profundal Zone Deep, open water where it is too dark for photosynthesis.

77
Thermal Stratification

78
Lakes: Water-Filled Depressions
Figure 6-15

79
Definition The temperature difference in deep lakes where there are warm summers and cold winters.

80
Lakes: Water-Filled Depressions
During summer and winter in deep temperate zone lakes the become stratified into temperature layers and will overturn. This equalizes the temperature at all depths. Oxygen is brought from the surface to the lake bottom and nutrients from the bottom are brought to the top.

81
Causes During the summer, lakes become stratified into different temperature layers that resist mixing because summer sunlight warms surface waters, making them less dense.

82
Thermocline The middle layer that acts as a barrier to the transfer of nutrients and dissolved oxygen.

83
Fall Turnover As the temperatures begin to drop, the surface layer becomes more dense, and it sinks to the bottom. This mixing brings nutrients from the bottom up to the surface and sends oxygen to the bottom.

84
Spring Turnover As top water warms and ice melts, it sinks through and below the cooler, less dense water, sending oxygen down and nutrients up.

85
Freshwater Inland Wetlands: Vital Sponges
Inland wetlands act like natural sponges that absorb and store excess water from storms and provide a variety of wildlife habitats.

86
Freshwater Inland Wetlands: Vital Sponges
Filter and degrade pollutants. Reduce flooding and erosion by absorbing slowly releasing overflows. Helps replenish stream flows during dry periods Help recharge ground aquifers. Provide economic resources and recreation.

87
Marshes An area of temporarily flooded, often silty land beside a river or lake.

88
Swamps A lowland region permanently covered with water.

89
Hardwood Bottomland Forest
An area down by a river or stream where lots of hardwoods, like oaks, grow.

90
Prairie Potholes These are depressions that hold water out on the prairie, especially up north in Canada. It is a very good duck habitat.

91
Peat Moss Bog A wet area that over time fills in (the last stage of succession is peat moss). It can be very deep. In Ireland, they burn this for wood.
. It can be very deep. In Ireland, they burn this for wood.")
92
Importance of freshwater wetlands
They filter & purify water. Habitat for many animals and plants.

93
Historical Aspects Developers and farmers want Congress to revise the definition of wetlands. This would make 60-75% of all wetlands unavailable for protection. The Audubon Society estimates that wetlands provide water quality protection worth $1.6 billion per year, and they say if that wetlands are destroyed, the U.S. would spend $7.7 billion to $31 billion per year in additional flood-control costs.

94
Definition A partially enclosed area of coastal water where sea water mixes with freshwater.

95
Salt Marshes The ground here is saturated with water and there is little oxygen, so decay takes place slowly. It has a surface inlet and outlet, and contains many invertebrates. It is also the breeding ground for many ocean animals. Ex. crabs and shellfish.

96
Mangrove Forests These are along warm, tropical coasts where there is too much silt for coral reefs to grow. It is dominated by salt-tolerant trees called mangroves (55 different species exist). It also helps to protect the coastline from erosion and provides a breeding nursery for some 2000 species of fish, invertebrates, and plants.
. It also helps to protect the coastline from erosion and provides a breeding nursery for some 2000 species of fish, invertebrates, and plants.")
97
Importance of Estuaries
Just one acre of estuary provides $75,000 worth of free waste treatment, and has a value of about $83,000 when recreation and fish for food are included. Prime Kansas farmland has a top value of $1,200 and an annual production value of $600.

98
Southern Florida to the Keys
The Everglades Southern Florida to the Keys

99
Case Study: Restoring the Florida Everglades
The world’s largest ecological restoration project involves trying to undo some of the damage inflicted on the Everglades by human activities. 90% of park’s wading birds have vanished. Other vertebrate populations down 75-95%. Large volumes of water that once flowed through the park have been diverted for crops and cities. Runoff has caused noxious algal blooms.

100
Problems As Miami develops, it encroaches on everglades. Plus, it prompts people vs. wildlife. It is freshwater and local areas are draining it.

101
Restoring the Florida Everglades
The project has been attempting to restore the Everglades and Florida water supplies.

102
Restoration Build huge aqueduct, or find other sources of fresh water an protect it federally under endangered species act, etc.

103
Heat Capacity Water changes temp very slowly because it can store heat. This protects living organisms from the shock of abrupt temperature changes.

104
Heat of Vaporization The temperature at which water turns to vapor.

105
Universal Solvent Water can dissolve a wide variety of compounds. This means it can easily become polluted by water-soluble wastes.

106
Expansion When Frozen Ice has a lower density than liquid water. Thus, ice floats on water.

107
Surface Water Examples – streams, rivers, and lakes
Source – precipitation Watershed – Ex. small streams larger streams rivers sea

108
Groundwater Aquifers–porous rock w/ water flowing through
Water Table – the level of earth’s land crust to which the aquifer is filled Renewability – the circulation rate of groundwater is slow (300 to 4,600 years).
.")
109
Water Usage Irrigation – watering crops
Industry – coolant (power plant) Domestic and Municipal – drinking, sewage, bathwater, dishwater & laundry
 Domestic and Municipal – drinking, sewage, bathwater, dishwater & laundry.")
110
Problems

111
Too Much Water Problems include flooding, pollution of water supply, and sewage seeping into the ground.

112
TOO MUCH WATER Heavy rainfall, rapid snowmelt, removal of vegetation, and destruction of wetlands cause flooding. Floodplains, which usually include highly productive wetlands, help provide natural flood and erosion control, maintain high water quality, and recharge groundwater. To minimize floods, rivers have been narrowed with levees and walls, and dammed to store water.

113
TOO MUCH WATER Comparison of St. Louis, Missouri under normal conditions (1988) and after severe flooding (1993).
 and after severe flooding (1993).")
114
TOO MUCH WATER Human activities have contributed to flood deaths and damages.

115
Oxygen released by vegetation
Forested Hillside Oxygen released by vegetation Diverse ecological habitat Evapotranspiration Trees reduce soil erosion from heavy rain and wind Agricultural land Steady river flow Leaf litter improves soil fertility Figure 14.23 Natural capital degradation: hillside before and after deforestation. Once a hillside has been deforested for timber and fuelwood, livestock grazing, or unsustainable farming, water from precipitation rushes down the denuded slopes, erodes precious topsoil, and can increase flooding in local streams. Such deforestation can also increase landslides and mudflows. A 3,000-year-old Chinese proverb says, “To protect your rivers, protect your mountains.” Tree roots stabilize soil and aid water flow Vegetation releases water slowly and reduces flooding

116
Evapotranspiration decreases Roads destabilize hillsides
After Deforestation Tree plantation Evapotranspiration decreases Roads destabilize hillsides Ranching accelerates soil erosion by water and wind Winds remove fragile topsoil Gullies and landslides Agricultural land is flooded and silted up Figure 14.23 Natural capital degradation: hillside before and after deforestation. Once a hillside has been deforested for timber and fuelwood, livestock grazing, or unsustainable farming, water from precipitation rushes down the denuded slopes, erodes precious topsoil, and can increase flooding in local streams. Such deforestation can also increase landslides and mudflows. A 3,000-year-old Chinese proverb says, “To protect your rivers, protect your mountains.” Heavy rain leaches nutrients from soil and erodes topsoil Rapid runoff causes flooding Silt from erosion blocks rivers and reservoirs and causes flooding downstream

117
Too Little Water

118
Examples Examples include drought and expanding deserts.

119
Overdrawing Surface Water
Lake levels drop, recreation use drops, fisheries drop, and salinization occurs. Ex. Soviet Union (Aral Sea); the inland sea drained the river that fed into it. Now it’s a huge disaster. 1997 1964
; the inland sea drained the river that fed into it. Now it’s a huge disaster")
120
Case Study: The Aral Sea Disaster
Diverting water from the Aral Sea and its 2 feeder rivers mostly for irrigation has created a major ecological, economic, and health disaster. About 85% of the wetlands have been eliminated and roughly 50% of the local bird and mammal species have disappeared. Since 1961, the sea’s salinity has tripled and the water has dropped by 22 meters most likely causing 20 of the 24 native fish species to go extinct.

121
Aquifer Depletion This harms endangered species, and salt water can seep in.

122
Salinization of Irrigated Soil
Water is poured onto soil and evaporates. Over time, as this is repeated, nothing will grow there anymore.

123
U.S. Water Problems

124
Surface Water Problems
The polluted Mississippi River (non-source point pollution) has too much phosphorus. In the Eerie Canal, which connects the ocean to the Great Lakes, lampreys came in and depleted the fish. The zebra mollusk is also a problem in the Great Lakes.
 has too much phosphorus. In the Eerie Canal, which connects the ocean to the Great Lakes, lampreys came in and depleted the fish. The zebra mollusk is also a problem in the Great Lakes.")
125
Effects of Plant Nutrients on Lakes: Too Much of a Good Thing
Plant nutrients from a lake’s environment affect the types and numbers of organisms it can support.

126
Effects of Plant Nutrients on Lakes: Too Much of a Good Thing
Plant nutrients from a lake’s environment affect the types and numbers of organisms it can support. Oligotrophic (poorly nourished) lake: Usually newly formed lake with small supply of plant nutrient input. Eutrophic (well nourished) lake: Over time, sediment, organic material, and inorganic nutrients wash into lakes causing excessive plant growth.
 lake: Usually newly formed lake with small supply of plant nutrient input. Eutrophic (well nourished) lake: Over time, sediment, organic material, and inorganic nutrients wash into lakes causing excessive plant growth.")
127
Effects of Plant Nutrients on Lakes: Too Much of a Good Thing
Cultural eutrophication: Human inputs of nutrients from the atmosphere and urban and agricultural areas can accelerate the eutrophication process.

128
Mono Lake (like the Dead Sea) This has a huge salt concentration due to man’s draining.
 This has a huge salt concentration due to man’s draining.")
129
Colorado River Basin These are dams & reservoirs that feed from the Colorado River all the way to San Diego, LA, Palm Springs, Phoenix & Mexico. So far has worked because they haven’t withdrawn their full allocations.

130
The Colorado River Basin
The area drained by this basin is equal to more than one-twelfth of the land area of the lower 48 states.

131
UPPER BASIN LOWER BASIN Gulf of California
IDAHO WYOMING Dam Aqueduct or canal Salt Lake City Upper Basin Denver Lower Basin Grand Junction UPPER BASIN UTAH Colorado River NEVADA Lake Powell COLORADO Grand Canyon Glen Canyon Dam Las Vegas NEW MEXICO CALIFORNIA Boulder City Los Angeles ARIZONA Albuquerque Figure 14.14 Natural capital degradation: the Colorado River basin. The area drained by this basin is equal to more than one-twelfth of the land area of the lower 48 states. Two large reservoirs—Lake Mead behind the Hoover Dam and Lake Powell behind the Glen Canyon Dam (Figure 14-15)—store about 80% of the water in this basin. LOWER BASIN Palm Springs 100 mi. Phoenix San Diego Yuma 150 km Tucson Mexicali All-American Canal Gulf of California MEXICO Fig , p. 318
—store about 80% of the water in this basin. LOWER BASIN. Palm Springs. 100 mi. Phoenix. San Diego. Yuma. 150 km. Tucson. Mexicali. All-American Canal. Gulf of California. MEXICO. Fig , p")
132
Case Study: The Colorado Basin – an Overtapped Resource
The Colorado River has so many dams and withdrawals that it often does not reach the ocean. 14 major dams and reservoirs, and canals. Water is mostly used in desert area of the U.S. Provides electricity from hydroelectric plants for 30 million people (1/10th of the U.S. population).
.")
133
Groundwater Problems These include pollution, salt, and draining too much.

134
Other Effects of Groundwater Overpumping
Sinkholes form when the roof of an underground cavern collapses after being drained of groundwater. Figure 14-10

135
Groundwater Depletion: A Growing Problem
Areas of greatest aquifer depletion from groundwater overdraft in the continental U.S. The Ogallala, the world’s largest aquifer, is most of the red area in the center (Midwest). Figure 14-8
. Figure")
136
Ogallala Aquifer This is the world’s largest known aquifer, and fuels agricultural regions in the U.S. It extends from South Dakota to Texas. It’s essentially a non-renewable aquifer from the last ice age with an extremely slow recharge rate. In some cases, water is pumped out 8 to 10 times faster than it is renewed. Northern states will still have ample supplies, but for the south it’s getting thinner. It is estimated that ¼ of the aquifer will be depleted by 2020.

137
Global Water Problems

138
Impacts of Human Activities on Freshwater Systems
Dams, cities, farmlands, and filled-in wetlands alter and degrade freshwater habitats. Dams, diversions and canals have fragmented about 40% of the world’s 237 large rivers. Flood control levees and dikes alter and destroy aquatic habitats. Cities and farmlands add pollutants and excess plant nutrients to streams and rivers. Many inland wetlands have been drained or filled for agriculture or (sub)urban development.
urban development.")
139
Core Case Study: A Biological Roller Coaster Ride in Lake Victoria
Lake Victoria has lost their endemic fish species to large introduced predatory fish. Figure 12-1

140
Core Case Study: A Biological Roller Coaster Ride in Lake Victoria
Reasons for Lake Victoria’s loss of biodiversity: Introduction of Nile perch. Lake experienced algal blooms from nutrient runoff. Invasion of water hyacinth has blocked sunlight and deprived oxygen. Nile perch is in decline because it has eaten its own food supply.

141
Stable Runoff As water runs off from rain, it’s supposed to get into rivers, and finally off to the sea. But when we dam rivers, less goes to the ocean, meaning the brackish water (where the river hits the ocean) becomes more salty. This is the breeding ground for many fish and invertebrates. This harms the ecology of the area.
 becomes more salty. This is the breeding ground for many fish and invertebrates. This harms the ecology of the area.")
142
Conservation Description: Saving the water we have
Methods: recycling; conserving at home; xeriscaping; fix leaks Benefits: Saves money; Saves Wildlife Problems: bothersome to people; lack of caring; laziness

Similar presentations


 Biodiversity Formation Important ecological and economic.>")


 2. Floaters 3. Swimmers Which is which? -> **All marine organisms live in.>")

>")

: Estuaries, coastlines, coral reefs, coastal marshes, mangrove swamps, ocean.>")


