Download presentation
Presentation is loading. Please wait.

1
The effectiveness of conservation efforts in the Little Bear River Watershed Douglas Jackson-Smith: SSWA Dept, USU Nancy Mesner: WATS Dept, USU David Stevens, Jeff Horsburgh, Darwin Sorensen : CEE Dept, USU

2
Overview Background Analysis of Existing WQ Data Implementation & Maintenance Study Alternative Approaches – Riparian Study Targeting Critical Areas Common BMP Monitoring Problems Rethinking Monitoring

3
USDA’s Conservation Effectiveness Assessment Projects National Assessment Watershed Studies Bibliographies and Lit Reviews

4
CEAP Program Objectives Determine whether publicly-funded programs to reduce phosphorus loadings from nonpoint sources into surface waters in the Little Bear River watershed are effective; Examine the strengths and weaknesses of different water quality monitoring programs; and Make recommendations to stakeholders to ensure that future agricultural management efforts are targeted towards the most effective and socioeconomically viable BMPs.

5
USU Project Overview Original LBR watershed project (~1990-2002) Funds from HUA; EPA 319; EQIP USU Conservation Effects Assessment Program (CEAP) Grant – 2005-2009 Assess effects of historical conservation practices Review historical data Map practices and their implementation Model watershed and stream response Outreach and education Establish water quality monitoring network
 Funds from HUA; EPA 319; EQIP USU Conservation Effects Assessment Program (CEAP) Grant – Assess effects of historical conservation practices Review historical data Map practices and their implementation Model watershed and stream response Outreach and education Establish water quality monitoring network")
6
Little Bear Watershed

7
Little Bear River Hydrologic Unit Project

8
Pre-treatment problems: Bank erosion, manure management, flood irrigation problems

9
WQ efforts in Little Bear Hydrologic Unit Area Project TMDL Project, 319 funds Additional cost share programs Other planning (eg Phase II, Source Water Protection)
")
10
Treatments: bank stabilization, river reach restoration, off-stream watering, manure and water management, grazing management

11
Analysis of Historic Water Quality Trends

12
Seasonal Kendall Trend for TP concentration at Mendon Rd (mouth of LBR). Conservation project initiation Slope -0.0043 mg/L yr Since 1992 No Significant slope before 1990

13
Flow data may drag down ‘post’ estimates

14
Ambient Monitoring Data Little Bear at Paradise Moist Dry ‘Normal’ Cons Projects

15
OBSERVATIONS Trends suggest water quality improvements Trends suggest water quality improvements Data Record Insufficient to Data Record Insufficient to Tease out Exogenous Variables – project coincided with changes in background climate conditions Tease out Exogenous Variables – project coincided with changes in background climate conditions Link Trends to BMP Implementation Link Trends to BMP Implementation Support Traditional Modeling Approaches Support Traditional Modeling Approaches

16
Implementation and Maintenance of BMPs Implementation and Maintenance of BMPs

17
BEHAVIOR Socioeconomic Component IMPLEMENTATIONIMPLEMENTATIONIMPLEMENTATIONIMPLEMENTATION PROGRAM SIGNUP CONTRACTED BMPSCONTRACTED BMPS MAINTENANCEMAINTENANCEMAINTENANCEMAINTENANCE WATER QUALITY

18
Socioeconomic Methods Gather formal practice info from NRCS files Gather formal practice info from NRCS files Went through every file – 90 landowners Went through every file – 90 landowners Create master list of practices (871 total) Create master list of practices (871 total) Copied key maps for interviews Copied key maps for interviews Conduct field interviews with participants Conduct field interviews with participants Validate file information Validate file information Contacted 70 of 90 participants Contacted 70 of 90 participants 55 agreed to be interviewed 55 agreed to be interviewed 61% of all landowners; 79% of those we contacted 61% of all landowners; 79% of those we contacted Conducted field interviews - ~90 minutes Conducted field interviews - ~90 minutes Detailed discussoin about BMP experience Detailed discussoin about BMP experience
 Create master list of practices (871 total) Copied key maps for interviews Copied key maps for interviews Conduct field interviews with participants Conduct field interviews with participants Validate file information Validate file information Contacted 70 of 90 participants Contacted 70 of 90 participants 55 agreed to be interviewed 55 agreed to be interviewed 61% of all landowners; 79% of those we contacted 61% of all landowners; 79% of those we contacted Conducted field interviews - ~90 minutes Conducted field interviews - ~90 minutes Detailed discussoin about BMP experience Detailed discussoin about BMP experience")
19
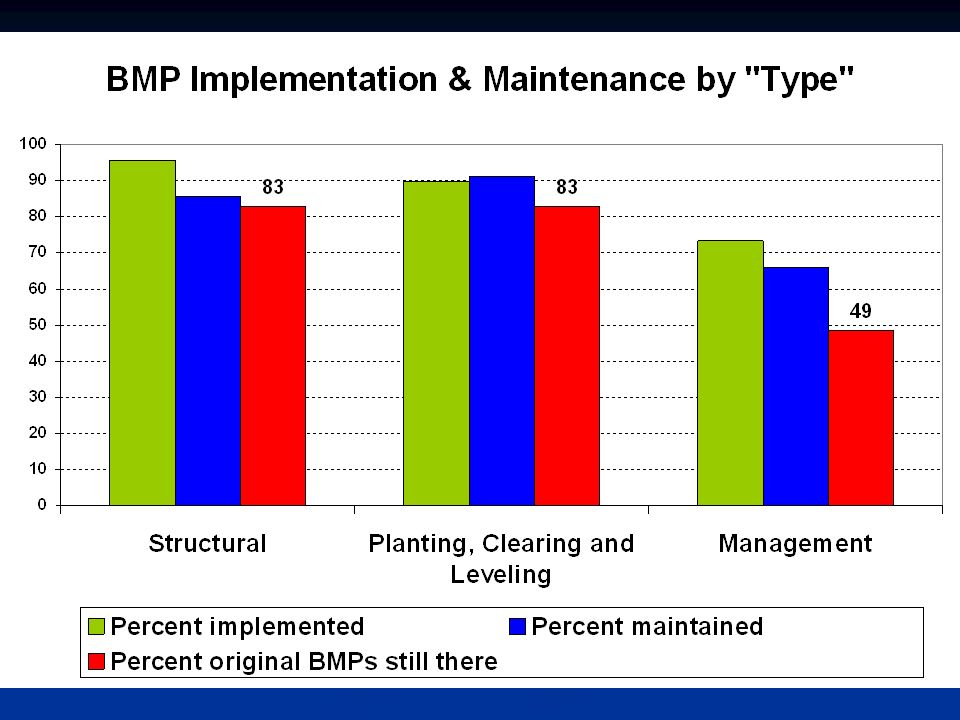
Findings - Implementation Individual BMPs Individual BMPs 83% of BMPs successfully implemented 83% of BMPs successfully implemented Reasons for non-implementation (17%) Reasons for non-implementation (17%) Some cases – not recognized as contracted BMP Some cases – not recognized as contracted BMP Many – management practices that did not change behavior (based on interview discussion) Many – management practices that did not change behavior (based on interview discussion) Farm-Level Farm-Level 32% farms implemented all BMPs 32% farms implemented all BMPs 60% farms implemented more than ½ 60% farms implemented more than ½
 Reasons for non-implementation (17%) Some cases – not recognized as contracted BMP Some cases – not recognized as contracted BMP Many – management practices that did not change behavior (based on interview discussion) Many – management practices that did not change behavior (based on interview discussion) Farm-Level Farm-Level 32% farms implemented all BMPs 32% farms implemented all BMPs 60% farms implemented more than ½ 60% farms implemented more than ½")
20
Maintenance of BMPs Is it still there? If not, why not? Is it still there? If not, why not? Overall – Overall – 21% of implemented BMPs not still there 21% of implemented BMPs not still there Combined with non-implemented practices = 1/3 of all originally contracted BMPs not currently there Combined with non-implemented practices = 1/3 of all originally contracted BMPs not currently there Why not maintained? Why not maintained? No longer farming or sold land – 32% No longer farming or sold land – 32% Still farming, no longer use – 68% Still farming, no longer use – 68%

22
Implications: Maintenance Good news: Good news: Producers did not discontinue the practices because they did not like them Producers did not discontinue the practices because they did not like them Not so good news: Not so good news: The management practices had the shortest lifespan The management practices had the shortest lifespan ALSO: Nonfarm Development and Farm Changes can also affect long term impacts ALSO: Nonfarm Development and Farm Changes can also affect long term impacts

23
Implications: Implementation Management practices are the heart of conservation programs Management practices are the heart of conservation programs Failure to fully implement may have huge impacts on success Failure to fully implement may have huge impacts on success Big Question: How can management behaviors be implemented more effectively? Big Question: How can management behaviors be implemented more effectively?

24
Analysis of Riparian Area BMPs

25
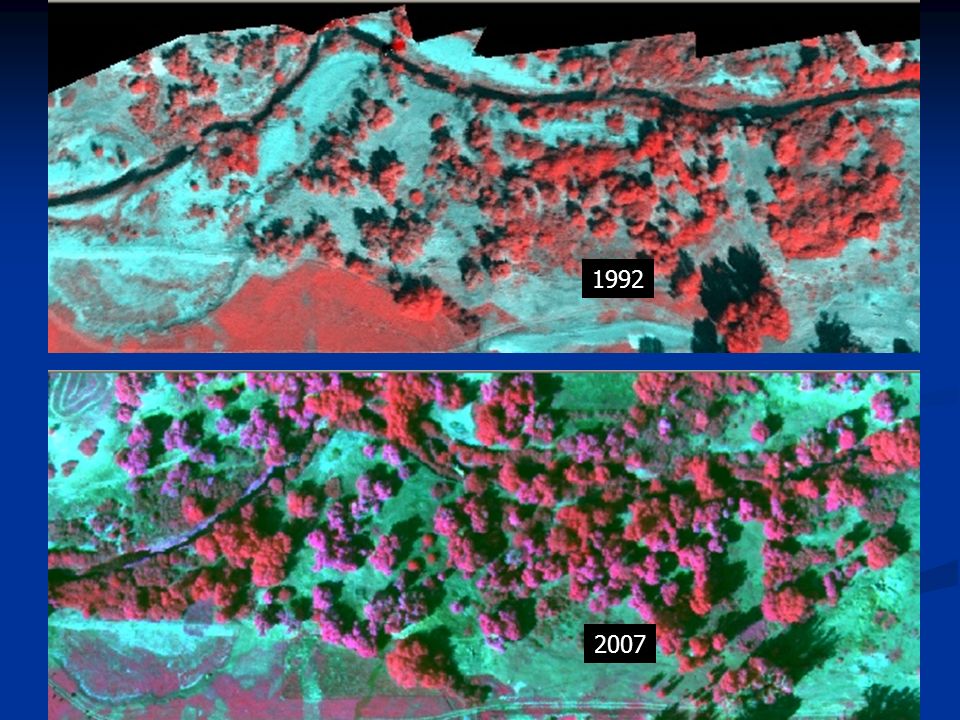
Videography Analysis Component Limitations to WQ monitoring data in 1990s Limitations to WQ monitoring data in 1990s Search for alternative indicators of BMP impact Search for alternative indicators of BMP impact Discussions with colleagues led to discovery of 1992 aerial 3-band videography for stretches of LBR Discussions with colleagues led to discovery of 1992 aerial 3-band videography for stretches of LBR Arranged to re-fly the river in 2007 Arranged to re-fly the river in 2007

26
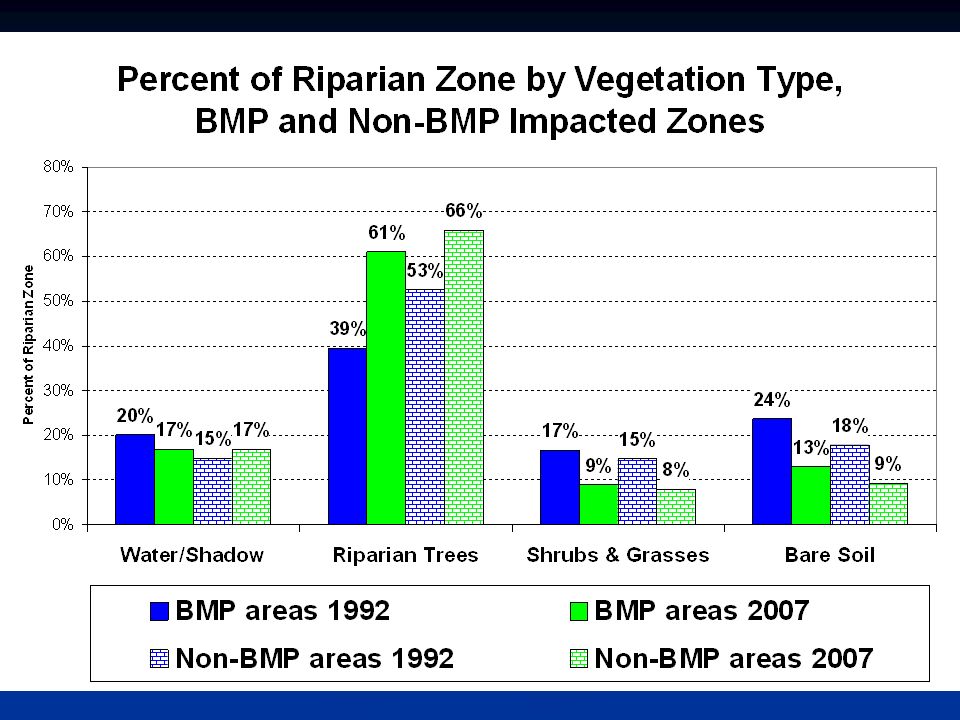
Analysis Strategy Match images from 1992 and 2007 Match images from 1992 and 2007 Classify vegetative conditions for both time periods within identical riparian zones Classify vegetative conditions for both time periods within identical riparian zones Riparian trees Riparian trees Small shrubs & grasses Small shrubs & grasses Bare soil Bare soil Water & Shadows Water & Shadows Quantify changes in riparian vegetation and stream geomorphology between 1992-2007 Quantify changes in riparian vegetation and stream geomorphology between 1992-2007 Associate presence or absence of ‘riparian-relevant’ BMPs to these changes Associate presence or absence of ‘riparian-relevant’ BMPs to these changes

27
‘Riparian Area’ Focused BMPs Stream channel structural BMPs Stream channel structural BMPs Clearing & snagging (326) Clearing & snagging (326) Streambank and shoreline protection (580)(13,825’) Streambank and shoreline protection (580)(13,825’) Stream channel stabilization (584) Stream channel stabilization (584) Stream access controls for livestock Stream access controls for livestock Riparian fencing (5383) – subset of 382 Riparian fencing (5383) – subset of 382 Stream crossing (578) Stream crossing (578) Riparian vegetation BMPs Riparian vegetation BMPs Channel vegetation (322) Channel vegetation (322) Critical area planting (342) Critical area planting (342) Tree/Shrub establishment (612) Tree/Shrub establishment (612)
 Clearing & snagging (326) Streambank and shoreline protection (580)(13,825’) Streambank and shoreline protection (580)(13,825’) Stream channel stabilization (584) Stream channel stabilization (584) Stream access controls for livestock Stream access controls for livestock Riparian fencing (5383) – subset of 382 Riparian fencing (5383) – subset of 382 Stream crossing (578) Stream crossing (578) Riparian vegetation BMPs Riparian vegetation BMPs Channel vegetation (322) Channel vegetation (322) Critical area planting (342) Critical area planting (342) Tree/Shrub establishment (612) Tree/Shrub establishment (612)")
29
1992 video images 2007 digital images

30
1992 Multispectral Mosaic2007 Multispectral Mosaic Site: Upstream from Hyrum Dam Detail

31
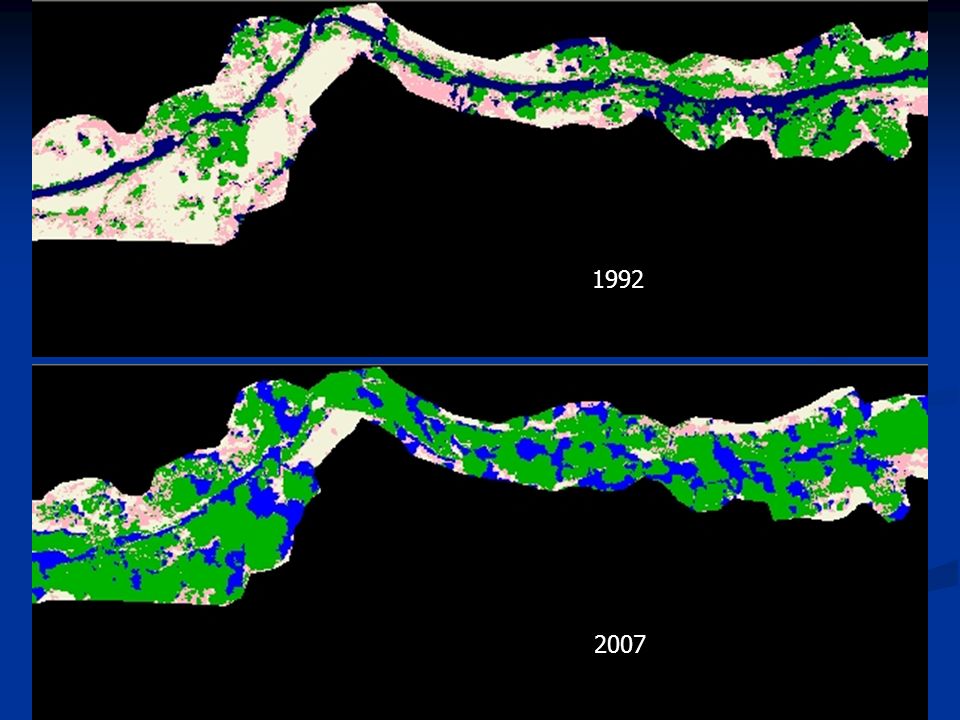
Initial Observations Significant vegetation growth Significant vegetation growth Trees significantly larger throughout watershed Trees significantly larger throughout watershed Significant geomorphologic changes in main stream channel path Significant geomorphologic changes in main stream channel path Moving centerline Moving centerline New ‘islands’ New ‘islands’ Major bank cuts & shifts in some new erosion Major bank cuts & shifts in some new erosion BIG QUESTION: Is it because of BMPs? BIG QUESTION: Is it because of BMPs?

32
1992 2007
33
1992 2007
34
STATISTICAL RESULTS Calculate area for each of 5 different vegetative classes Calculate area for each of 5 different vegetative classes PREVIEW: analysis approach PREVIEW: analysis approach Document overall patterns of change Document overall patterns of change Shows the ‘background’ trends Shows the ‘background’ trends Compare changes in “BMP impact zones” Compare changes in “BMP impact zones” Aggregated riparian-relevant BMPs Aggregated riparian-relevant BMPs Individual riparian-relevant BMPs Individual riparian-relevant BMPs Comparison to Non-BMP areas Comparison to Non-BMP areas

37
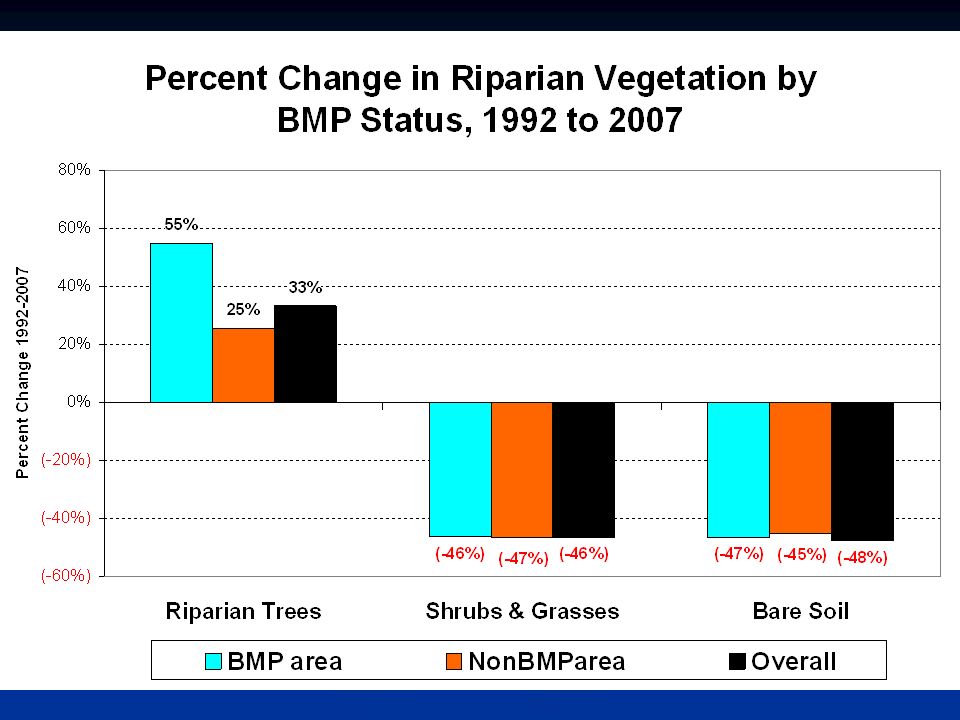
Quick Summary Riparian conditions improving throughout watershed (more trees, less exposed soil) Riparian conditions improving throughout watershed (more trees, less exposed soil) BMPs installed in areas with less vegetation BMPs installed in areas with less vegetation BMPs associated with much more rapid growth in tree cover, similar rates of decline in exposed soil BMPs associated with much more rapid growth in tree cover, similar rates of decline in exposed soil Fences = reduced exposed soil most Fences = reduced exposed soil most Instream work = increased trees the most Instream work = increased trees the most
 Riparian conditions improving throughout watershed (more trees, less exposed soil) BMPs installed in areas with less vegetation BMPs installed in areas with less vegetation BMPs associated with much more rapid growth in tree cover, similar rates of decline in exposed soil BMPs associated with much more rapid growth in tree cover, similar rates of decline in exposed soil Fences = reduced exposed soil most Fences = reduced exposed soil most Instream work = increased trees the most Instream work = increased trees the most")
38
Targeting Critical Areas

39
Idea behind Targeting… Growing Recognition of Landscape Variability Growing Recognition of Landscape Variability Research Q: Is there evidence that the BMPs implemented in LBR specifically targeted critical areas? Research Q: Is there evidence that the BMPs implemented in LBR specifically targeted critical areas? Critical Areas: areas where the potential contribution of pollutants (i.e., sediments, phosphorus) to the receiving water is significantly higher than other areas Critical Areas: areas where the potential contribution of pollutants (i.e., sediments, phosphorus) to the receiving water is significantly higher than other areas
 to the receiving water is significantly higher than other areas Critical Areas: areas where the potential contribution of pollutants (i.e., sediments, phosphorus) to the receiving water is significantly higher than other areas.")
41
Combined Map of Risk Zones

42
Description of LBR Area Low- influence km 2 (%) Low-risk km 2 (%) Sub-risk km 2 (%) Risk km 2 (%) Total km 2 LBR Watershed (total)365 (53%)225 (33%)57 (8%)35 (5%)682 Farm Field Area173 (67%)47 (18%)20 (8%)19 (7%)259 Contracted Farm Field Area38 (48%)21(26%)12(15%)9(11%)80 Non-Contract Farm Field Area135 (75%)26 (15%)8 (4%)10 (6%)179
 Low-risk km 2 (%) Sub-risk km 2 (%) Risk km 2 (%) Total km 2 LBR Watershed (total)365 (53%)225 (33%)57 (8%)35 (5%)682 Farm Field Area173 (67%)47 (18%)20 (8%)19 (7%)259 Contracted Farm Field Area38 (48%)21(26%)12(15%)9(11%)80 Non-Contract Farm Field Area135 (75%)26 (15%)8 (4%)10 (6%)179")
43
62% 23% Covered By BMPs 47%

44
Implications: Spatial Analysis Evidence exists that higher risk zones were targeted with BMPs (not random) Evidence exists that higher risk zones were targeted with BMPs (not random) More than ½ of riskiest areas covered by BMPs More than ½ of riskiest areas covered by BMPs More than 70% of BMPs in zones that are not considered at high risk for runoff erosion More than 70% of BMPs in zones that are not considered at high risk for runoff erosion Suggests opportunity for greater targeting & efficiency Suggests opportunity for greater targeting & efficiency Related to structure of program Related to structure of program
 Evidence exists that higher risk zones were targeted with BMPs (not random) More than ½ of riskiest areas covered by BMPs More than ½ of riskiest areas covered by BMPs More than 70% of BMPs in zones that are not considered at high risk for runoff erosion More than 70% of BMPs in zones that are not considered at high risk for runoff erosion Suggests opportunity for greater targeting & efficiency Suggests opportunity for greater targeting & efficiency Related to structure of program Related to structure of program")
45
Common Problems in BMP Monitoring Programs

46
Lessons Learned: Common problems in BMP monitoring programs Failure to design monitoring plan around BMP objectives Failure to design monitoring plan around BMP objectives Failure to identify and quantify sources of variability in these dynamic systems. Failure to identify and quantify sources of variability in these dynamic systems. F ailure to understand pollutant pathways and transformations choosing inappropriate monitoring approaches F ailure to understand pollutant pathways and transformations choosing inappropriate monitoring approaches

47
Little Bear River Watershed, Utah v

48
1994 1113 19951013 19961013 1997 11 4 1998 610 1999 710 2000 6 5 2001 4 7 2002 2 8 2003 4 8 2004 1 8 Total Observations at Watershed Outlet site DischargeTotal phosphorus 1976 - 2004:162 241 1994 - 2004: 72 99 Number of observations each year

49
Was the original UDWQ monitoring program a failure? No….Program was intended to detect exceedences of water quality criteria. The failure was ours…. In attempting to use these monitoring data for detecting change in loads

50
Failure to design monitoring plan around BMP objectives Failure to design monitoring plan around BMP objectives Failure to identify and quantify sources of variability in these dynamic system. Failure to identify and quantify sources of variability in these dynamic system. A failure to understand pollutant pathways and transformations choosing inappropriate monitoring approaches

51
“upper watershed site” “lower watershed site”

52
Monitoring stations

53
Observations Database (ODM) Base Station Computer(s) Data Processing Applications Internet Telemetry Network Environmental Sensors Data discovery, visualization, analysis, and modeling through Internet enabled applications Programmer interaction through web services Internet Workgroup HIS Tools Workgroup HIS Server Monitoring/data system
 Base Station Computer(s) Data Processing Applications Internet Telemetry Network Environmental Sensors Data discovery, visualization, analysis, and modeling through Internet enabled applications Programmer interaction through web services Internet Workgroup HIS Tools Workgroup HIS Server Monitoring/data system")
54
Upper Site Flow (cfs) Turbidity (NTU) Seasonal and annual variation Variation between sites Different pathways of pollutants January – December 2006 Lower Site Flow (cfs) Turbidity (NTU)
 Turbidity (NTU) Seasonal and annual variation Variation between sites Different pathways of pollutants January – December 2006 Lower Site Flow (cfs) Turbidity (NTU)")
55
Sample Data

56
Surrogate monitoring results

57
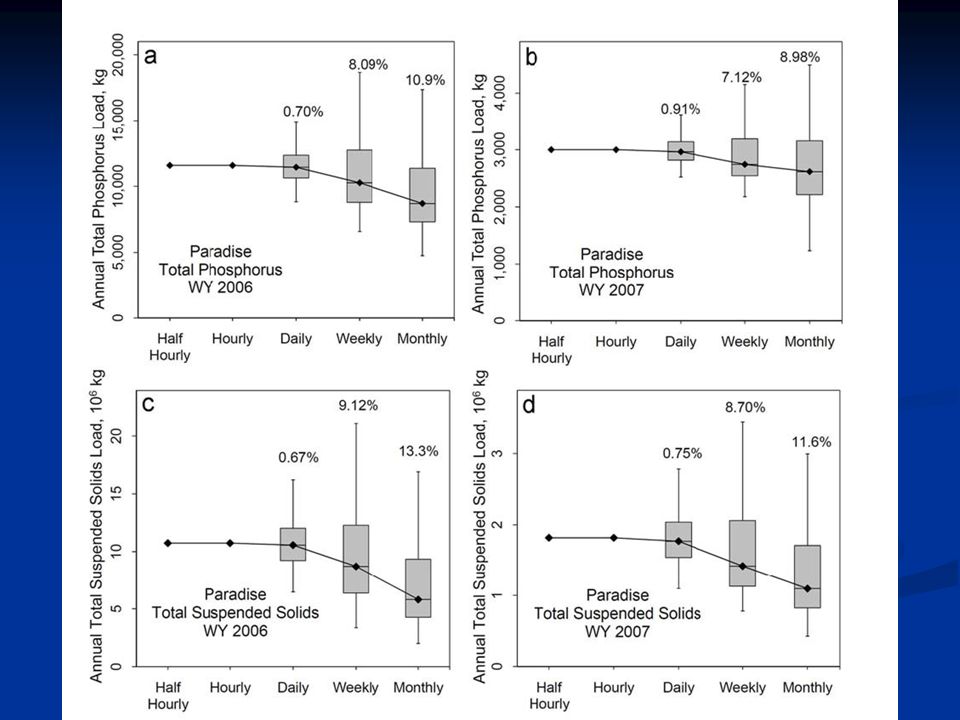
Sources of variability in sampling data Relationship of surrogate to target pollutant Sampling frequency Timing of sampling Rare events

58
Variability in correlations between turbidity and water quality parameters (TSS and TP) Turbidity vs TSS at Upper Site
 Turbidity vs TSS at Upper Site")
60
Impact of “rare” events TSS Load Upper SiteLower Site Annual (kg) 8.9 X 10 6 1.4 X 10 7 Runoff (% of total) 89% 54% Baseflow (% of total) 11% 46% Storms (% of baseflow) <1% 16%
 8.9 X X 10 7 Runoff (% of total) 89% 54% Baseflow (% of total) 11% 46% Storms (% of baseflow) <1% 16%")
61
Failure to design monitoring plan around BMP objectives Failure to design monitoring plan around BMP objectives Failure to identify and quantify sources of variability in these dynamic system. Failure to identify and quantify sources of variability in these dynamic system. A failure to understand pollutant pathways and transformations choosing inappropriate monitoring approaches

62
Problem: excess sediment Average flow = 20 cfs BMP = series of in-stream sediment basins Problems with “one-size-fits-all” monitoring design Above Below

63
Problem: excess phosphorus Average flow = 1000 cfs BMP = fence cattle OUT of riparian area and revegetate

64
Rethinking Monitoring

65
Nancy Mesner, Dept of Watershed Sciences Utah State University nancy.mesner@usu.edunancy.mesner@usu.edu; 435 797 7541 Ginger Paige, University of Wyoming University of Wyoming gpaige@uwyo.edugpaige@uwyo.edu; (307) 766-2200 Designing Monitoring Programs to Evaluate BMP Effectiveness
 Designing Monitoring Programs to Evaluate BMP Effectiveness")
66
The road to more effective monitoring…. Monitoring plans require careful thought before anything is implemented. Consider how the data will be used to demonstrate change. Use your understanding of your watershed and how the pollutants of concern behave to target monitoring most effectively. Use different approaches for different BMPs.

67
Keep project goals and objectives in mind when monitoring BMPs Monitor at an appropriate scale Keep time lags in mind Be selective, consider individual situations Monitor surrogates when appropriate Control or measure human behaviors / other watershed changes. The road to more effective monitoring….

68
Focuses on the considerations and decisions necessary as a project is first being considered. NOT a “how-to” manual of protocols Online, interactive version Currently being used to develop monitoring plans in MT, CO, WY, UT and tribes

69
Target Audience State Environmental Agencies Conservation Groups Land Management Agencies Citizen Monitoring Groups

70
Table of Contents INTRODUCTION INTRODUCTION SECTION 1 What is Your Monitoring Objective? SECTION 1 What is Your Monitoring Objective? SECTION 2 Understanding Your Pollutant and Your Natural System SECTION 2 Understanding Your Pollutant and Your Natural System SECTION 3 Consider the Scale SECTION 3 Consider the Scale SECTION 4 Monitoring versus Modeling: Different Approaches to Detecting Impacts SECTION 4 Monitoring versus Modeling: Different Approaches to Detecting Impacts SECTION 5 Choosing the Best Monitoring Design SECTION 5 Choosing the Best Monitoring Design SECTION 6 Site Specific Considerations SECTION 6 Site Specific Considerations SECTION 7 Protocols SECTION 7 Protocols SECTION 8 Quality Assurance and Quality Control SECTION 8 Quality Assurance and Quality Control SECTION 9 Data Management SECTION 9 Data Management SECTION 10 Analysis of Data SECTION 10 Analysis of Data SECTION 11 Interpreting and Using the Data SECTION 11 Interpreting and Using the Data REFERENCES REFERENCES APPENDIX A-C: DEFINITIONS & RESOURCES APPENDIX A-C: DEFINITIONS & RESOURCES

71
Additional Resources - Tools Check list Check list identify KEY components of a monitoring program identify KEY components of a monitoring program Decision Tree Decision Tree non- linear process – very interactive non- linear process – very interactive Web Version of the Guidance Document: Web Version of the Guidance Document: (Under Development) active links to the information and references in the Guidance Document active links to the information and references in the Guidance Document
 active links to the information and references in the Guidance Document active links to the information and references in the Guidance Document")
72
Check List ► Method to help identify KEY components that need to be considered ► Takes one through the thought process.

73
Decision Tree ► Identifies KEY components ► Shows links between components ► Links to information in the Guidance doc ► Non – linear!!

76
Next Steps Finalizing document Available as a document & online as pdf Northern Plains and Mountains Website http://region8water.colostate.edu/ Developing web version Links to “key” information models websites water quality standards Using in watershed WQ monitoring programs Getting and incorporating feedback

77
Additional Conclusions Formal USDA Program files are imperfect guide to actual BMP implementation & maintenance Fieldwork can generate important insights into water- quality relevant behaviors More accurate behavioral component of models Understanding barriers to implementation & maintenance Face to Face Contact = particularly useful Takes time & money

78
Future Actions Assistance with Watershed Coordinators in developing effective monitoring plans; Assistance with Watershed Coordinators in developing effective monitoring plans; Application of many of the lessons learned on a Utah watershed project Application of many of the lessons learned on a Utah watershed project Evaluation of effectiveness of Utah’s NPS program. Evaluation of effectiveness of Utah’s NPS program.

79
QUESTIONS? CONTACT INFO: nancy.mesner@usu.edu doug.jackson-smith@usu.edu david.stevens@usu.edu This research is supported by CSREES CEAP Competitive Watershed Grant UTAW-2004-05671

Similar presentations