Download presentation
Presentation is loading. Please wait.

1
Student Assessment Survey Results June 9, 2015

2
Demographic of Survey Participants

3
Demographics: Who took the survey?

4
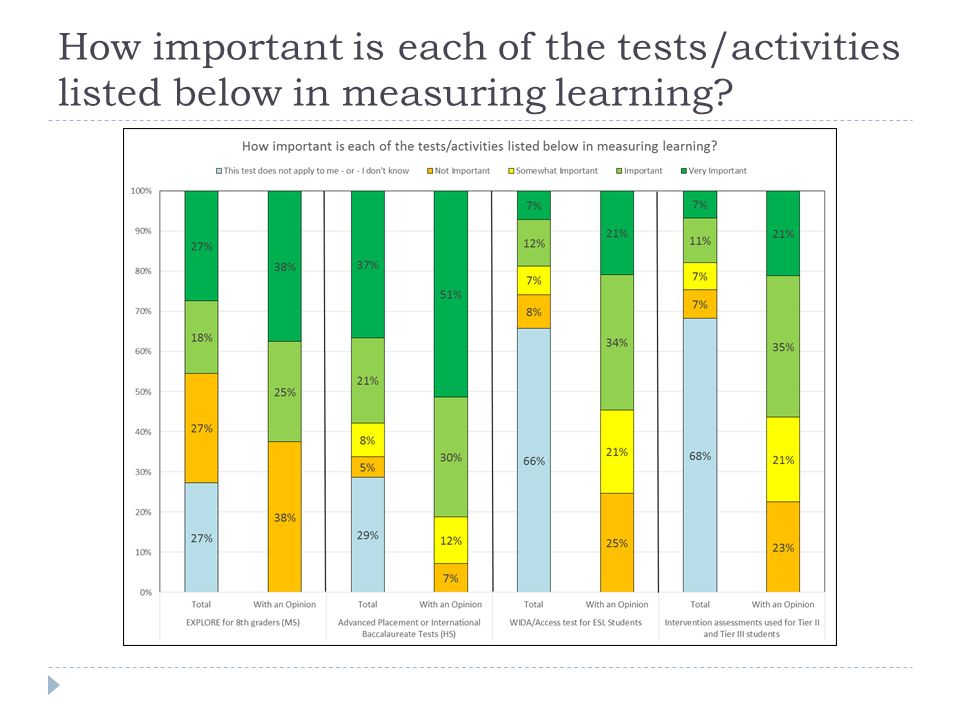
The importance of tests or activities in measuring learning (HS) = High School only, (MS) = Middle School Only
 = High School only, (MS) = Middle School Only")
5
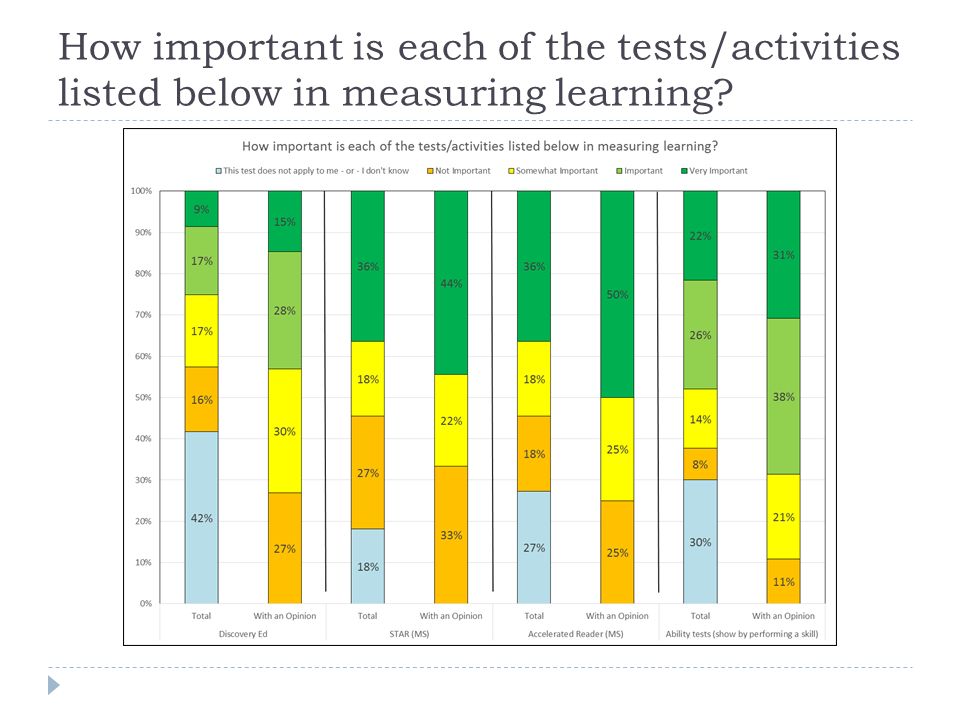
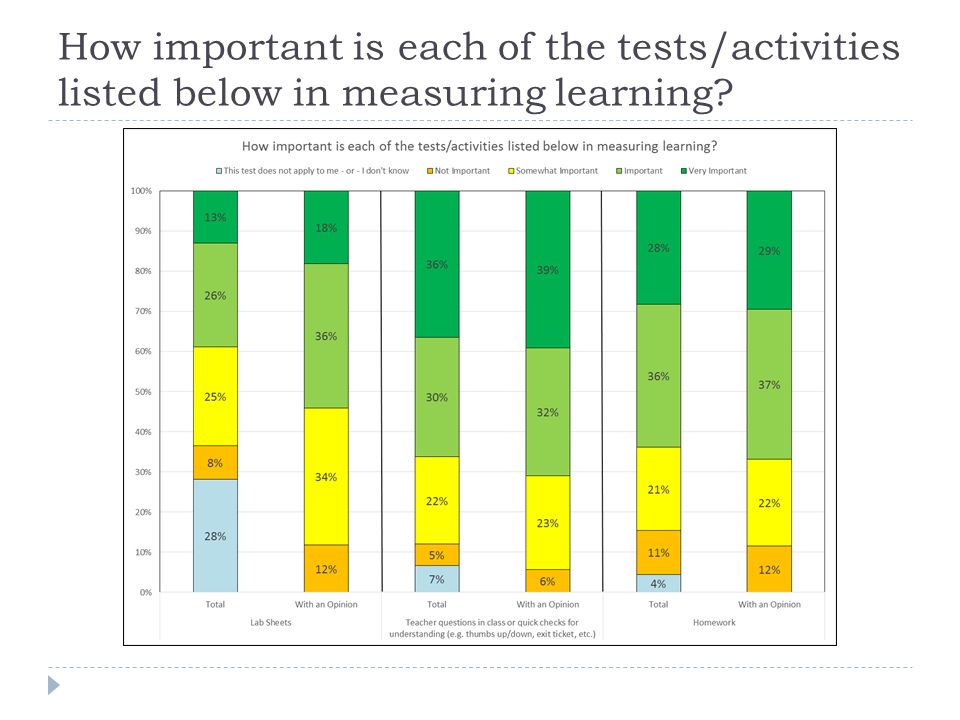
How important is each of the tests/activities listed below in measuring learning?

10
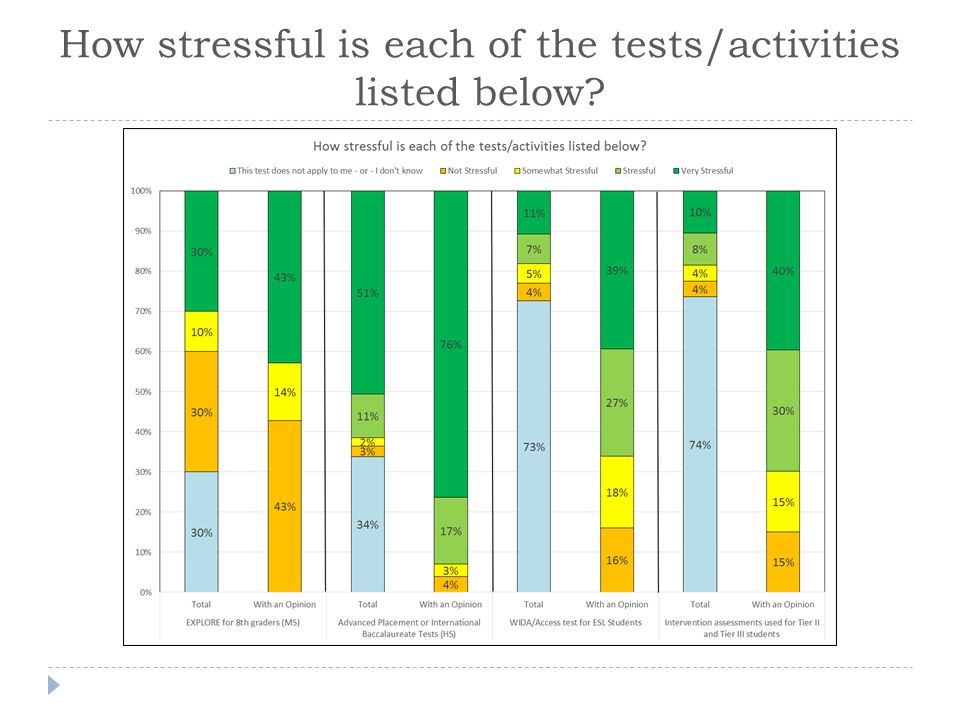
The stressfulness of tests or activities (HS) = High School only, (MS) = Middle School Only
 = High School only, (MS) = Middle School Only")
11
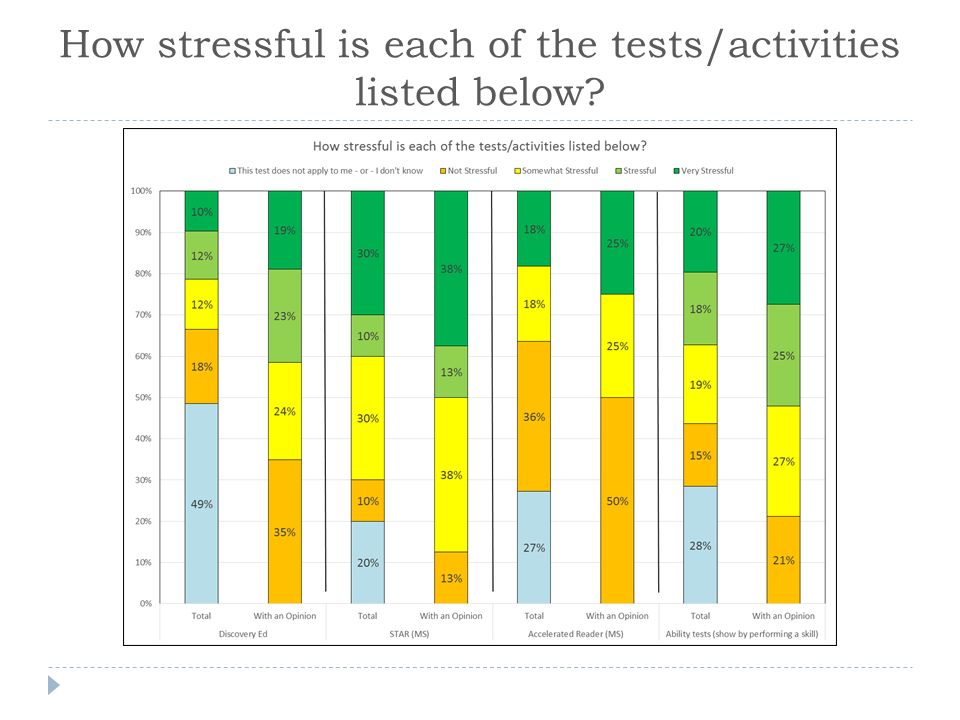
How stressful is each of the tests/activities listed below?

16
The helpfulness of tests or activities in understanding learning (HS) = High School only, (MS) = Middle School Only
 = High School only, (MS) = Middle School Only")
17
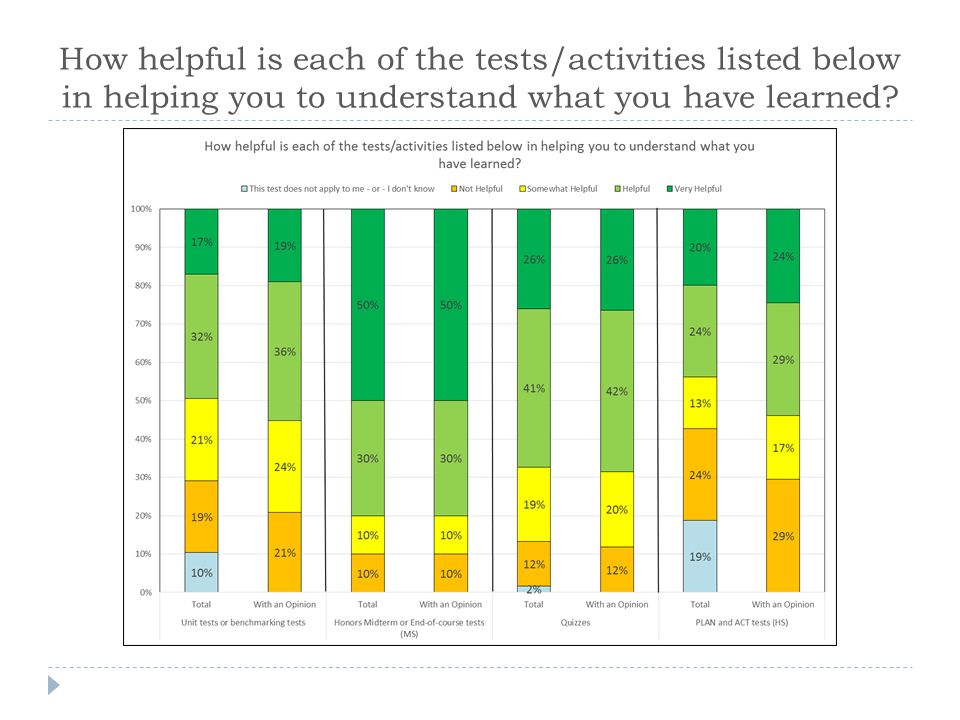
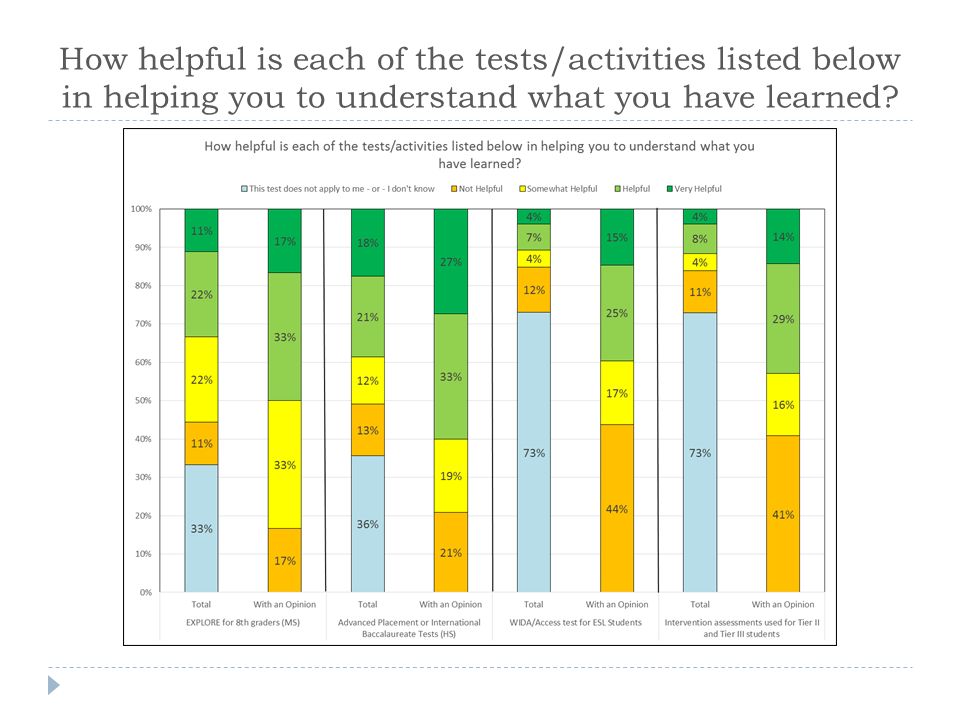
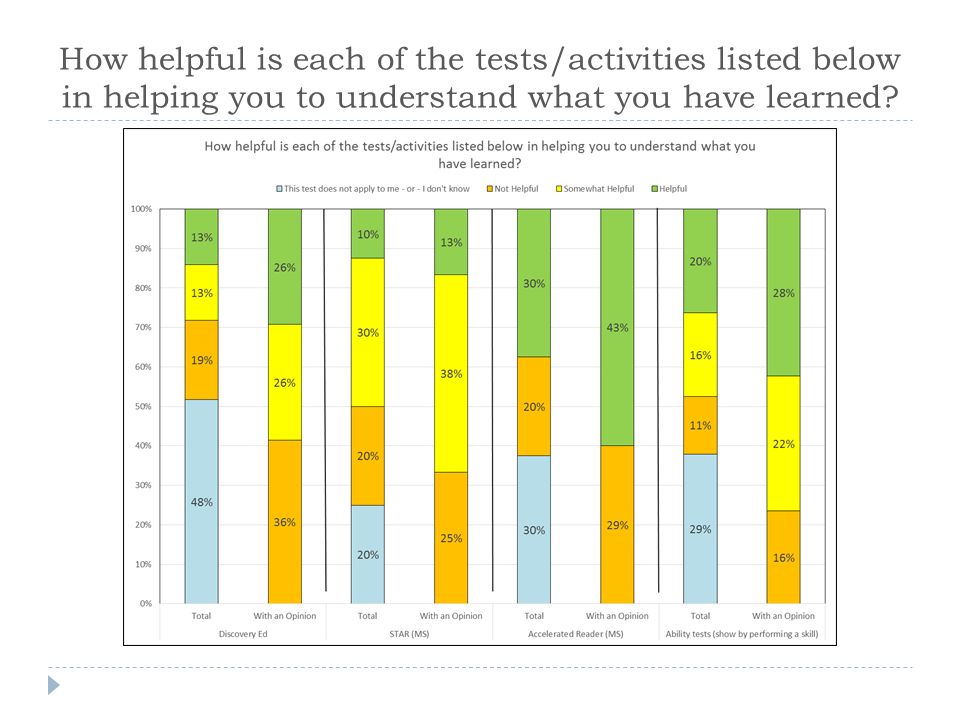
How helpful is each of the tests/activities listed below in helping you to understand what you have learned?

22
Hours spent doing homework or studying for tests per week By Student Grade

23
During an average school year, please estimate the number of hours that you personally spend preparing for or taking state- mandated TCAP and EOC tests only.

25
On average, how many hours do you spend per week...

26
Levels of Agreement with Statements

27
Please indicate your level of agreement with the statements below.

28
Information regarding test performance shared with family

29
How is information regarding your performance on tests shared with you or your family?

Similar presentations


 Community College Faculty Survey of Student Engagement 2005 Findings Presenter: LaSylvia Pugh – September 14, 2006.>")


>")


 Calculate the weighted mean. 2) Estimate the mean for grouped.>")
