Download presentation
Presentation is loading. Please wait.

1
TEXAS EARLY CHILDHOOD EDUCATION NEEDS ASSESSMENT FINAL REPORT Findings and Policy Implications October 29, 2012

2
Project Partners Ray Marshall Center for the Study of Human Resources LBJ School of Public Affairs University of Texas at Austin Hobby Center for the Study of Texas Rice University

3
Understand and estimate the total number of children under age 13 and those eligible for early childhood education programs Objective 1:

4
Data Sources U.S. Census Data, 2000 and 2010 Population of Texas children ages 0-12 Texas Department of Health Birth and death rates American Community Survey, 2006-2010 Socioeconomic characteristics of households

5
Types of Results Change in 0-12 population, 2000-2010 Child population projections to 2015 and 2040 Socioeconomic characteristics of households with children 0-12 in 2010 and projected to 2015 All results presented for: Entire state Councils of Governments Metropolitan Areas Counties

6
Key Population Findings Nearly 5 million Texas children ages 0-12 in 2010 Texas child population increased by 17% from 2000 to 2010 and accounted for over 50% of total US growth Growth expected to slow from 2010 to 2015 but still larger than growth in any other state over past 10 years Growth concentrated within metro areas and dominated by minorities Hispanic children were 49% of total in 2010 and projected to make up 65% of growth to 2015 1.2 million children (24.9%) were living in poverty in 2010; 1.3 million (25.4%) projected to do so in 2015
 were living in poverty in 2010; 1.3 million (25.4%) projected to do so in 2015")
7
Historical Population Change

8
Growth of Number of Children Ages 0-12, 2000-2010

9
Ten States with the Largest Early Childhood and School Age Population in 2010 Population Ages 0 - 12 Change 2000-2010 Percent of U.S. Growth Percent of U.S. Population Ages 0 - 12 State20002010 NumericPercent 2000-2010 20002010 United States52,190,29453,566,892 1,376,5982.6 100.0 California6,794,5236,569,785 -224,738-3.3 --- 13.012.3 Texas4,263,1034,995,269 732,16617.2 53.2 8.29.3 New York3,406,6913,037,396 -369,295-10.8 --- 6.55.7 Florida2,620,7992,829,250 208,4518.0 15.1 5.05.3 Illinois2,358,1102,219,602 -138,508-5.9 --- 4.54.1 Pennsylvania2,078,0951,952,911 -125,184-6.0 --- 4.03.6 Ohio2,071,3451,933,322 -138,023-6.7 --- 4.03.6 Georgia1,582,4491,800,092 217,64313.8 15.8 3.03.4 North Carolina1,440,3851,651,480 211,09514.7 15.3 2.83.1 Michigan1,871,7731,636,202 -235,571-12.6 --- 3.63.1 Source: U.S. Census 2000 and 2010, Summary File 1 --- indicates negative percent’s because of decline in early childhood and school age populations.

10
Ten States with the Largest Percentage Change in the Early Childhood and School Age Population, 2000-2010 Population Ages 0 - 12 Change 2000-2010 Percent of U.S. Growth Percent of U.S. Population Ages 0 - 12 State20002010 NumericPercent 2000-2010 20002010 United States52,190,29453,566,892 1,376,5982.6 100.0 Utah517,577653,618 136,04126.3 9.9 1.01.2 Nevada380,714480,368 99,65426.2 7.2 0.70.9 Idaho261,027313,731 52,70420.2 3.8 0.50.6 Arizona1,003,0401,180,034 176,99417.6 12.9 1.92.2 Texas4,263,1034,995,269 732,16617.2 53.2 8.29.3 North Carolina1,440,3851,651,480 211,09514.7 15.3 2.83.1 Georgia1,582,4491,800,092 217,64313.8 15.8 3.03.4 Wyoming87,40099,234 11,83413.5 0.9 0.2 Colorado793,579894,187 100,60812.7 7.3 1.51.7 Florida2,620,7992,829,250 208,4518.0 15.1 5.05.3 Source: U.S. Census 2000 and 2010, Summary File 1

11
Percent Change in Child Population, Ages 0-12 2000-2010

12
Ten Counties with the Largest Projected Early Childhood and School Age Population in 2015 and Numeric and Percent Change in that Population, 2000-2010, and 2010-2015 Population Ages 0 - 12Change 2000-2010 Projected Change 2010-2015 County 2000 2010 2015 NumericPercent Numeric Percent 1Harris725,248842,917891,961117,66916.249,0445.8 2Dallas458,533481,468501,97422,9355.020,5064.3 3Tarrant298,712371,121393,73472,40924.222,6136.1 4Bexar287,459337,913353,10550,45417.615,1924.5 5Travis143,582185,011210,12041,42928.925,10913.6 6Hidalgo148,944196,524206,30547,58031.99,7815.0 7Collin106,893164,342175,80257,44953.711,4607.0 8El Paso157,438170,952173,39213,5148.62,4401.4 9Denton89,388134,053145,94844,66550.011,8958.9 10Fort Bend79,738123,283137,40443,54554.614,12111.5 Source: U.S. Census 2000 and 2010 S.F. 1, 2015 Preliminary Projections

13
Early Childhood and School Age Population in Texas by Race/Ethnicity in 2000 and 2010, and Numeric and Percent Change, 2000-2010 PopulationPopulation ChangePercent of Total Population Race/Ethnicity*20002010NumericPercent Percent of Total Change 20002010 NH White1,767,7301,646,728-121,002-6.8-16.5 41.5 33.0 Hispanic (All Races)1,773,6142,463,635690,02138.994.2 41.6 49.3 NH Black528,276573,57645,3008.66.2 12.4 11.5 NH Asian & Others193,483311,330117,84760.916.1 4.5 6.2 Total4,263,1034,995,269732,16617.2 100.0 *Hispanic includes persons of all races. All other race/ethnicity categories shown here are Non-Hispanic. Non-Hispanic Other includes persons identifying themselves as Non-Hispanic American Indian or Alaska Native, Non-Hispanic Native Hawaiian or Pacific Islander, Non- Hispanic Some Other Race, or Non-Hispanic and a combination of two or more races. Source: U.S. Census 2000 and 2010, P.L. 94-171.

14
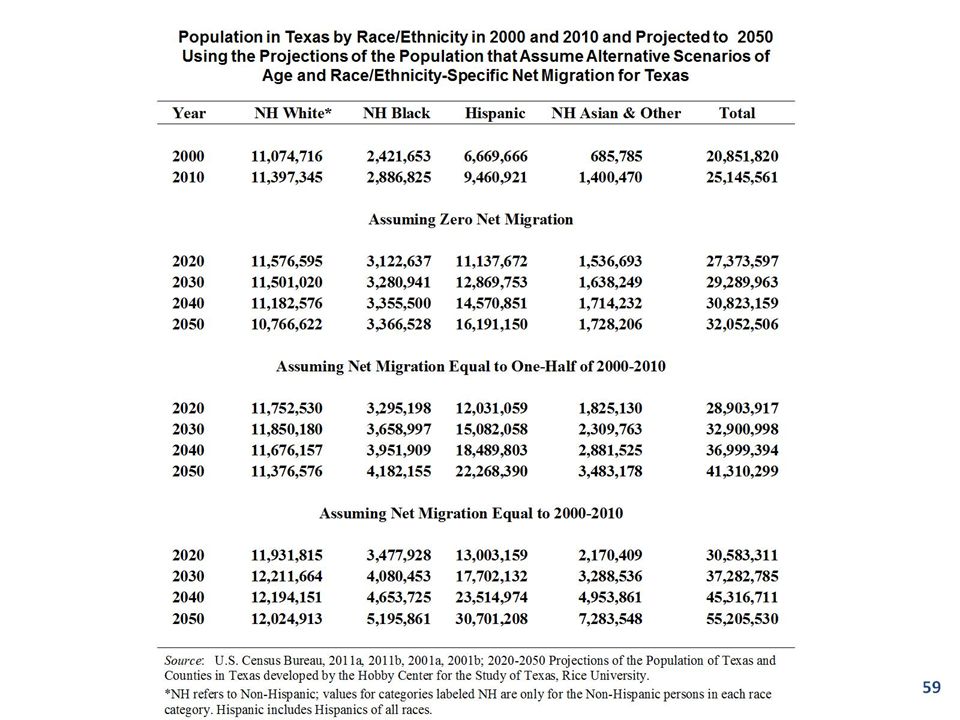
Population Projections

17
Population Distribution for Ages 0-12, 2010 0-2 years old 3-4 years old 5-12 years old Total 1,151,310777,1633,066,7964,995,269

18
Population Distribution for Ages 0-12, 2040 0-2 years old 3-4 years old 5-12 years old Total 1,932,2291,251,2984,864,0238,047,550

19
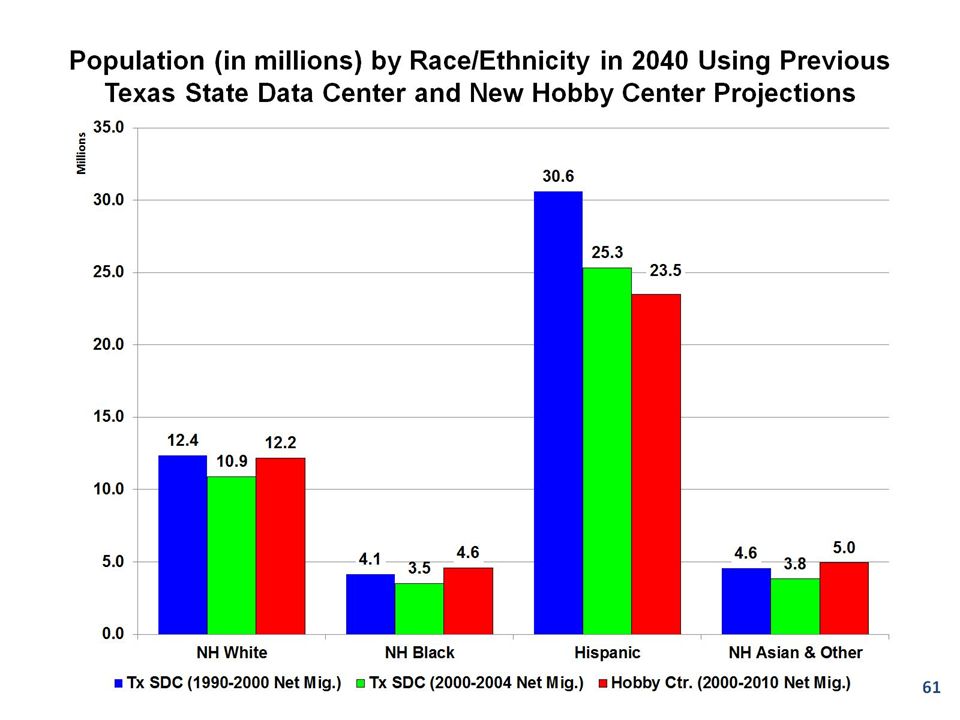
Composition of the Early Childhood Population (Age 0-12) in Texas
 in Texas")
20
Early Childhood and School Age Population in Texas by Race/Ethnicity in 2010 and Projected for 2015, and Numeric and Percent Change, 2010-2015 PopulationPopulation ChangePercent of Total Population Race/Ethnicity*20102015NumericPercent Percent of Total Change 20102015 NH White1,646,7281,683,69536,9672.212.2 33.0 31.8 Hispanic (All Races)2,463,6352,661,241197,6068.065.2 49.3 50.2 NH Black573,576595,07221,4963.77.1 11.5 11.2 NH Asian & Others311,330358,33347,00315.115.5 6.2 6.8 Total4,995,2695,298,341303,0726.1 100.0 *Hispanic includes persons of all races. All other race/ethnicity categories shown here are Non-Hispanic. Non-Hispanic Other includes persons identifying themselves as Non-Hispanic American Indian or Alaska Native, Non-Hispanic Native Hawaiian or Pacific Islander, Non- Hispanic Some Other Race, or Non-Hispanic and a combination of two or more races. Source: U.S. Census 2010, P.L. 94-171 and Hobby Center for the Study of Texas Population Projections

22
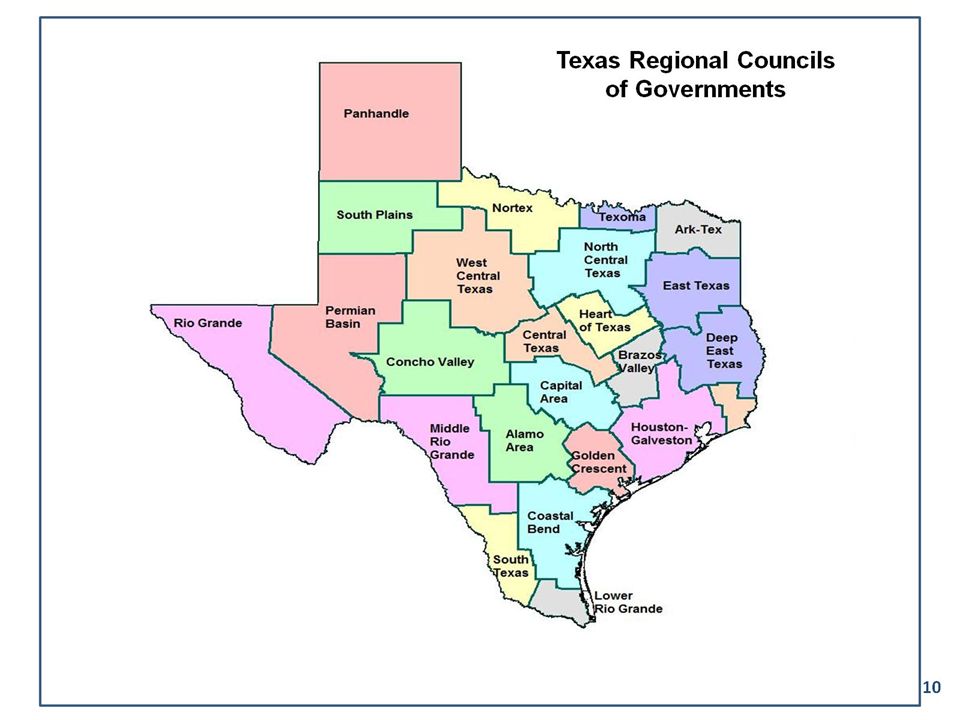
Councils of Governments Planning Regions

23
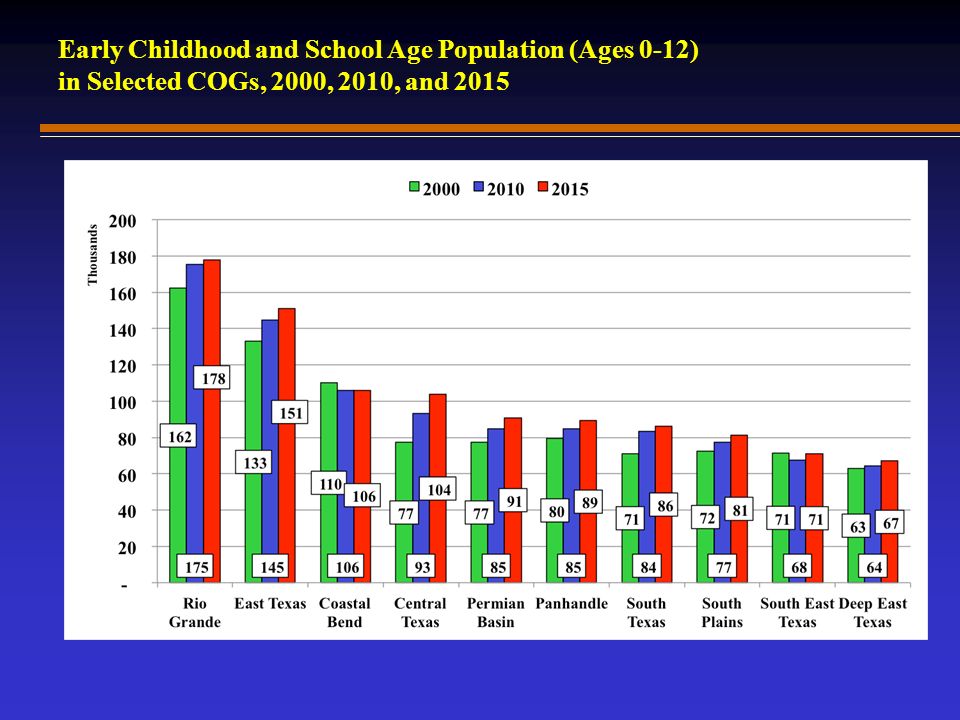
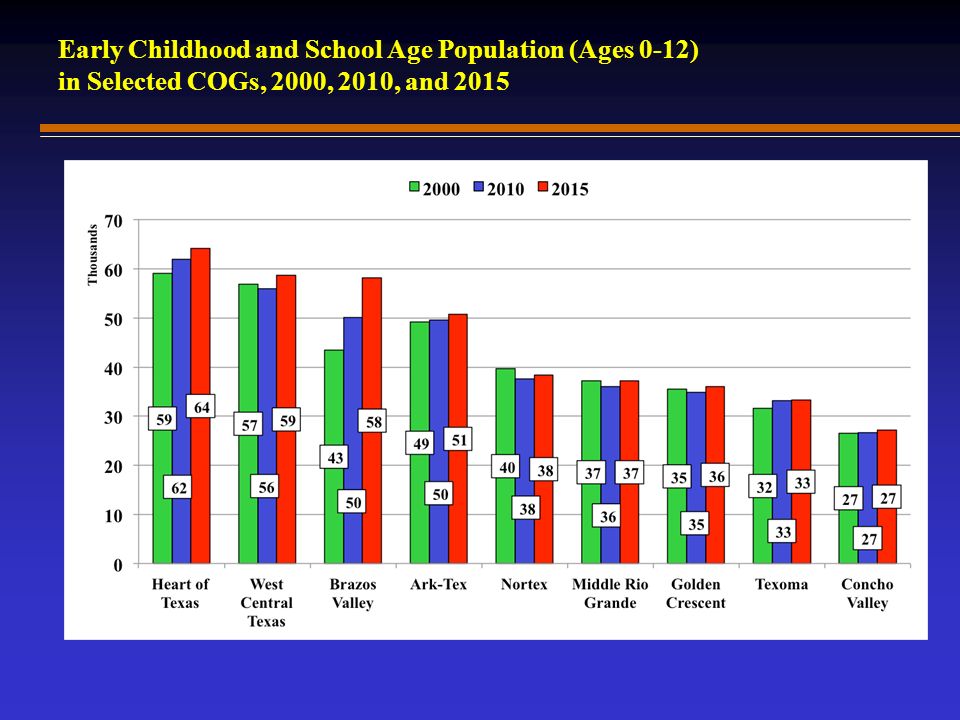
Early Childhood and School Age Population (Ages 0-12) in Selected COGs, 2000, 2010, and 2015
 in Selected COGs, 2000, 2010, and 2015")
26
Percent Change in Early Childhood Population for Councils of Governments Regions, 2000-2010 and 2010-2015

27
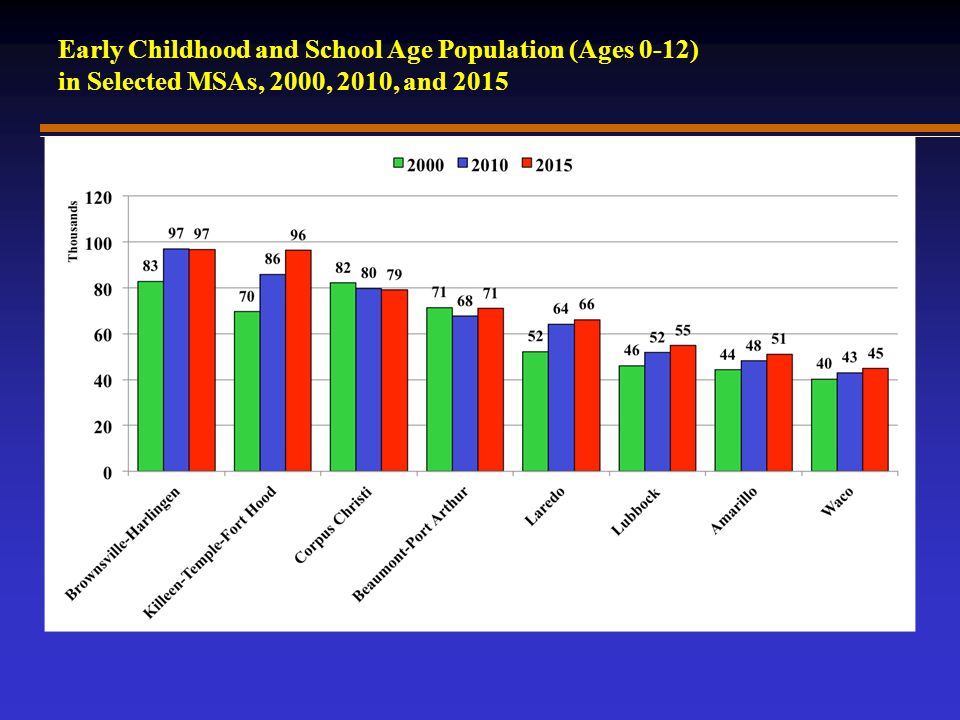
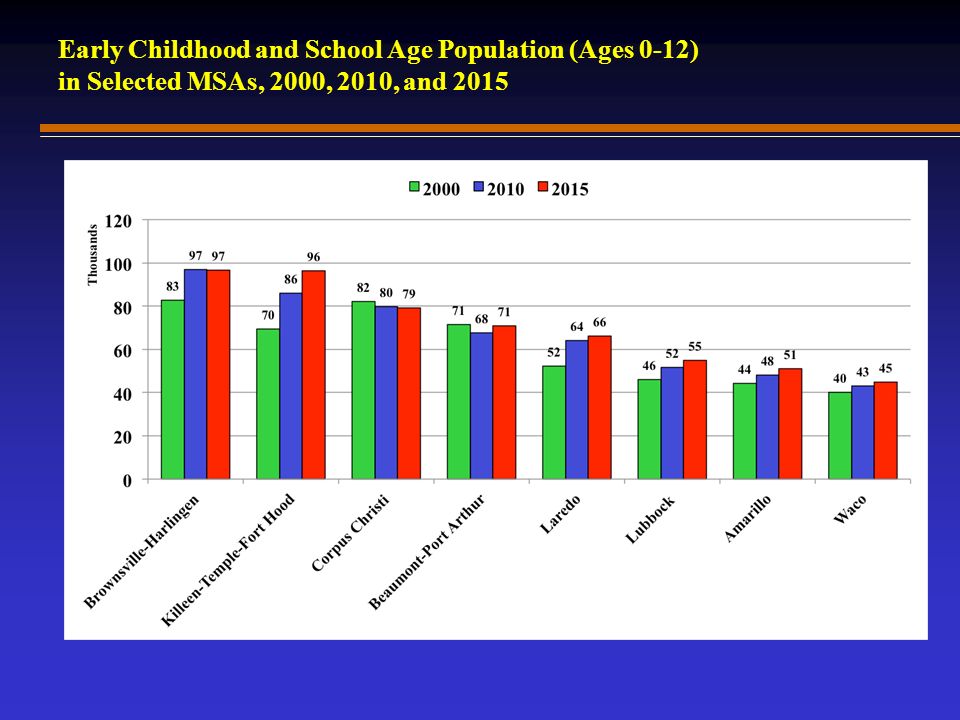
Early Childhood and School Age Population (Ages 0-12) in Selected MSAs, 2000, 2010, and 2015
 in Selected MSAs, 2000, 2010, and 2015")
30
Percent Change in Early Childhood Population for Metropolitan Statistical Areas in Texas, 2000-2010 and 2010-2015

31
Metropolitan Statistical Areas’ Shares of Total Statewide Change in the Early Childhood Population, 2000-2010 and 2010-2015

32
Ten Counties with the Largest Projected Early Childhood and School Age Population in 2015 and Numeric and Percent Change in that Population, 2000-2010, and 2010-2015 Population Ages 0 - 12Change 2000-2010 Projected Change 2010-2015 County 2000 2010 2015 NumericPercent Numeric Percent 1Harris725,248842,917891,961117,66916.249,0445.8 2Dallas458,533481,468501,97422,9355.020,5064.3 3Tarrant298,712371,121393,73472,40924.222,6136.1 4Bexar287,459337,913353,10550,45417.615,1924.5 5Travis143,582185,011210,12041,42928.925,10913.6 6Hidalgo148,944196,524206,30547,58031.99,7815.0 7Collin106,893164,342175,80257,44953.711,4607.0 8El Paso157,438170,952173,39213,5148.62,4401.4 9Denton89,388134,053145,94844,66550.011,8958.9 10Fort Bend79,738123,283137,40443,54554.614,12111.5 Source: U.S. Census 2000 and 2010 S.F. 1, 2015 Preliminary Projections

33
Percent Change in the Early Childhood and School Age Population, 2010-2015

34
Ten Counties with the Largest Projected Numeric Change in the Early Childhood and School Age Population in 2015 and Numeric and Percent Change in that Population, 2000-2010 and 2010-2015 Population Ages 0 - 12 Change 2000-2010 Projected Change 2010-2015 County 200020102015 NumericPercent NumericPercent 1Harris725,248842,917891,961 117,66916.2 49,0445.8 2Travis143,582185,011210,120 41,42928.9 25,10913.6 3Tarrant298,712371,121393,734 72,40924.2 22,6136.1 4Dallas458,533481,468501,974 22,9355.0 20,5064.3 5Bexar287,459337,913353,105 50,45417.6 15,1924.5 6Fort Bend79,738123,283137,404 43,54554.6 14,12111.5 7Denton89,388134,053145,948 44,66550.0 11,8958.9 8Williamson55,15989,820101,488 34,66162.8 11,66813.0 9Collin106,893164,342175,802 57,44953.7 11,4607.0 10Montgomery62,19290,371101,130 28,17945.3 10,75911.9 Source: U.S. Census 2000 and 2010 S.F. 1, 2015 Preliminary Projections

35
Socioeconomic Characteristics

36
Living Arrangements of Children Ages 0-12 in Texas

37
Top 10 Counties with the Largest Projected 2015 Population Age 0-12 in Poverty

38
For Additional Information Deanna Schexnayder Ray Marshall Center for the Study of Human Resources Lyndon B. Johnson School of Public Affairs The University of Texas At Austin (512) 471-7891 dschex@raymarshallcenter.org
")
Similar presentations