Download presentation
Presentation is loading. Please wait.

0
Material Flow Cost Accounting
(MFCA) March, 2013 Yoshikuni Furukawa Secretary of ISO/TC207 WG8 NITTO DENKO CORPORATION
 March, Yoshikuni Furukawa. Secretary of ISO/TC207 WG8. NITTO DENKO CORPORATION.")
1
Contents: 1. Introduction 2. Significance and Characteristics of
Material Flow Cost Accounting (MFCA) 3. MFCA vs. Conventional Cost Accounting 4. Implementation & Case Example of Nitto Denko 5. Implementation & Key Factor for Success
 3. MFCA vs. Conventional Cost Accounting. 4. Implementation & Case Example of Nitto Denko. 5. Implementation & Key Factor for Success.")
2
Introduction

3
Significance of Material Flow Cost Accounting
MFCA focuses on emission (waste) Profit is hidden in emission (waste) MFCA finds out the hidden profit INR MFCA Significance of Material Flow Cost Accounting Japanese “Mottainai” Concept, “What a shame to be wasteful” in ISO
 Profit is hidden in emission (waste) MFCA finds out the hidden profit. INR. MFCA. Significance of Material Flow Cost Accounting. Japanese Mottainai Concept, What a shame to be wasteful in ISO.")
4
Contributing to sustainable development
Benefits of MFCA Increasing profit Improving productivity Internal benefits External benefits Reducing environmental impacts Contributing to sustainable development

5
Conventional Cost Accounting

6
Characteristics of MFCA

7
MFCA vs. Conventional Cost Accounting

8
Implementation of MFCA
Cost Elements 1. Material: Input Value of Material 2. Energy: Input Value of Energy 3. System: Labor, Depreciation and etc., 4. Disposal (Waste Management Cost):
:")
9
Material Flow Cost Accounting (Flow Model)
")
10
“Material” Flow Chart with Data
Top: Adhesive(Red) Middle: Backing Film(Blue) Bottom: Separator(Green) Product: Adhesive Tapes for Electronics Application Quantity: 912pcs. Period: one month (Nov , 2000), (JPY1.80/INR ) Flow to Product Flow to Waste 29% 68% 3% Waste: 103.14㎏ 7,299.10㎡ 10,785.50㎡ Waste: ¥21,852.79 ¥384,163.18 ¥497,792.32 <Total Waste> Waste: 86.27㎏ 430.35㎡ 2,642.25㎡ Waste: ¥13,357.00 ¥22,,650.00 ¥121,950.00 Solvent Gases 1,981.29㎏ Solvent Gases ¥99,064.50 Waste: 289.41㎏ 7,729.45㎡ 13,427.75㎡ Waste: ¥35,209.79 ¥406,813.18 ¥619,742.32 (¥1,061,765.29) 351.01㎏ 24,840.60㎡ 28,327.00㎡ ¥74,370.26 ¥1,307,400.00 Slitting etc., ¥65,009.62 ¥1,142,850.00 ¥1,142,850.00 306.83㎏ 21,714.15㎡ 24,761.75㎡ Coating & Drying SI: 127.58㎏ 9,028.80㎡ 10,296.00㎡ EI: 83.40㎏ 5,902.35㎡ 6,730.75㎡ SI: ¥27,031.58 ¥475,200.00 EI: ¥17,670.94 ¥310,650.00 Store 247.87㎏ 17,541.50㎡ 17,541.50㎡ ¥52,517.47 ¥923,236.82 ¥809,607.68 Core etc¥714,582.22 (¥2,499,944.19) Product 2,474.39㎏ 22,144.50㎡ 27,404.00㎡ ¥177,431.12 ¥1,165,500.00 ¥1,264,800.00 Dissolution etc., Solvent Gases 1,981.29㎏ Solvent Gases ¥99,064.50
 Middle: Backing Film(Blue) Bottom: Separator(Green) Product: Adhesive Tapes for Electronics Application. Quantity: 912pcs. Period: one month (Nov , 2000), (JPY1.80/INR ) Flow to Product. Flow to Waste. 29% 68% 3% Waste: ㎏ 7,299.10㎡ 10,785.50㎡ Waste: ¥21, ¥384, ¥497, <Total Waste> Waste: 86.27㎏ ㎡ 2,642.25㎡ Waste: ¥13, ¥22,, ¥121, Solvent Gases 1,981.29㎏ Solvent Gases ¥99, Waste: ㎏ 7,729.45㎡ 13,427.75㎡ Waste: ¥35, ¥406, ¥619, (¥1,061,765.29) ㎏ 24,840.60㎡ 28,327.00㎡ ¥74, ¥1,307, Slitting etc., ¥65, ¥1,142, ¥1,142, ㎏ 21,714.15㎡ 24,761.75㎡ Coating & Drying. SI: ㎏ 9,028.80㎡ 10,296.00㎡ EI: 83.40㎏ 5,902.35㎡ 6,730.75㎡ SI: ¥27, ¥475, EI: ¥17, ¥310, Store ㎏ 17,541.50㎡ 17,541.50㎡ ¥52, ¥923, ¥809, Core etc¥714, (¥2,499,944.19) Product. 2,474.39㎏ 22,144.50㎡ 27,404.00㎡ ¥177, ¥1,165, ¥1,264, Dissolution etc., Solvent Gases 1,981.29㎏ Solvent Gases ¥99,")
11
Allocation Method of “Energy and System Cost”
Cost Elements Allocation Base Allocation Type Energy (electricity) Consumption B Energy (fuel) Consumption B Labor (legular employee) Man-hour A Labor (part-timer) Man-hour A Depreciation (straight-line method) Operating time B Maintenances Expenditure C Tools and Implements Expenditure C A : Allocation on base of real data B : Allocation on base of monthly data (correctly as possible) C : Apportionment on base of monthly data
 Consumption. B. Energy (fuel) Consumption. B. Labor (legular employee) Man-hour. A. Labor (part-timer) Man-hour. A. Depreciation. (straight-line method) Operating time. B. Maintenances. Expenditure. C. Tools and Implements. Expenditure. C. A : Allocation on base of real data. B : Allocation on base of monthly data (correctly as possible) C : Apportionment on base of monthly data.")
12
Result of Material Flow Cost Accounting
Period: from November 01 to 30, (Unit: JPY ), (JPY1.80/INR ) Cost Material Energy System Disposal Total Product 2,499,944 (68.29%) 57,354 480,200 N/A 3,037,498 (67.17%) Material loss 1,160,830 (31.71%) 26,632 222,978 74,030 (100%) 1,484,470 (32.83%) 3,660,774 83,986 703,178 4,521,968 912pcs (100%)
, (JPY1.80/INR ) Cost. Material. Energy. System. Disposal. Total. Product. 2,499,944. (68.29%) 57, ,200. N/A. 3,037,498. (67.17%) Material loss. 1,160,830. (31.71%) 26, , ,030. (100%) 1,484,470. (32.83%) 3,660, , ,178. 4,521, pcs (100%)")
13
Material Flow P/L (Unit: Yen) Conventional P/L (Unit: Yen)
Comparison of P/L Period: from November 01 to 30, 2000 (Unit: JPY) , (JPY1.80/INR) Material Flow P/L (Unit: Yen) Conventional P/L (Unit: Yen) Sales* 15,000,000 Cost of Product 3,037,498 Cost of Sales 4,521,968 Material loss 1,484,470 N/A Gross Profit 10,478,032 Selling, General and Administrative Expenses* 8,000,000 Operating Profit 2,478,032 *Provisional Figure
 , (JPY1.80/INR) Material Flow P/L (Unit: Yen) Conventional P/L (Unit: Yen) Sales* 15,000,000. Cost of. Product. 3,037,498. Cost of Sales. 4,521,968. Material loss. 1,484,470. N/A. Gross Profit. 10,478,032. Selling, General and Administrative Expenses* 8,000,000. Operating Profit. 2,478,032. *Provisional Figure.")
14
Decision Making Flow (1)
Input value of Material Loss and input value of Product are clarified in each Quantity Center. The Material Loss Analysis in each Production Process Implemented Countermeasure to reduce Material loss Increase of profit and reduction of environmental impact

15
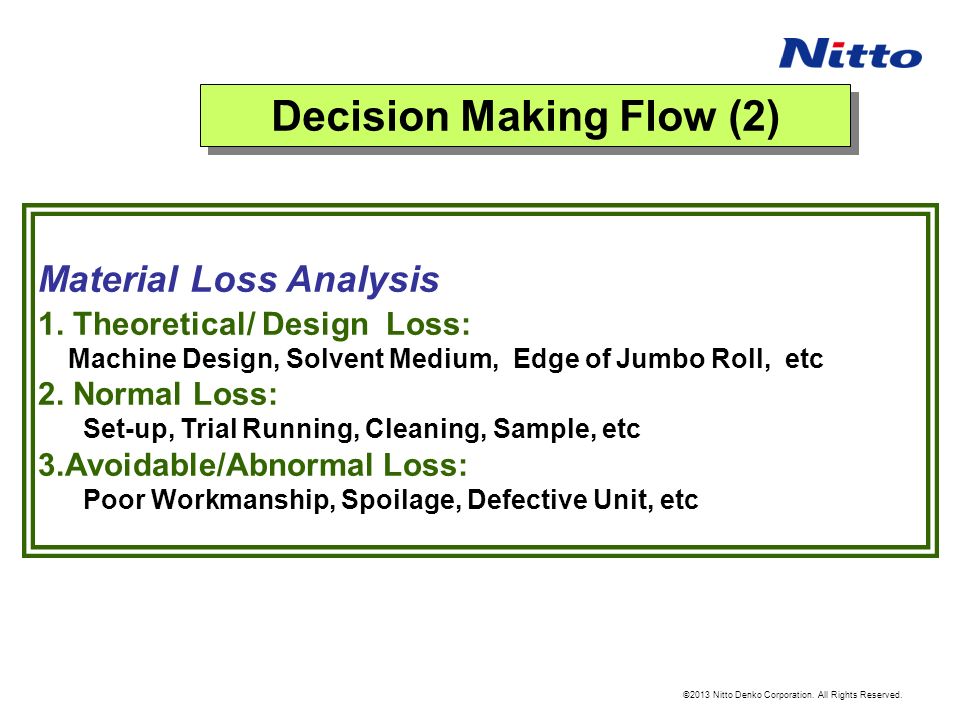
Decision Making Flow (2)
Material Loss Analysis 1. Theoretical/ Design Loss: Machine Design, Solvent Medium, Edge of Jumbo Roll, etc 2. Normal Loss: Set-up, Trial Running, Cleaning, Sample, etc 3.Avoidable/Abnormal Loss: Poor Workmanship, Spoilage, Defective Unit, etc

17
Recovery, Refinement, Deodorizing Furnace
The cause of losses need to be examined from a perspective of supply chain. It is important to trace upstream the cause of losses (e.g. Upper processes, Materials, suppliers) Recovery, Refinement, Deodorizing Furnace Suppliers ③ Solvent Gases (100%) Two of materials (Unit: Width x Length) Backing Films: 570mm width (2) Separator: 650mm width Four of materials (Unit: Kg) -Solvent -Monomer -Crosslinker A -Crosslinker B Gas emissions Auxiliary materials Packaging materials Energy Steam, Thermal (2) Electric power Two of materials (Unit: Kg) Solvent, Polymer One of material: Plastic core (Unit: Piece) Energy: Electric power ¥172,900.70 ¥541,681.52 Materials Manufacturing Division ② ① ¥1,307,400.00 ¥74,370.26 ¥923,236.82 ¥809,607.68 ¥52,517.47 ¥104,494.22 ¥72,936.90 Dissolution Batch Blend Coating & Drying Store Slitting Inspection & Packing Warehouse Upper quantity center Finished Products(912 rolls) Backing film: ¥923,236.82 Separator: ¥809,607.68 Adhesive: ¥52,517.47 Plastic core: ¥541,681.52 Packaging materials:¥172,900.70 Total ¥2,499,944.19 Two of materials (Unit: Kg) Solvent, Polymer Adhesive Mass (Unit: Kg) Each size of product (Width x Length) Finished Product: Adhesive tapes for Electronics Application Quantity: 912 rolls Waste Waste Waste ¥22,650.00 ¥121,950.00 ¥384,163.18 ¥497,792.32 ¥21,852.79 The cause of losses does not always lie in the quantity center where they occurred ¥13,357.00 Energy cost: \83,986 (Dissolution, Batch blend, Coating & Drying, Slitting & Inspection and Packaging) Waste: Backing film: ¥22,650 Separator: ¥121,950 Adhesive: ¥13,357 Waste: out of Jumbo Roll Backing film: ¥384,163.18 Separator: ¥497,792.32 Adhesive: ¥21,852.79
 Recovery, Refinement, Deodorizing Furnace. Suppliers. ③. Solvent Gases. (100%) Two of materials. (Unit: Width x Length) Backing Films: 570mm width. (2) Separator: 650mm width. Four of materials. (Unit: Kg) -Solvent. -Monomer. -Crosslinker A. -Crosslinker B. Gas emissions. Auxiliary materials. Packaging materials. Energy. Steam, Thermal. (2) Electric power. Two of. materials (Unit: Kg) Solvent, Polymer. One of material: Plastic core (Unit: Piece) Energy: Electric power. ¥172, ¥541, Materials. Manufacturing. Division. ②. ①. ¥1,307, ¥74, ¥923, ¥809, ¥52, ¥104, ¥72, Dissolution. Batch Blend. Coating & Drying. Store. Slitting. Inspection & Packing. Warehouse. Upper quantity center. Finished Products(912 rolls) Backing film: ¥923, Separator: ¥809, Adhesive: ¥52, Plastic core: ¥541, Packaging materials:¥172, Total ¥2,499, Two of materials (Unit: Kg) Solvent, Polymer. Adhesive Mass (Unit: Kg) Each size of product. (Width x Length) Finished Product: Adhesive tapes for Electronics Application. Quantity: 912 rolls. Waste. Waste. Waste. ¥22, ¥121, ¥384, ¥497, ¥21, The cause of losses does not always lie in the quantity center where they occurred. ¥13, Energy cost: \83,986. (Dissolution, Batch blend, Coating & Drying, Slitting & Inspection and Packaging) Waste: Backing film: ¥22,650. Separator: ¥121,950. Adhesive: ¥13,357. Waste: out of Jumbo Roll. Backing film: ¥384, Separator: ¥497, Adhesive: ¥21,")
18
Headline of major Japanese Newspaper:
Nitto Denko and MFCA Invested ”seven hundred million JPY”, based on MFCA Reducing Costs Firstly in Japan (Note:JPY1.80/INR)
")
19
What is ignored in Conventional Cost Accounting
Cost of finished product Cost of waste Theoretical Design loss Avoidable/ abnormal loss Normal The scope of improvement target in standard costing The scope of improvement target in MFCA Ignored Standard cost (including allowable losses) Cost of finished product
 Cost of finished product.")
20
Mass Balance vs. Yield Ratio

21
MFCA and PDCA Cycle Repeat this cycle Determine the applicable product
and boundary Establish quantity centers Set up the material flow model Decide data collection methods Determine allocation methods of energy and system cost Collect material flow data Make the flow cost matrix Analyze material flow data (loss analysis and process analysis) Plan measures to solve problems Implement measures planned Cost reduction and lowered environmental impacts Repeat this cycle
 Plan measures to solve problems. Implement measures planned. Cost reduction and lowered. environmental impacts. Repeat. this cycle.")
22
Improvement 67% 78% 93% 33% 22% 7% Total 100% Cost 2001 2004 2012
(Latest) Product 67% 78% 93% Material Loss 33% 22% 7% Total 100%
 Product. 67% 78% 93% Material. Loss. 33% 22% 7% Total. 100%")
23
Example of Key Factor for Success(1)
Number of the established quantity center Cost (man-hours) and degree of the accuracy of data High low small large Cost Degree of the accuracy of data Reasonable level
 and. degree of the accuracy of data. High. low. small. large. Cost. Degree of the accuracy of data. Reasonable level.")
24
Example of Key Factor for Success (2)
Priority of Countermeasure: 1. Avoidable/Abnormal Loss: Poor Workmanship, Spoilage, Defective Unit , etc 2. Normal Loss: Set-up, Trial Running, Cleaning, (Sample), etc 3. Theoretical/ Design Loss:
, etc. 3. Theoretical/ Design Loss:")
25
Environmental Impacts
External Benefits Environmental Impacts 1. Reduction of industrial waste 2. Reduction of CO2 emission

26
Improvement Unit: Ton CO2, one product only Cost 2001 2004 2011 Product 136.8 Material Loss 73.2 66.0 (-7.2) 58.8 (-14.4) Total 210.0 202.8 195.6
 (-14.4) Total")
27
Conclusion of MFCA 現行の会計システムを変えるものではない 製造工程単位に廃棄物原価(負の製品)を把握
産廃原価はレントゲン、マテリアルフローコスト会計はCTスキャン どの製造工程の改善に人とお金を投入すべきか 優先順位が明確になる 改善効果は「負の製品阻止額(新しい概念)」 現行の会計システムを変えるものではない Necessary information for implementation is often already in a site It enables companies to cut costs and reduce environmental impact simultaneously MFCA grasps the cost of material loss for each production process MFCA is like a CT scanner that provides clearer picture of manufacturing processes It helps to determine the priority of process improvement The improved performance will be made clear as “savings from curtailing material losses”
」 現行の会計システムを変えるものではない. Necessary information for implementation is often already in a site. It enables companies to cut costs and reduce environmental impact simultaneously. MFCA grasps the cost of material loss for each production process. MFCA is like a CT scanner that provides clearer picture of manufacturing processes. It helps to determine the priority of process improvement. The improved performance will be made clear as. savings from curtailing material losses")
Similar presentations
 GmbH Sustainability through Chemical Selection along Footwear and Apparel Value Chain Dr. Dieter Sedlak Modern Testing.>")


>")


 4 次の Matrix を使ったら収束の振る舞いが良くなった。ただし、もしかし たら初期値が良いせいかもしれない , のアクセプタンスに入っていない部分で収束が悪くなっている。 tuning 後の Matrix で 12LB のピークを再現してみると幅は太い(>")

 を用いてそれぞれ作りなさい.>")

>")


 シミュレーション結果の数値などの目 に見えない情報を、人間の把握しやす い図形やイメージなどの形式に変換し て出力すること。 ショートレポート シミュレーション結果の可視化の例を 一つ挙げ、その役割について簡単に述 べよ。>")