Download presentation
Presentation is loading. Please wait.

1
Vulnerability of US Non-Irrigated Commodity Crops to Extremes of Weather and Climate Eugene S. Takle Professor Department of Agronomy Department of Geological and Atmospheric Science Director, Climate Science Program Iowa State University Ames, IA 50011 US CLIVAR/NCAR ASP Researcher Colloquium Statistical Assessment of Extreme Weather Phenomena under Climate Change NCAR Foothills Lab, Boulder, Colorado, USA June 13-17, 2011

2
Provocative thoughts If it weren’t for farmers we would all be hunter- gatherers

3
Provocative thoughts If it weren’t for farmers we would all be hunter- gatherers Farmers allow the rest of us time to sit around and think about statistics and climate change

4
Provocative thoughts If it weren’t for farmers we would all be hunter- gatherers Farmers allow the rest of us time to sit around and think about statistics and climate change Maybe we should help farmers do their job better (or at least as well as in the past)
")
5
Provocative thoughts cont’d No civilization that depended on irrigation for its food supply has survived.

6
Provocative thoughts cont’d No civilization that depended on irrigation for its food supply has survived. It is our self-interest to assess the impact of climate extremes on rainfed agriculture

7
Overview Rainfed agriculture; commodity crops of the Midwest Production and impacts of technology and weather/climate on trends Climate extremes Climate conditions leading to changes from “expected yields” Recent climate changes and farmer adaptations Farmer weather-related decision calendar

8
Suitability Index for Rainfed Agriculture IPCC 2007

9
Suitability Index for Rainfed Agriculture IPCC 2007

10
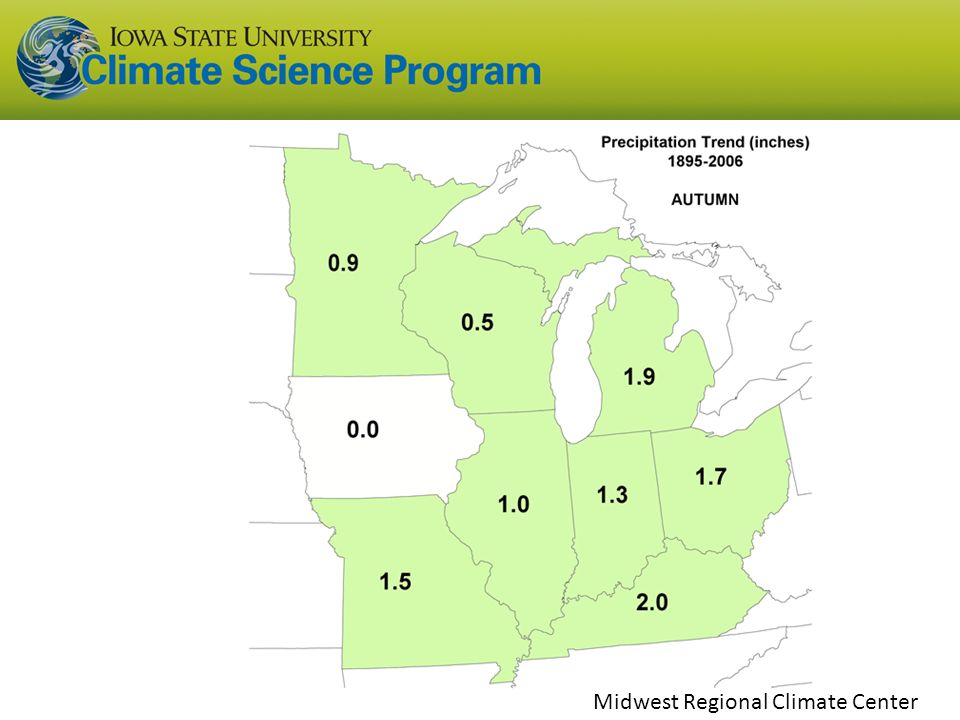
US Precipitation climatology Corn and Soybean Wheat

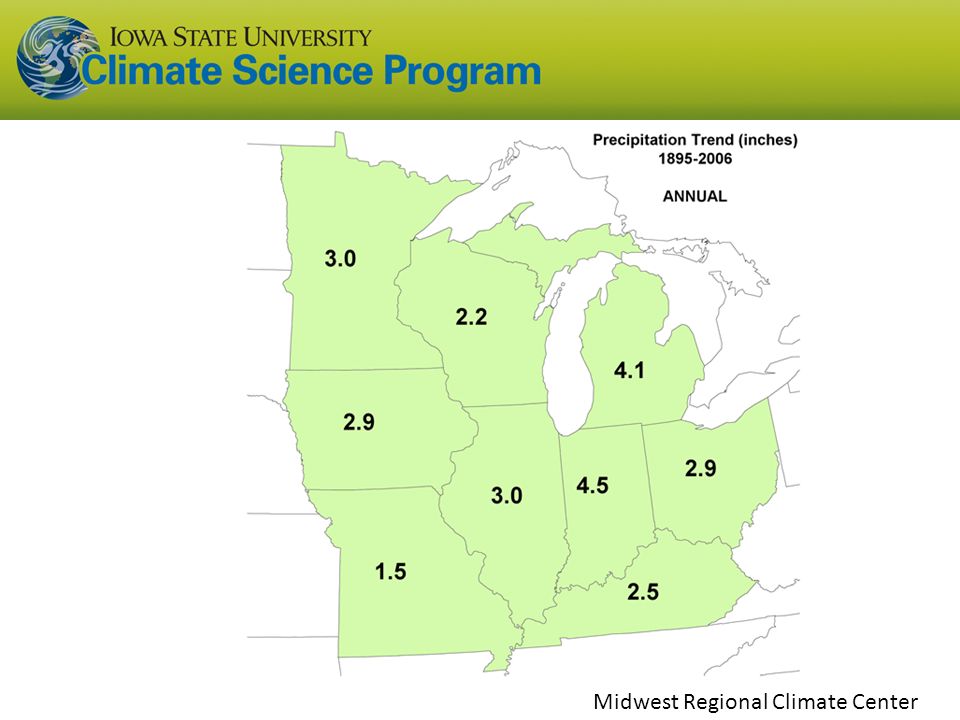
11
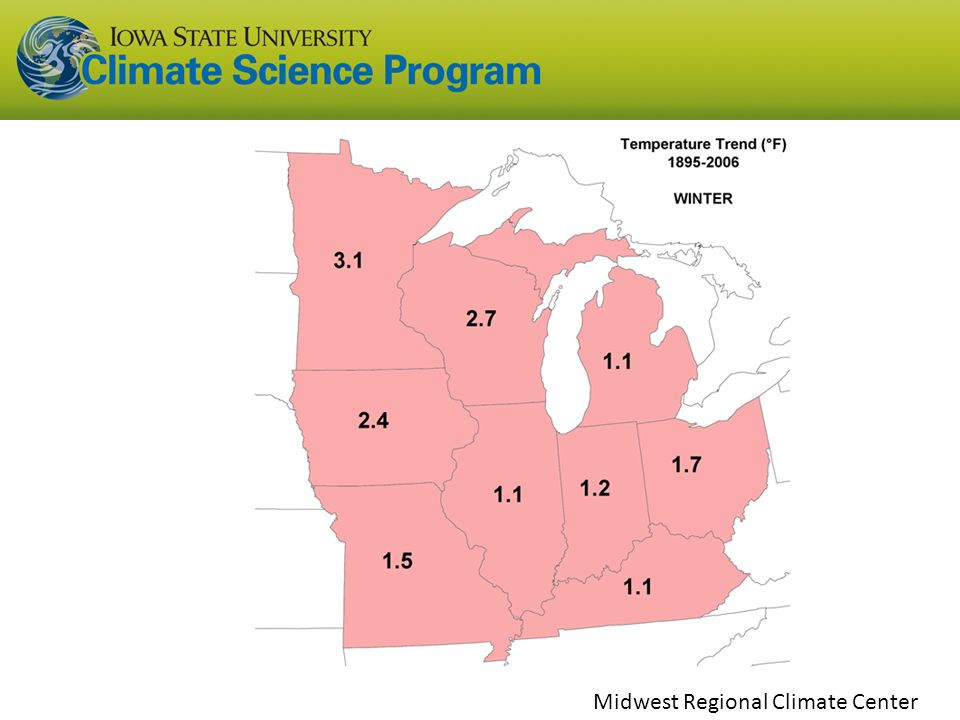
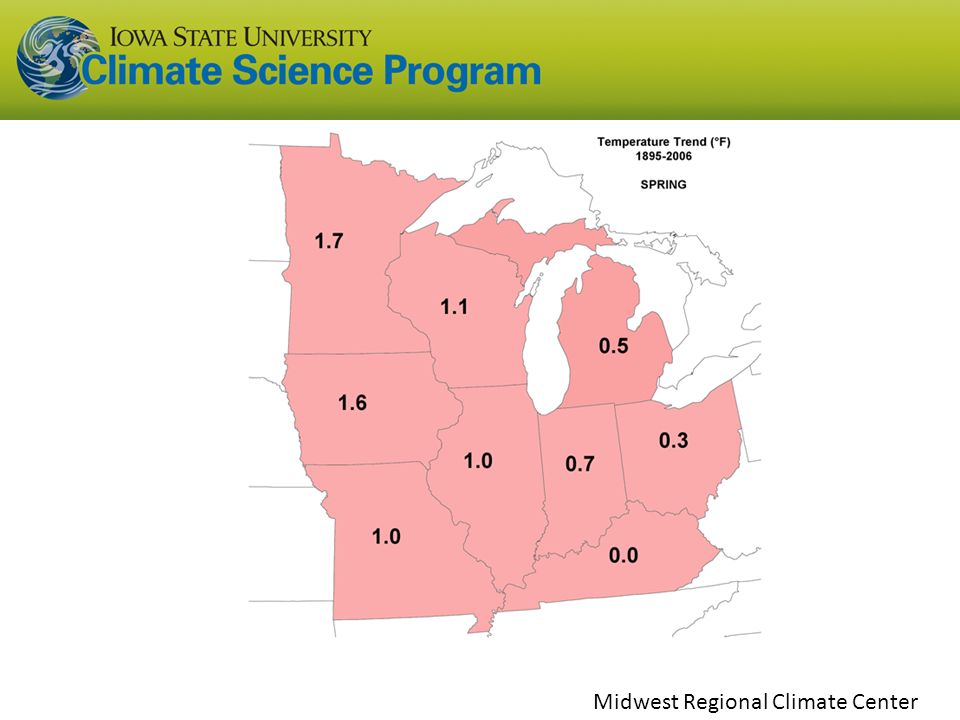
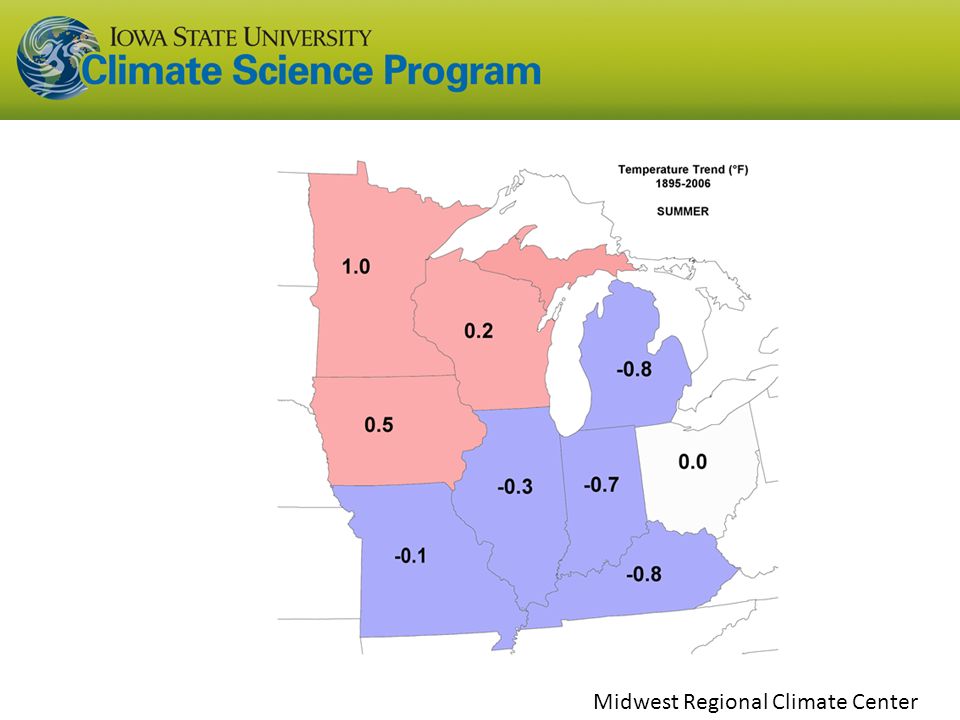
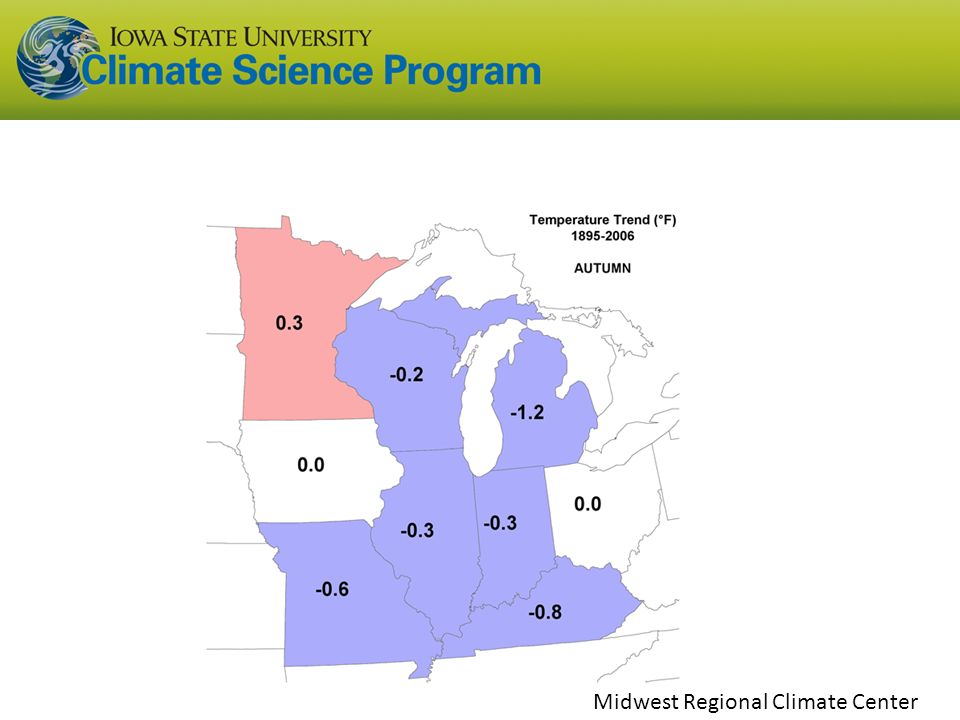
Midwest Regional Climate Center

21
Commodity Crops Corn (maize) Soybean Wheat Rice
 Soybean Wheat Rice")
24
Yield, Bushels per Acre KR Lamkey

25
US Corn Yields (Bushels/Acre) 1 bu = 25.5 kg 1 acre = 0.405 ha 1 bu/ac= 63 kg/ha 1.96 bu/ac/y KR Lamkey
 1 bu = 25.5 kg 1 acre = ha 1 bu/ac= 63 kg/ha 1.96 bu/ac/y KR Lamkey")
26
US Annual Corn yields Chad Hart

27
Excess water

28
FactorPercent Cold Winter 0.9 Decline in Price 6.6 Drought 35.5 Excess Moist/Precip/Rain 38.4 Flood 2.6 Freeze 0.1 Hail 7.2 Heat 1.2 Hot Wind 0.0 Mycotoxin (Aflatoxin) 1.0 Plant Disease 0.3 Winds/Excess Win 5.0 Other 1.1 Total 100.0 Insured Crop Loss for Corn in Iowa* *Milliman, Inc., based on 1995-2006 data from the Risk Management Agency Website (http://www.rma.usda.gov/)
 1.0 Plant Disease 0.3 Winds/Excess Win 5.0 Other 1.1 Total Insured Crop Loss for Corn in Iowa* *Milliman, Inc., based on data from the Risk Management Agency Website (")
29
US Annual Wheat yields Bushels per acre Chad Hart

30
US Wheat Yield Deviation from Expected Chad Hart

31
US Annual Soybean yields Bushels per acre Chad Hart

32
US Soybean Yield Deviation from Expected Chad Hart

33
Insured Crop Loss for Soybeans in Iowa* FactorPercent Cold Winter 0.6 Decline in Price 4.8 Drought 56.8 Excess Moist/Precip/Rain 20.2 Flood 1.4 Freeze 0.1 Hail 13.0 Heat 0.9 Hot Wind 0.0 Mycotoxin (Aflatoxin) 0.0 Plant Disease 1.1 Winds/Excess Wind 0.2 Other 1.1 Total 100.0 *Milliman, Inc., based on 1995-2006 data from the Risk Management Agency Website (http://www.rma.usda.gov/)
 0.0 Plant Disease 1.1 Winds/Excess Wind 0.2 Other 1.1 Total *Milliman, Inc., based on data from the Risk Management Agency Website (")
34
Much of the trend and part of reduced interannual variability is due to technology But not all…

35
Yield, Bushels per Acre KR Lamkey

37
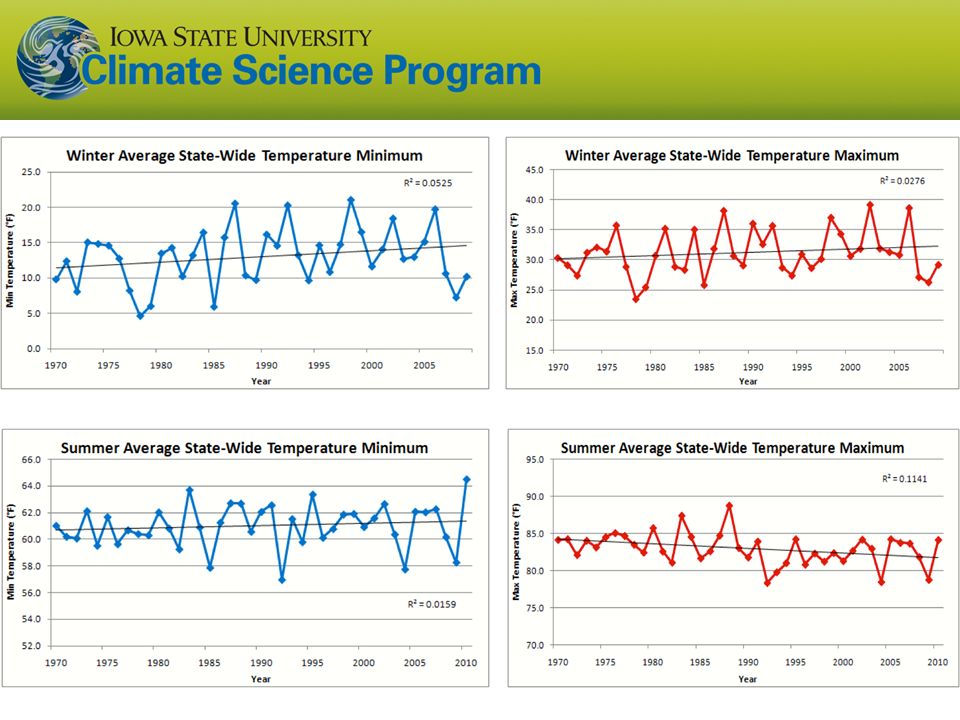
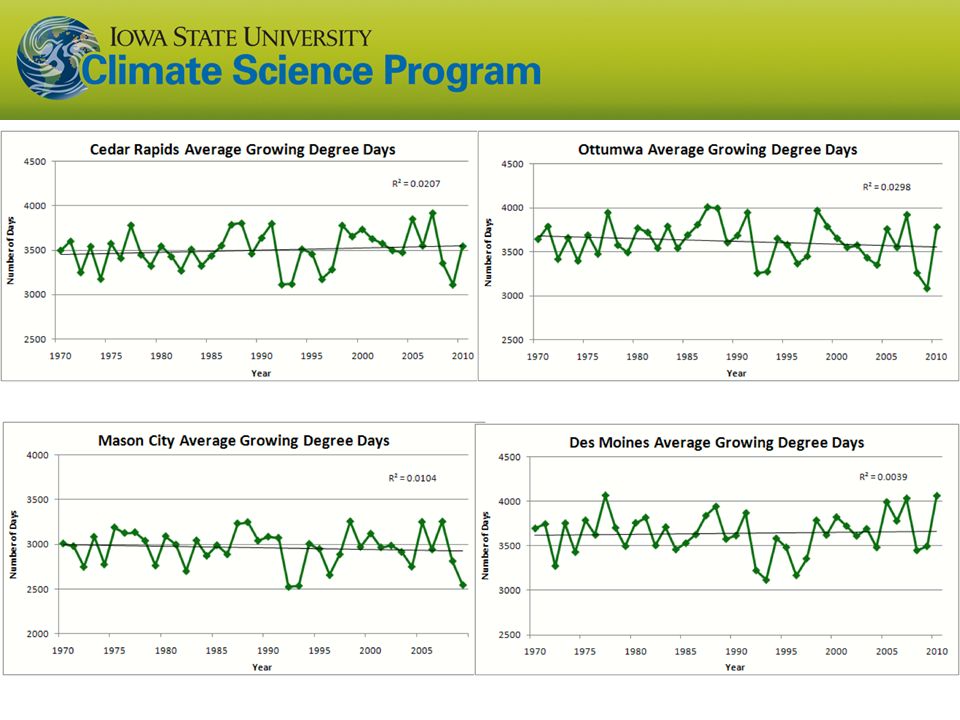
Iowa State-Wide Average Data

38
Kucharik. 2006. Agron. J. 98:1544 Ave planting date one week earlier C Kucharik

39
Des Moines Airport Data 1983: 13 1988: 10 2009: 0 2010: 0 1977: 8

40
Des Moines Airport Data 1983: 13 1988: 10 2009: 0 2010: 0 6 days ≥ 100 o F in the last 22 years 1977: 8

41
Adapted from Folland et al. [2001] Observed Summer (JJA) Daily Maximum Temperature Changes (K), 1976-2000
 Daily Maximum Temperature Changes (K),")
42
“Warming Hole”: Regional climate model simulations of changes in daily maximum summertime temperatures between 1990s and 2040s T max (JJA) ˚C Pan, Z., R. W. Arritt, E. S. Takle, W. J. Gutowski, Jr., C. J. Anderson, and M. Segal,2004: Altered hydrologic feedback in a warming climate introduces a “warming hole”. Geophys. Res. Lett.31, L17109, doi:10.1029/2004GL020528.

44
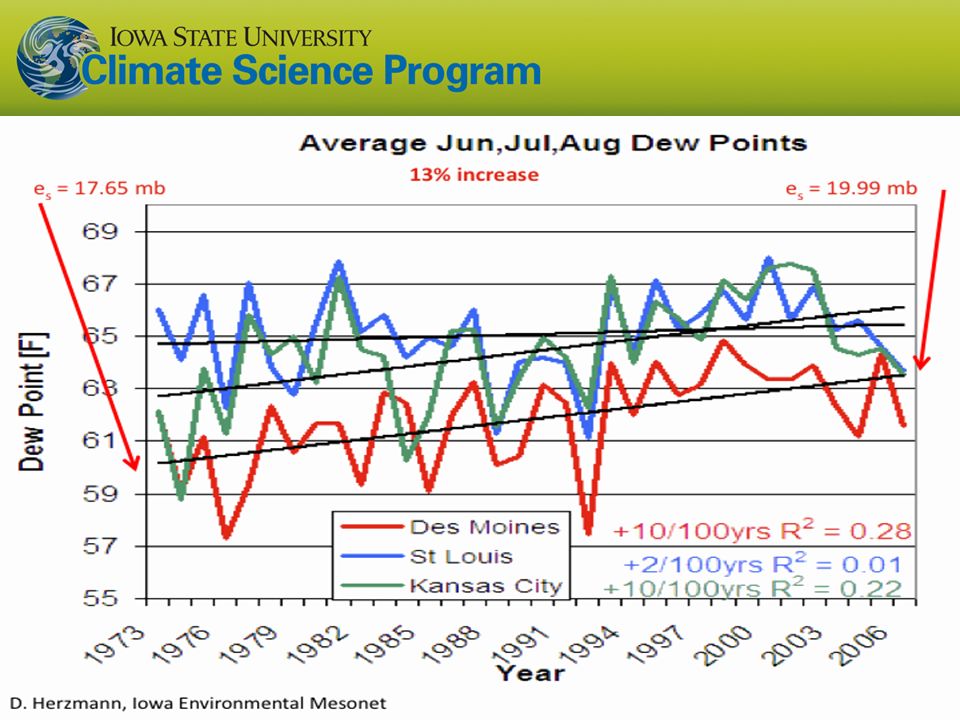
3.5 o F increase in Dew Point Temperature

46
Something is masking summer expression of the underlying warming

47
NASA GISS transient model from 1980’s projected little or no warming in summer (Takle and Zhong, 1991)
")
48
Totals above 40”8 years 2 years Iowa State-Wide Average Data 30.8” 10% increase 34.0”

49
28.0”37.0” 32% increase Cedar Rapids Data Years with more than 40 inches 1 11

50
4.2 days57% increase 6.6 days Cedar Rapids Data 1.25 inches 2 13Years having more than 8 days

51
“One of the clearest trends in the United States observational record is an increasing frequency and intensity of heavy precipitation events… Over the last century there was a 50% increase in the frequency of days with precipitation over 101.6 mm (four inches) in the upper midwestern U.S.; this trend is statistically significant “ Karl, T. R., J. M. Melillo, and T. C. Peterson, (eds.), 2009: Global Climate Change Impacts in the United States. Cambridge University Press, 2009, 196pp.
, 2009: Global Climate Change Impacts in the United States. Cambridge University Press, 2009, 196pp..")
52
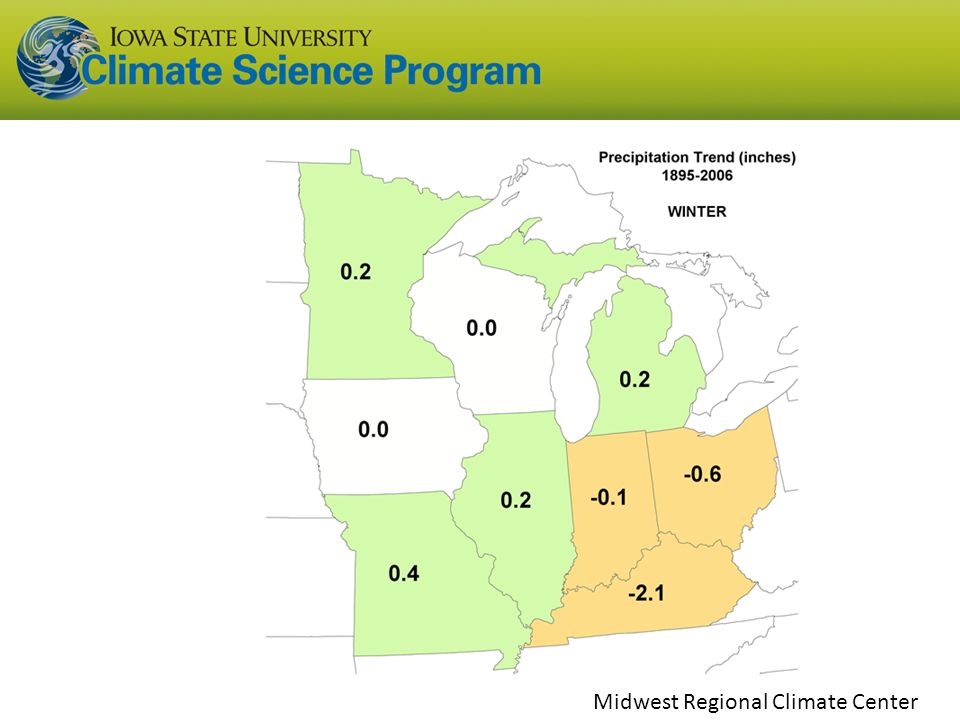
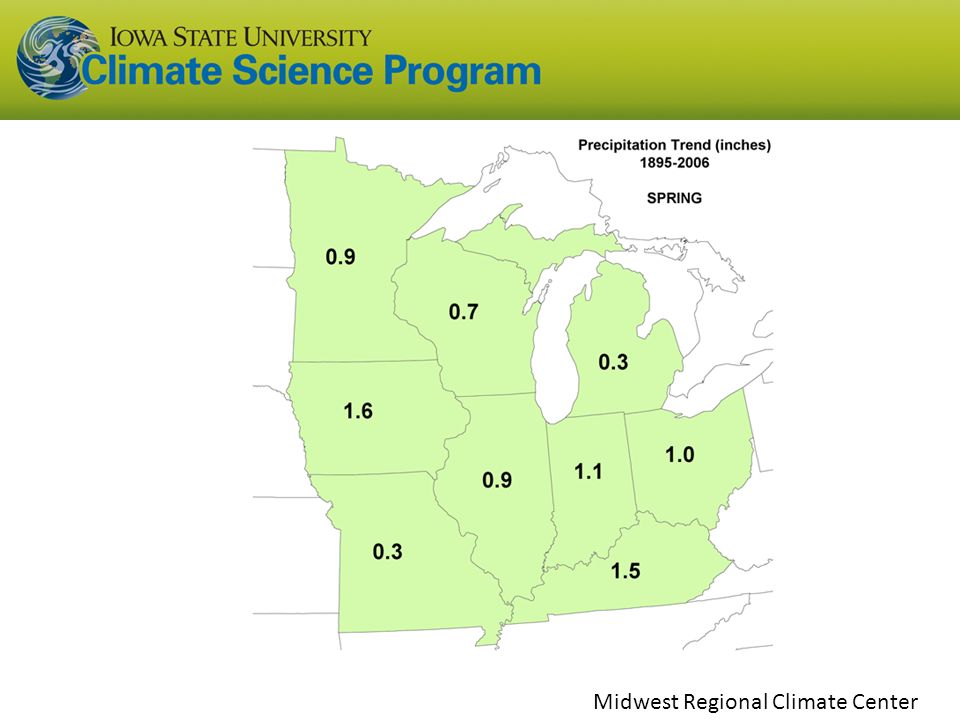
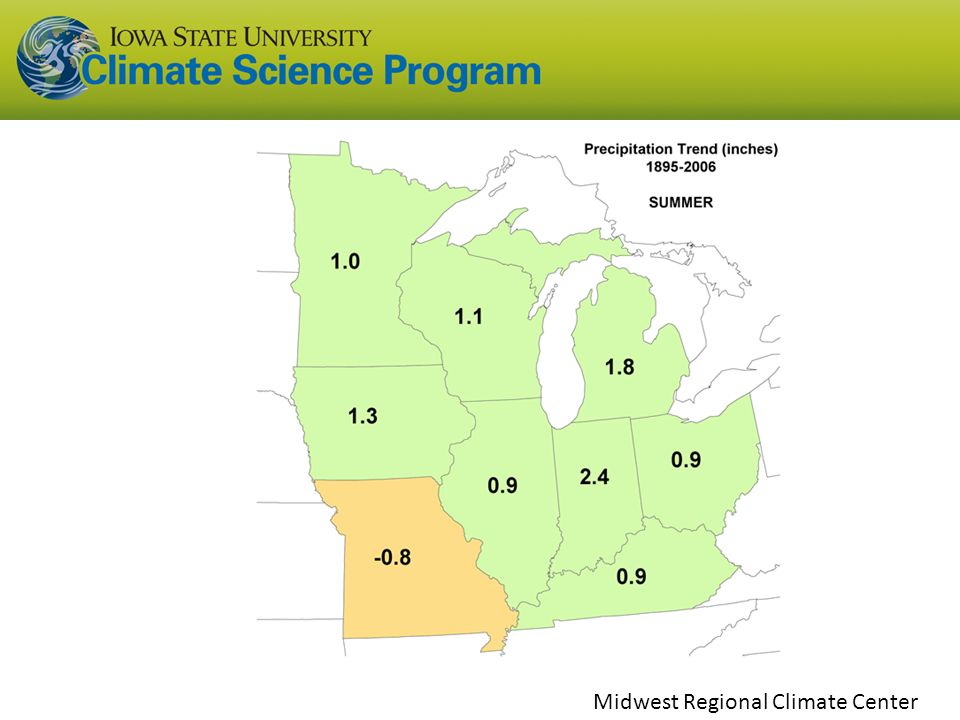
21.2 => 25.3 inches (19% increase)12.1 => 10.5 inches (13% decrease) Amplification of the Seasonality of Precipitation Spring WinterSummer Fall
12.1 => 10.5 inches (13% decrease) Amplification of the Seasonality of Precipitation Spring WinterSummer Fall")
53
21.2 => 25.3 inches (19% increase)12.1 => 10.5 inches (13% decrease) Amplification of the Seasonality of Precipitation Spring WinterSummer Fall NASA GISS model from 1980’s projected little or no warming in summer (Takle and Zhong, 1991)
12.1 => 10.5 inches (13% decrease) Amplification of the Seasonality of Precipitation Spring WinterSummer Fall NASA GISS model from 1980’s projected little or no warming in summer (Takle and Zhong, 1991)")
55
July Cloud Cover, Des Moines

56
JJA Cloud Cover, Des Moines

57
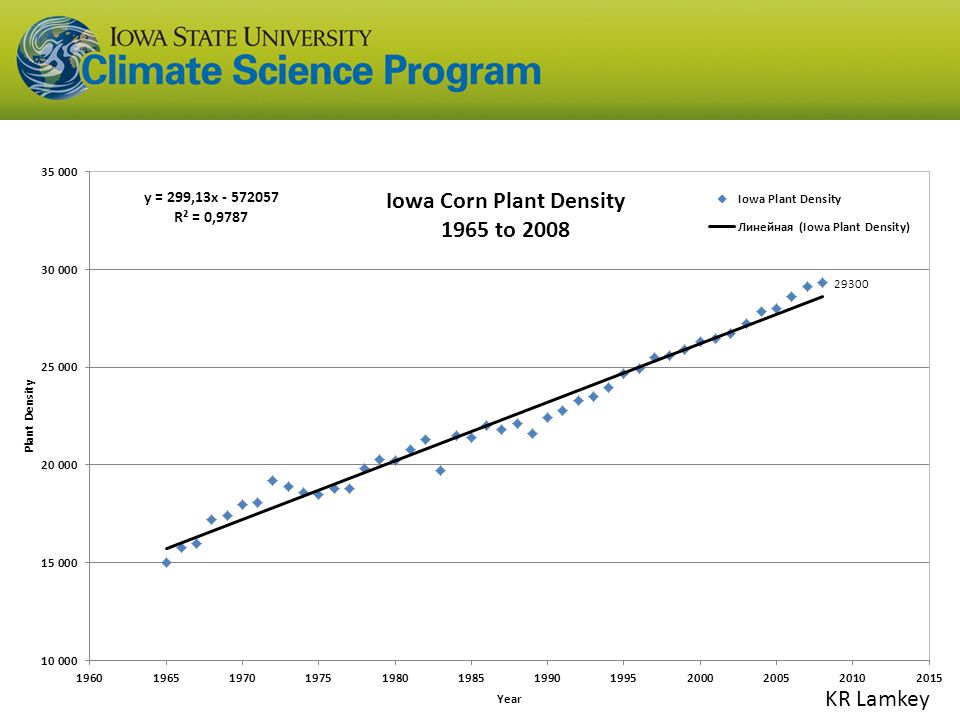
Iowa Agricultural Producers are Adapting to Climate Change: Longer growing season: plant earlier, plant longer season hybrids, harvest later Wetter springs: larger machinery enables planting in smaller weather windows More summer precipitation: higher planting densities for higher yields Wetter springs and summers: more subsurface drainage tile is being installed, closer spacing, sloped surfaces Fewer extreme heat events: higher planting densities, fewer pollination failures Higher humidity: more spraying for pathogens favored by moist conditions. more problems with fall crop dry-down, wider bean heads for faster harvest due to shorter harvest period during the daytime. Drier autumns: delay harvest to take advantage of natural dry-down conditions HIGHER YIELDS!! Is it genetics or climate? Likely some of each.

58
Lobell et al., Science 2008

59
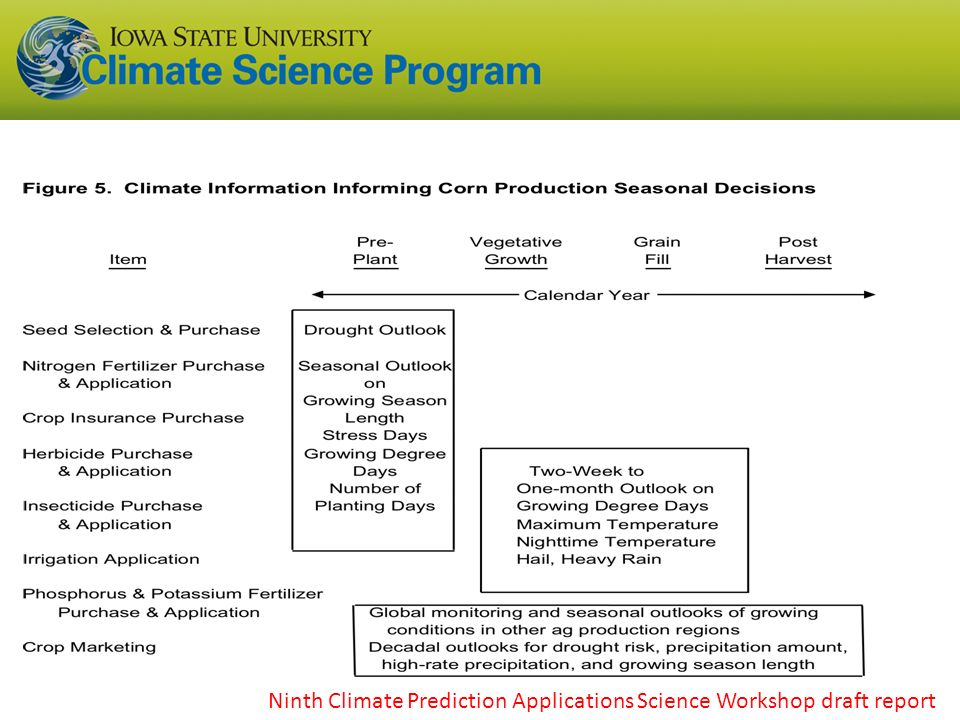
Ninth Climate Prediction Applications Science Workshop draft report

61
Issue Met condition Lead timeDecision Soil compactionrain 4/25-5/151-2 daysto do field work Hail damagehail occurrence2 moins Fertilizationwinter soil T, summer rain6-9 mofall/spr appl, amt Pest managemntdew duration, multiple stress6-9 mochem purch Field work daysrain 4/15-5/153-6 mocorn=>soy, mkt Pollination failureheat 7/15-7/306 mocorn=>soy, mkt Droughtextnde heat &no rain, Jun-Aug6-9 mocorn=>soy, ins, mkt FreezeT< 0 o C3-6 moins, mkt Growing deg daysT > 10 o C3-6 momkt Nighttime tempT min consistently > ~20 o C3-6 momkt Rental agreemntsfavorable weather 12 mochange rates Adaptive mngmntlocal climate change1-3 yrchange machinery Pricesglobal weather6-12 mocorn soy, mkt Pricesglobal weather1-3 yrmachinery purchase Pricesglobal climate1-3 yrland purchase Soil erosionheavy precip1-5 yrconserv. practices Waterlogged soilincreased precip5-10 yrinstall subsoil drain tile

62
For More Information Contact me directly: gstakle@iastate.edu Climate Science Program website: http://climate.engineering.iastate.edu/ Current research on regional climate and climate change at the ISU Regional Climate Modeling Laboratory: http://rcmlab.agron.iastate.edu/ North American Regional Climate Change Assessment Program: http://www.narccap.ucar.edu/ Or just Google Eugene Takle Iowa precipitation analysis and simulation is a collaborative project under funding from the Iowa Flood Center (http://www.iowafloodcenter.org/)

63
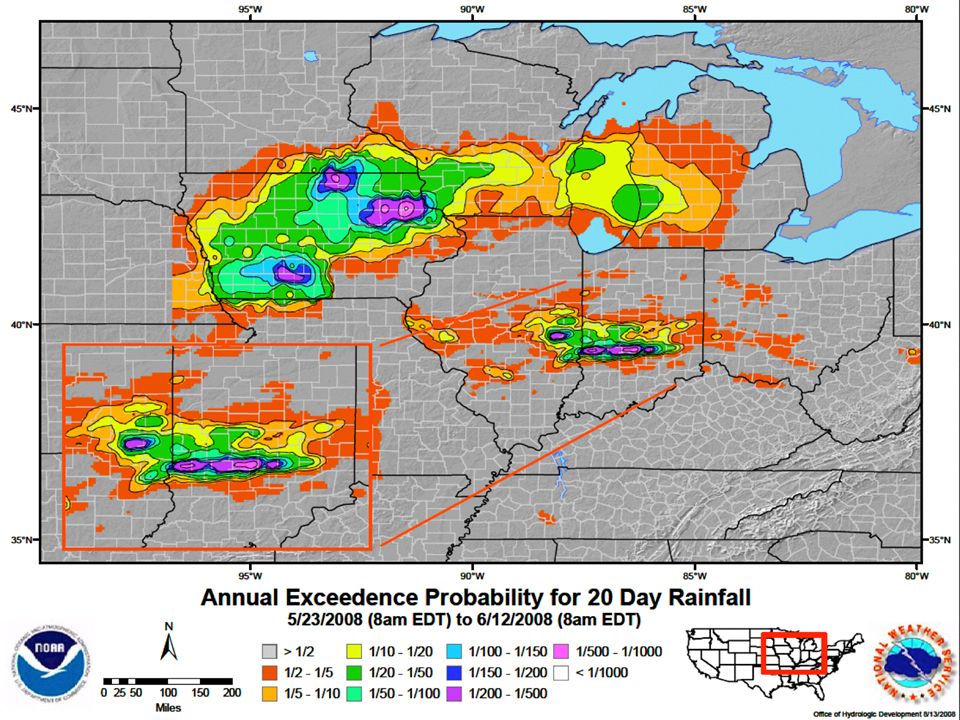
2008

Similar presentations