Download presentation
Presentation is loading. Please wait.

4
We will be using Cornell Note Taking Format Today! Smile and “Own the Day! Take one step at a time to Success in Economics class!

5
Unit Two: Learning Objectives: North Clackamas School District Social Studies Priority Standards: HS.51 (A): Explain how supply and demand represents economic activity and describe the factors that cause them to shift.
: Explain how supply and demand represents economic activity and describe the factors that cause them to shift.")
6
Lesson Four: Daily Learning Target I Can define and explain in writing the following key Economic concepts: Law of Supply Supply Curve Elastic and Inelastic Supply

9
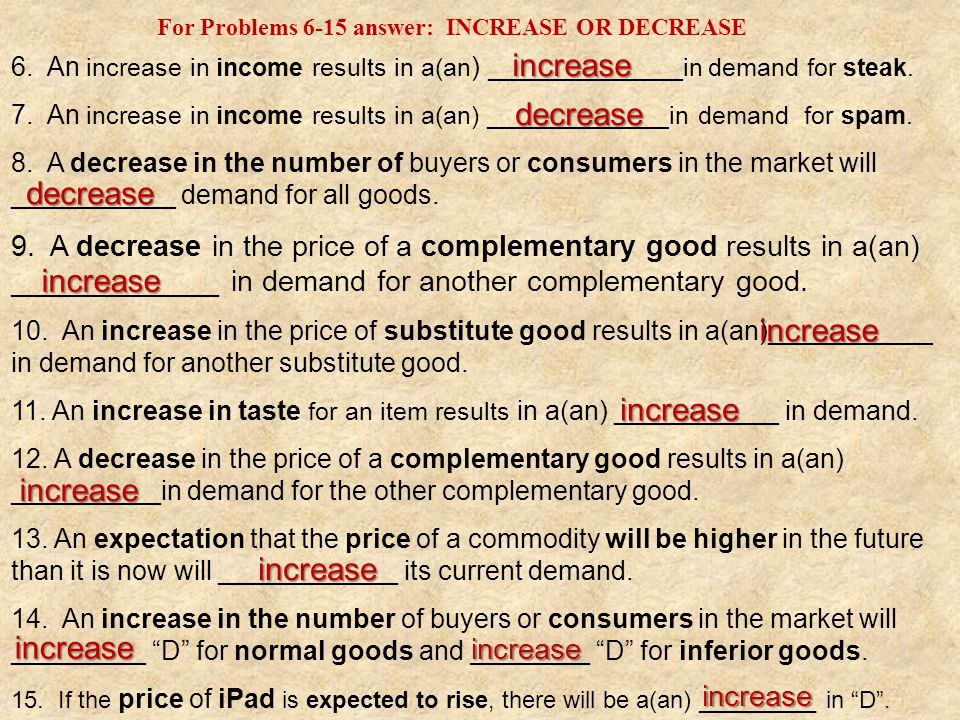
6. An increase in income results in a(an ) _____________ in demand for steak. 7. An increase in income results in a(an) _____________in demand for spam. 8. A decrease in the number of buyers or consumers in the market will ___________ demand for all goods. 9. A decrease in the price of a complementary good results in a(an) _____________ in demand for another complementary good. 10. An increase in the price of substitute good results in a(an)___________ in demand for another substitute good. 11. An increase in taste for an item results in a(an) ___________ in demand. 12. A decrease in the price of a complementary good results in a(an) __________in demand for the other complementary good. 13. An expectation that the price of a commodity will be higher in the future than it is now will ____________ its current demand. 14. An increase in the number of buyers or consumers in the market will _________ “D” for normal goods and ________ “D” for inferior goods. 15. If the price of iPad is expected to rise, there will be a(an) _________ in “D”. increase decrease decrease increase increase increase increase increase increase increase increase For Problems 6-15 answer: INCREASE OR DECREASE
 _____________in demand for spam. 8. A decrease in the number of buyers or consumers in the market will ___________ demand for all goods. 9. A decrease in the price of a complementary good results in a(an) _____________ in demand for another complementary good. 10. An increase in the price of substitute good results in a(an)___________ in demand for another substitute good. 11. An increase in taste for an item results in a(an) ___________ in demand. 12. A decrease in the price of a complementary good results in a(an) __________in demand for the other complementary good. 13. An expectation that the price of a commodity will be higher in the future than it is now will ____________ its current demand. 14. An increase in the number of buyers or consumers in the market will _________ D for normal goods and ________ D for inferior goods. 15. If the price of iPad is expected to rise, there will be a(an) _________ in D . increase decrease decrease increase increase increase increase increase increase increase increase For Problems 6-15 answer: INCREASE OR DECREASE.")
10
Microsoft’s new tablet, The Surface

11
$45

12
Law of Supply

13
I want a clean diaper Your mom wanted peace and quiet.

14
Bread Butter

15
Look carefully at this graph. How does price influence supply?

16
Why do suppliers love high prices?

17
Law of Supply The Law of Supply is the tendency of suppliers to offer more of a good at higher prices. Sellers love high prices. The Law of Supply is the opposite of the Law of Demand.

18
P1P1 QS 1 S P1P1 S Let’s Make More!! Take it. We are losing money.

19
10,000 30,000 QS1 QS2 QS1 QS2 5,000 10,000 QS1 QS2 QS1 QS2 25,000 QS 1 QS 1 S $2 Soybeans [bushels] Soybeans [bushels] $3 $2 $3 $2 $2 S S S Deriving Market Supply from Individual Firm Supply Curves
![10,000 30,000 QS1 QS2 QS1 QS2 5,000 10,000 QS1 QS2 QS1 QS2 25,000 QS 1 QS 1 S $2 Soybeans [bushels] Soybeans [bushels] $3 $2 $3 $2 $2 S S S Deriving Market Supply from Individual Firm Supply Curves](http://images.slideplayer.com/24/7064167/slides/slide_19.jpg "10,000 30,000 QS1 QS2 QS1 QS2 5,000 10,000 QS1 QS2 QS1 QS2 25,000 QS 1 QS 1 S $2 Soybeans [bushels] Soybeans [bushels] $3 $2 $3 $2 $2 S S S Deriving Market Supply from Individual Firm Supply Curves")
20
. S

21
Why is the Law of Supply True? Supply increases as price rises because either existing firms will produce more to make greater profits… Or new firms will enter the market to take advantage of the high prices. Sellers love to make profits.

22
It’s hard to find vinyl records anymore. Suppliers prefer selling Compact Discs. Suppliers go where the higher prices are.

23
Suppliers don’t sell Disco anymore. There just isn’t any money in it.

24
A Supply Curve A supply curve is a graphic representation showing the tendency of suppliers to supply more at higher prices. A supply curve will always rise left to right. Suppliers supply more at higher prices.

25
50,000 Existing suppliers of DVD rentals are willing to supply more as the price increases & others [Albertson’s] are attracted to the market. P1P1P1P1 S P
![50,000 Existing suppliers of DVD rentals are willing to supply more as the price increases & others [Albertson’s] are attracted to the market.](http://images.slideplayer.com/24/7064167/slides/slide_25.jpg "P1P1P1P1 S P.")
26
Notice how the supply curve rises left to right.

27
Supply moves in the direction of price.

28
Supply Schedule & Curves A Supply Schedule displays the quantity of a product supplied at each price PriceBottles Supplied 2.0011.6 1.7511.5 1.5011.2 1.2510.7 1.0010.759.1.508

29
SUPPLY SCHEDULE $12345 P QS CORN 520355060 S 5 20 35 50 60 SUPPLY CURVE $5 $4 $3 $2 $1 P P QS

30
Supply Schedule & Curves Use the following supply schedule for corn to create a supply curve. Price Per TonQuantity Supplied $10050 $15075 $200100 $250125 $300150 $350175 $400200

31
I’m saving money at the lower price. I normally eat one, but at this low price, I’m Having two.

32
Shot Glass “Take Dat Wit Chew” Supplied

33
0 1000 2000 3000 4000 5000
35
SUPPLY PRACTICE: WHEN YOU ARE FINISHED….Skim through Chapter 5 (page 109-115)Answer questions 3-8 on a piece of notebook paper and turn directly into me today. THIS CAN BE DONE IN PARTNERS! Pick up a graphing worksheet from me. Work on this independently. Turn directly into me. I want to personally check your level of understanding on these concepts.

Similar presentations