Download presentation
Presentation is loading. Please wait.

1
Thermal, Nonthermal, and Total Flare Energies Brian R. Dennis RHESSI Workshop Locarno, Switzerland 8 – 11 June, 2005

2
Separating Thermal & Nonthermal Temporal - gradual vs. impulsive Spatial - coronal vs. footpoint Spectral - exponential vs. power-law Spectral – iron-line complexes - always thermal!!!?

3
Difficulties with Continuum

4
26 April 2003 Flare Time Profile A0A1A3A1A0 All Detectors ▬ 3 - 6 keV ▬ 6 – 12 keV ▬ 12 – 25 keV ▬ 25 – 50 keV Time for spectrum

7
RHESSI Count-rate Spectrum

8
Flux ratio vs. Temperature (Caspi & Lin, 2005)
")
9
Emissivity vs. Temperature (Caspi & Lin, 2005)
")
10
Fe-line Equivalent Width 26 April 2003 CHIANTI Coronal Abundances

11
Ionization Fraction Antonucci (1987 – SMM/BCS) Mazzotta et al. (1998) Less FeXXV than the calculations predict.
 Less FeXXV than the calculations predict..")
12
Conclusions Fe & Fe/Ni complexes are real. Fe centroid energies vary with T & count rate. Fe to Fe/Ni ratio varies with T. –Different dependency for different flares. Fe equivalent width varies with T –Data in A1 attenuator state most reliable. –Up to 50% less FeXXV than Mazzotta et al. predict (Phillips). Eagerly await XSM spectra for comparison.
. Eagerly await XSM spectra for comparison..")
13
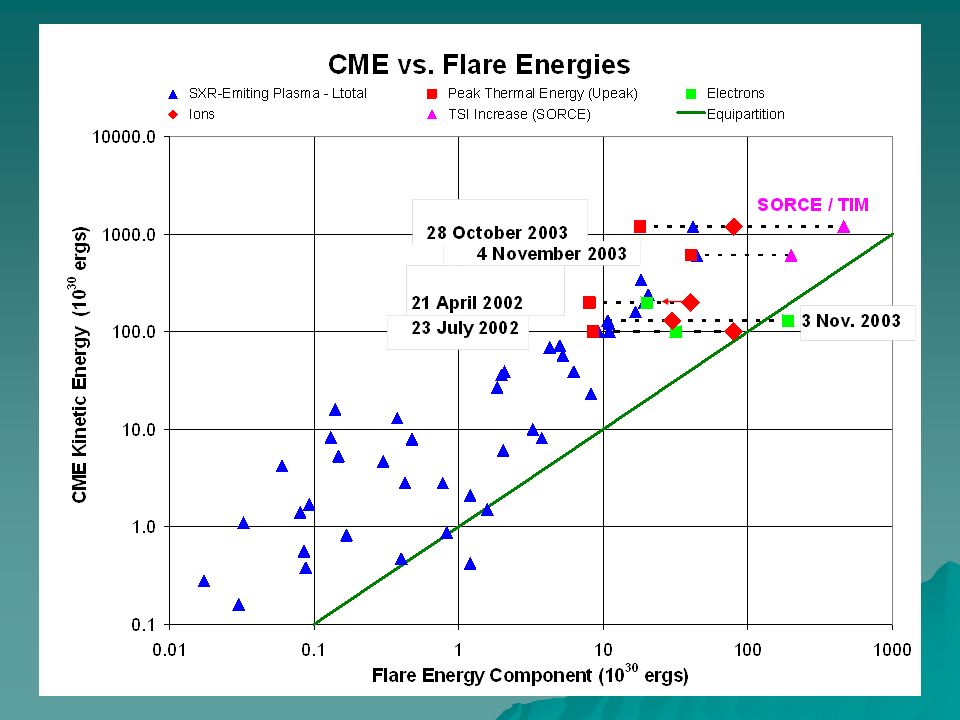
Flare vs. CME Energy Flare thermal energies: –SXR-emitting plasma (GOES & RHESSI) –Radiated energy (GOES) –Conducted energy (GOES & RHESSI) –Total Solar Irradiance increase (SORCE) Flare nonthermal energies –Electrons from HXRs (Holman) –Ions from gamma-rays (Share) CME kinetic energy –(LASCO – Gopalswamy)
 –Radiated energy (GOES) –Conducted energy (GOES & RHESSI) –Total Solar Irradiance increase (SORCE) Flare nonthermal energies –Electrons from HXRs (Holman) –Ions from gamma-rays (Share) CME kinetic energy –(LASCO – Gopalswamy).")
14
Thermal Plasma The thermal energy content of the thermal plasma: U th = 3 n e V kT = 3 k T [EM f V apparent ] 1/2 erg f is the filling factor (assumed to be 1) Emission measures (EM) and temperatures (T) obtained from both RHESSI and GOES soft X-ray observations. The source volumes (V) were obtained from RHESSI 12 – 25 keV images V = f V apparent = f A 3/2 A is the area inside the contour at 50% of the peak value.
![Thermal Plasma The thermal energy content of the thermal plasma: U th = 3 n e V kT = 3 k T [EM f V apparent ] 1/2 erg f is the filling factor (assumed to be 1) Emission measures (EM) and temperatures (T) obtained from both RHESSI and GOES soft X-ray observations.](http://images.slideplayer.com/24/7062515/slides/slide_14.jpg " The source volumes (V) were obtained from RHESSI 12 – 25 keV images V = f V apparent = f A 3/2 A is the area inside the contour at 50% of the peak value..")
15
Figure 1. RHESSI image at the impulsive peak of the 2 Nov. 2003 flare. Contours: blue: 12 – 25 keV (50%), magenta: 50 – 100 keV (30 & 70%)
, magenta: 50 – 100 keV (30 & 70%).")
16
Radiated Energy The energy radiated from the thermal plasma over all wavelengths: L rad = EM f rad (T) ergs s -1 f rad (T) is the Chianti radiative loss function assuming coronal abundances. Total radiated energy from the flare plasma – L total = n [ L rad (t) * D t ] erg L total = n [ L rad (t) * D t ] erg where the sum is over the duration of the SXR flare.
 * D t ] erg L total = n [ L rad (t) * D t ] erg where the sum is over the duration of the SXR flare..")
17
Figure 2. Radiative losses vs. plasma temperature. Mazzotta et al. (1998) ionization equilibrium Radiative Energy Loss – f rad (erg cm 3 s -1 ) Temperature (K)
 ionization equilibrium Radiative Energy Loss – f rad (erg cm 3 s -1 ) Temperature (K).")
18
Conductive Cooling The conductive losses – L cond – were estimated assuming classical conduction L cond = A k 0 T 5/2 V T 4 A/ l k 0 T 7/2 erg s -1 where k 0 = 10 -6 erg cm -1 s -1 K -7/2 the classical Spitzer coefficient A is the loop cross-sectional area in cm 2 l is the loop half length. l is the loop half length. A, l, and T can be determined from RHESSI images. However, since there is so much uncertainty in estimating this cooling component, no values are included in this analysis.

19
X8.3 flare 2 Nov. 2003 GOES SXR Data

27
Conclusions Flare and CME energies are correlated for the Oct/Nov 2003 period. Total Flare and CME energies comparable to within a factor of 10. Peak energy in SXR-emitting plasma is only ~1% of total flare energy in some cases. Energy radiated by SXR-emitting plasma is only ~10% of total flare energy in some cases. Energy in nonthermal electrons and ions can be a large fraction of the total flare energy. Dominant flare energy in impulsive phase may be electrons and/or ions leading to early peak in total solar irradiance increase seen with SORCE/TIM. Some of the measured radiant energy of flare may result from a decrease in the opacity of the lower chromosphere caused by a decrease in the H – concentration (Fontenla, private communication).
..")
Similar presentations


 Ken Phillips (b), Brian Dennis (c) a) DAMTP, University of Cambridge, UK b) Mullard Space Science Lab, UK c) NASA/GSFC, Maryland,>")
>")
>")


