Download presentation
Presentation is loading. Please wait.

1
Baseflow Recession Q0

2
Baseflow recession Q = Q0 e–at
Q = flow at time t after recession started (L3/T; ft3/s or m3/s). Q0 = flow at the beginning of recession. a = recession constant (1/T; d-1). t = time since recession began. (T; d)
. Q0 = flow at the beginning of recession. a = recession constant (1/T; d-1). t = time since recession began. (T; d)")
3
Meyboom method Vtp = Q0t1/2.3
Vtp = Volume of total potential groundwater discharge during a complete ground water recession (L3, ft3 or m3). Q0 = baseflow at start of recession (L3/T, ft3/s or m3/s). T1 = time it takes baseflow to go from Q0 to 0.1Q0
. Q0 = baseflow at start of recession (L3/T, ft3/s or m3/s). T1 = time it takes baseflow to go from Q0 to 0.1Q0.")
4
Increase of Recharge find t1 tc = 0.2144 t1 find QA & QB
Vtp = QBt1/2.3 – QAt1/2.3 G = 2 Vtp

5
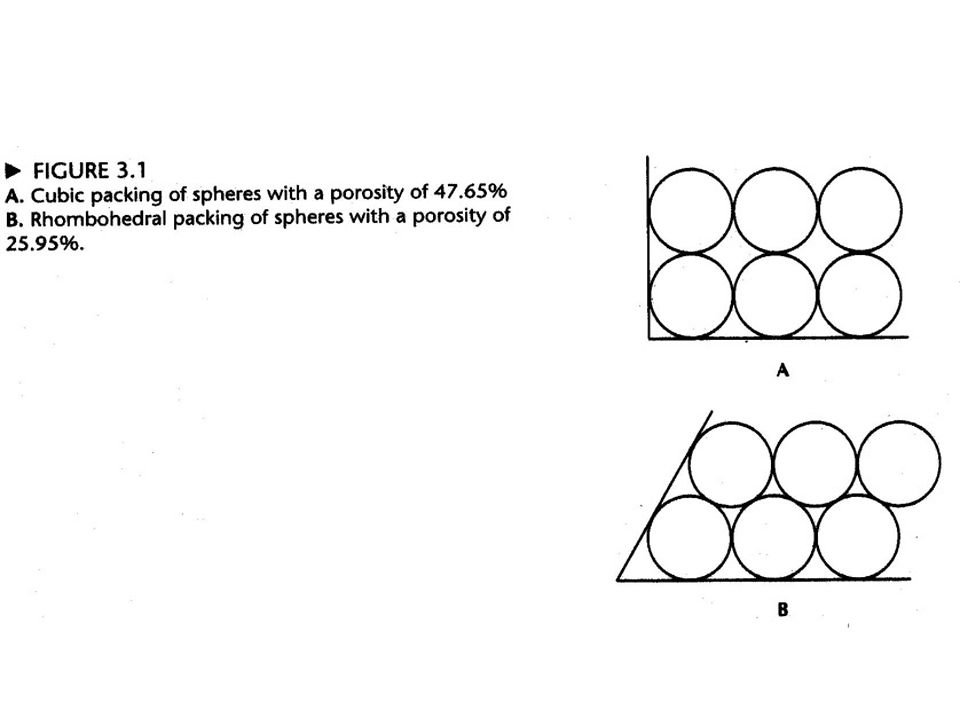
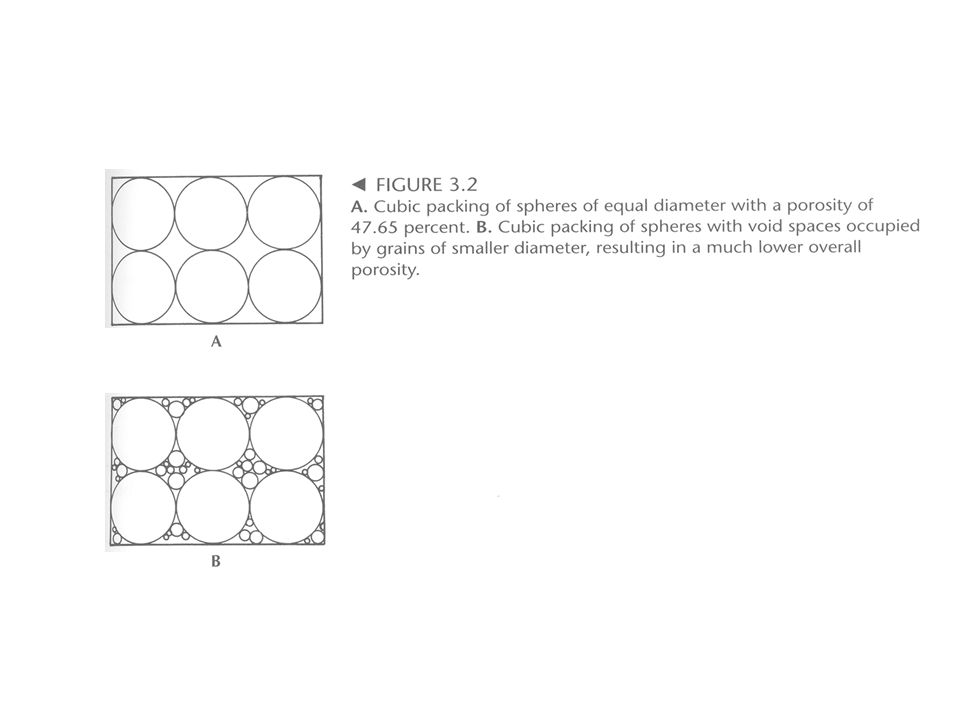
Porosity Porosity is percent of rock or soil that is void of material.
n = 100 Vv/V n = porosity (percentage) Vv = volume of void space (L3, cm3, m3) V = unit volume of material including voids and solids.
 Vv = volume of void space (L3, cm3, m3) V = unit volume of material including voids and solids.")
6
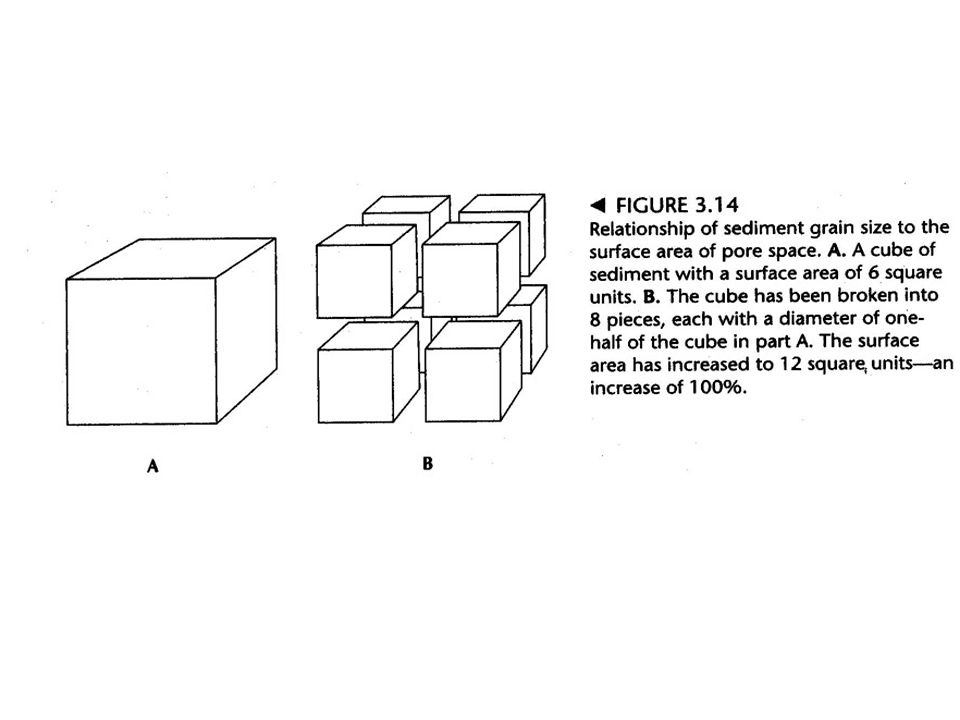
Factors affecting porosity
Packing Grain-size distribution - sorting

9
Sediment Classification
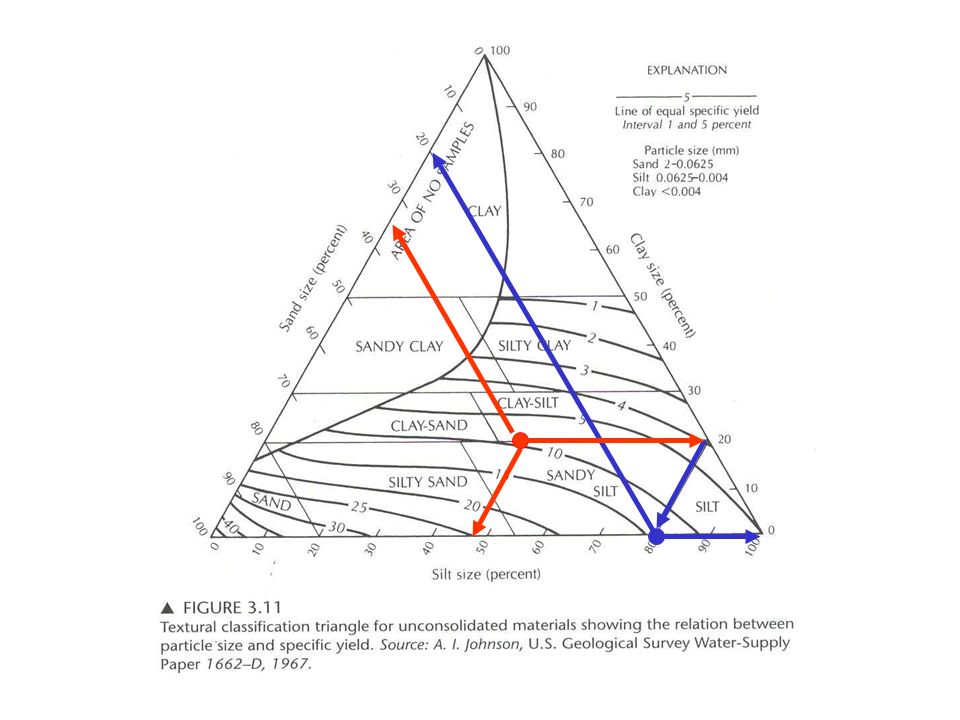
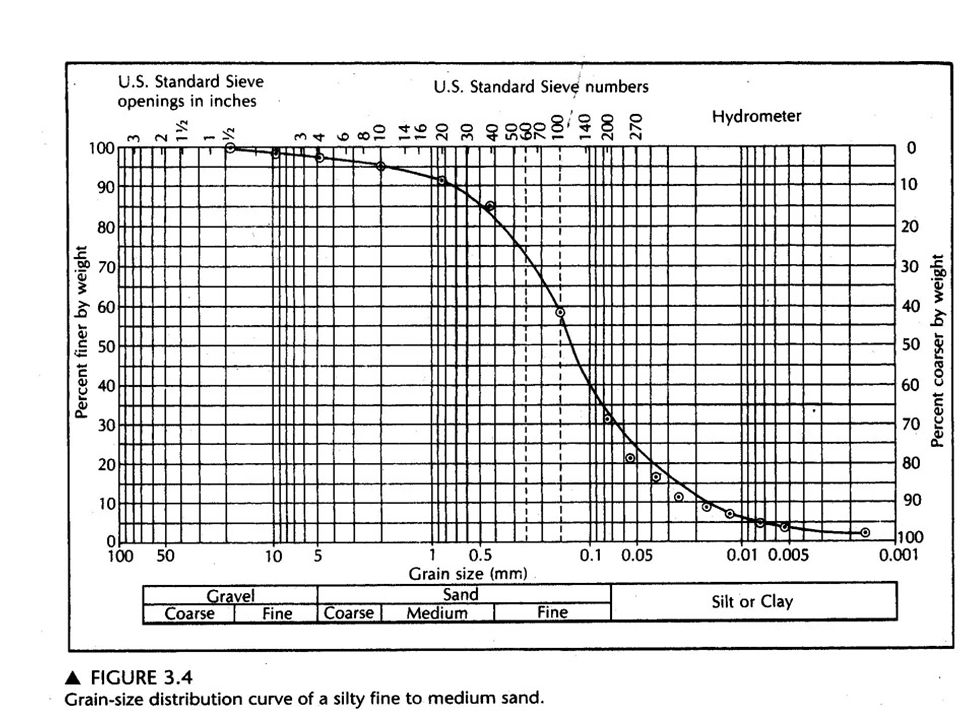
Sediments are classified on basis of size of individual grains Grain size distribution curve Uniformity coefficient Cu = d60/d10 d60 = grain size that is 60% finer by weight. d10 = grain size that is 10% finer by weight. Cu = 4 => well sorted; Cu > 6 => poorly sorted.

10
d60 d10 d60 d10

11
d60 d10 d10 d60

12
Aquifer Properties: Porosity, specific yield, specific retention.
Potential: Transmissivity, storativity. Types: confined, unconfined. Hydraulic conductivity, Physical Laws controlling water transport.

13
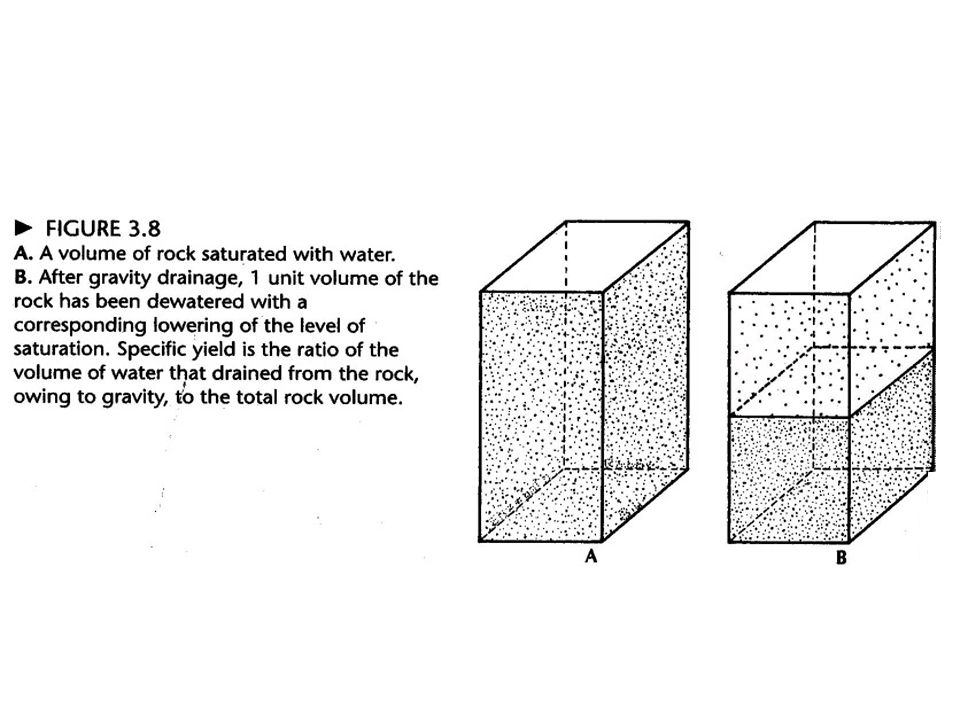
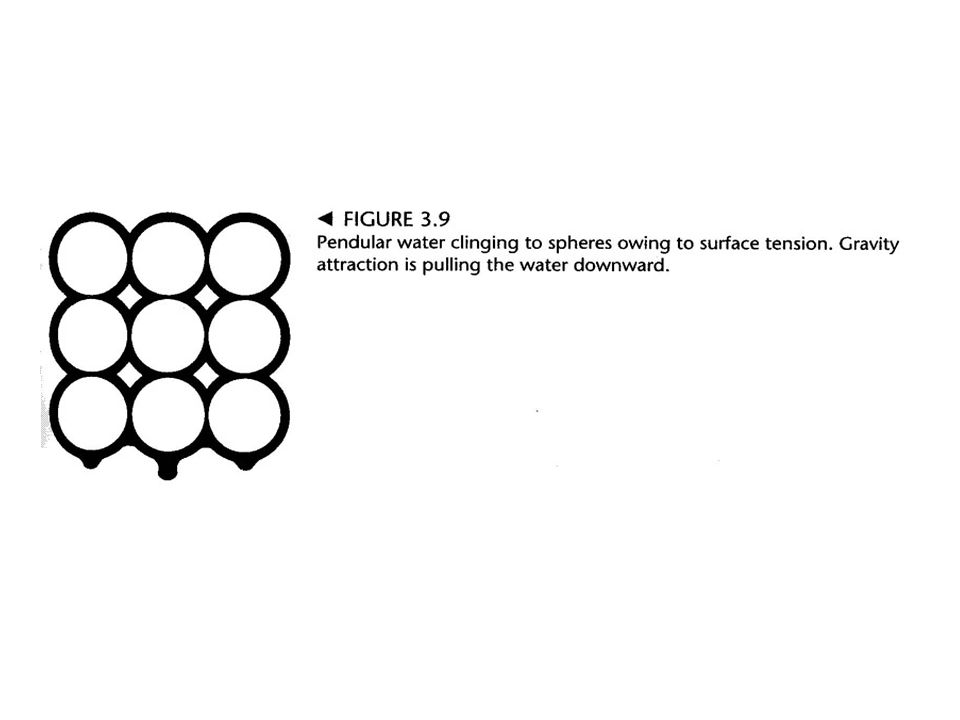
Specific Yield and Retention
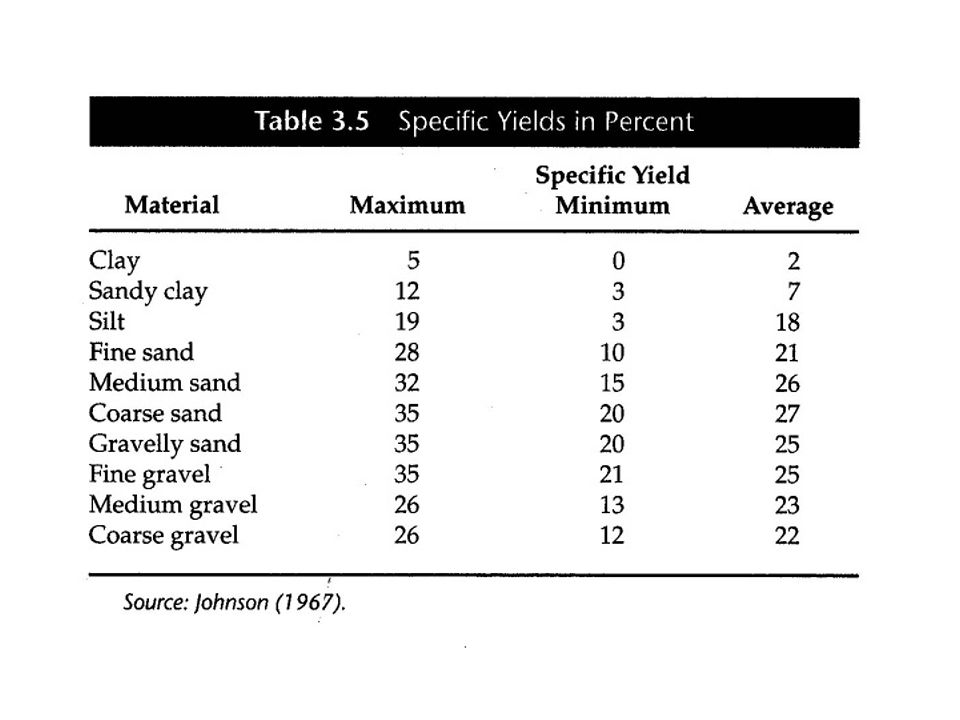
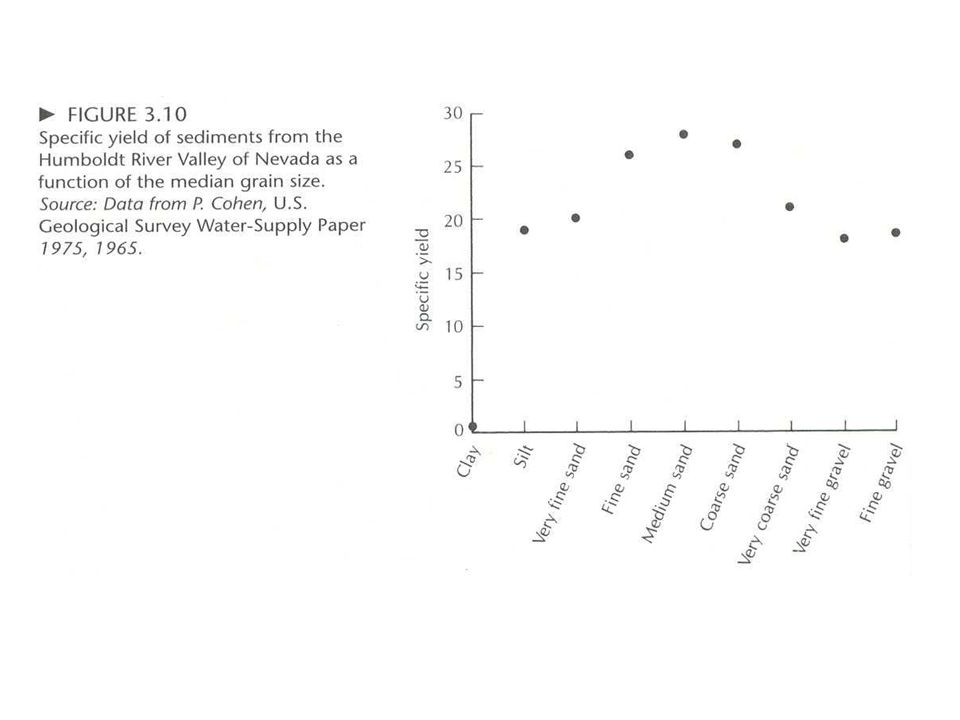
Specific yield – Sy: ratio of volume of water that drains from a saturated rock owing to the attraction of gravity to the total volume of the rock. Specific retention – Sr: ratio of the volume of water in a rock can retain against gravity drainage to the total volume of the rock. n = Sy + Sr. Sr increases with decreasing grain size.

19
Darcy’s Law

20
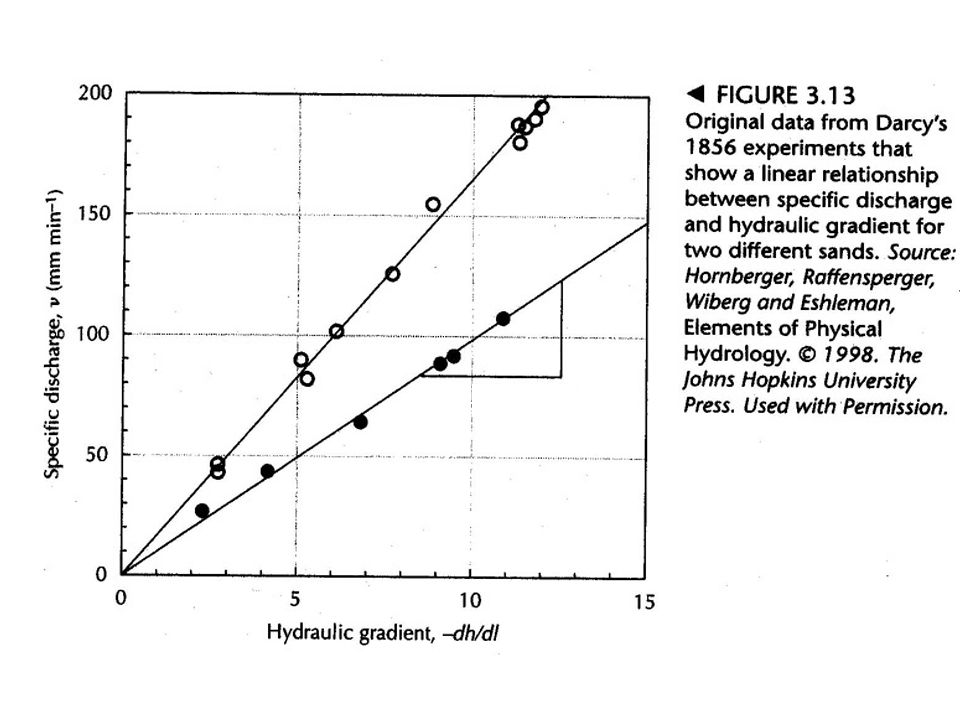
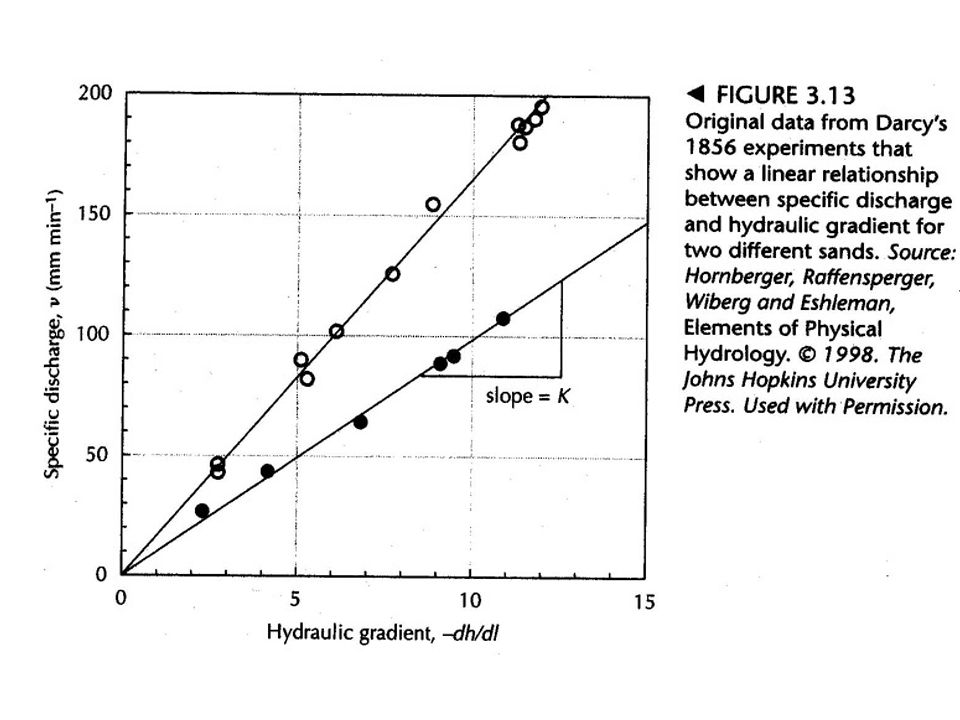
Darcy’s Experiment Q ha – hb. Q 1/L.
Darcy’s Law: Q = -KA(ha-hb)/L. Q = -KA(dh/dl). dh/dl = Hydraulic gradient. dh = change in head between two points separated by small distance dl.
/L. Q = -KA(dh/dl). dh/dl = Hydraulic gradient. dh = change in head between two points separated by small distance dl.")
21
Hydraulic conductivity
K = hydraulic conductivity (L/T). K is also referred to as the coefficient of permeability. K = -Q[A(dh/dl)] [ L3/T/[L2(L/L)] = L/T] V = Q/A = -K(dh/dl) = specific discharge or Darcian velocity.
. K is also referred to as the coefficient of permeability. K = -Q[A(dh/dl)] [ L3/T/[L2(L/L)] = L/T] V = Q/A = -K(dh/dl) = specific discharge or Darcian velocity.")
24
Factors influencing hydraulic conductivity
Porous medium. Fluid passing through the medium.

25
Factors influencing hydraulic conductivity
Q d2 Q γ. Q 1/μ. d = mean pore diameter. γ = specific weight. μ = viscosity.

26
Darcy’s Law, cont. Q = -[Cd2γA/ μ](dh/dl). C = shape factor.
C, d = properties of porous media. γ and μ = properties of the fluid.
. C = shape factor.](http://slideplayer.com/slide/7057540/24/images/26/Darcy%E2%80%99s+Law%2C+cont.+Q+%3D+-%5BCd2%CE%B3A%2F+%CE%BC%5D%28dh%2Fdl%29.+C+%3D+shape+factor..jpg "C, d = properties of porous media. γ and μ = properties of the fluid.")
27
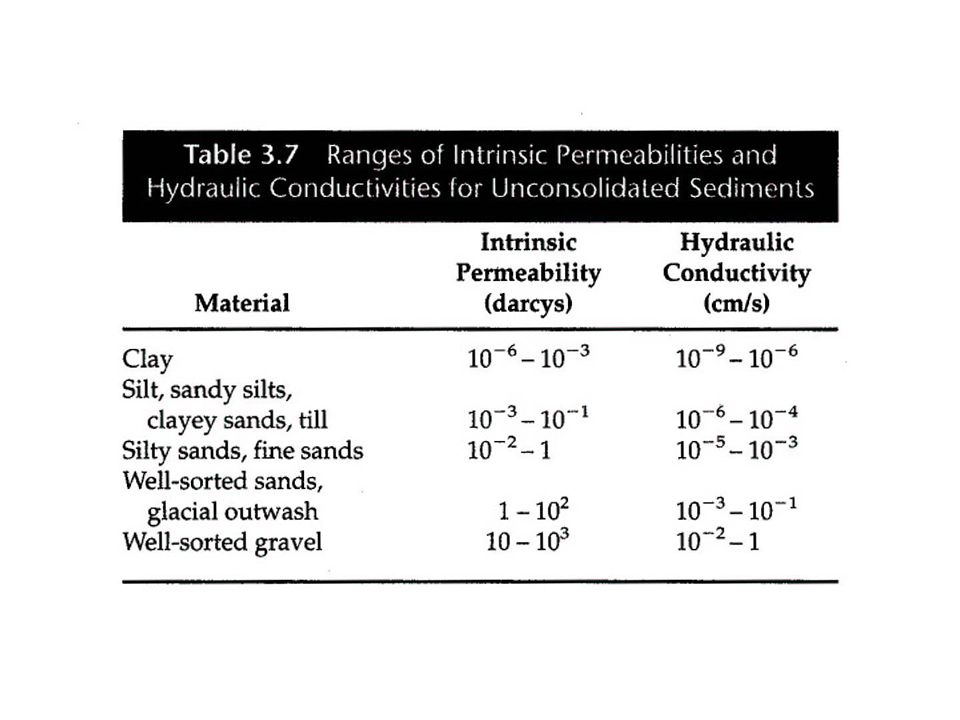
Intrinsic Permeability
Intrinsic permeability Ki = Cd2 (L2). K = Ki (γ/μ) or K = Ki (ρg/ μ) Petroleum industry 1 Darcy = unit of intrinsic permeability Ki 1 darcy = 1 cP x 1 cm3/s / (1 atm/ 1 cm). cP – centipoise dyn s/cm2 atm – atmospheric pressure – x 106 dyn/cm2 1 darcy = 9.87 x 10⁻⁹ cm2 ~ 10-8 cm2
. K = Ki (γ/μ) or K = Ki (ρg/ μ) Petroleum industry 1 Darcy = unit of intrinsic permeability Ki. 1 darcy = 1 cP x 1 cm3/s / (1 atm/ 1 cm). cP – centipoise dyn s/cm2. atm – atmospheric pressure – x 106 dyn/cm2. 1 darcy = 9.87 x 10⁻⁹ cm2 ~ 10-8 cm2.")
29
Factors affecting permeability of sediments
Grain size increases permeability increases. S. Dev. Of particle size increase poor sorting => permeability decrease. Coarse samples show a greater decrease of permeability as S. Dev. Of particle size increases. Unimodal samples (one dominant size) vs. bimodal samples.
 vs. bimodal samples.")
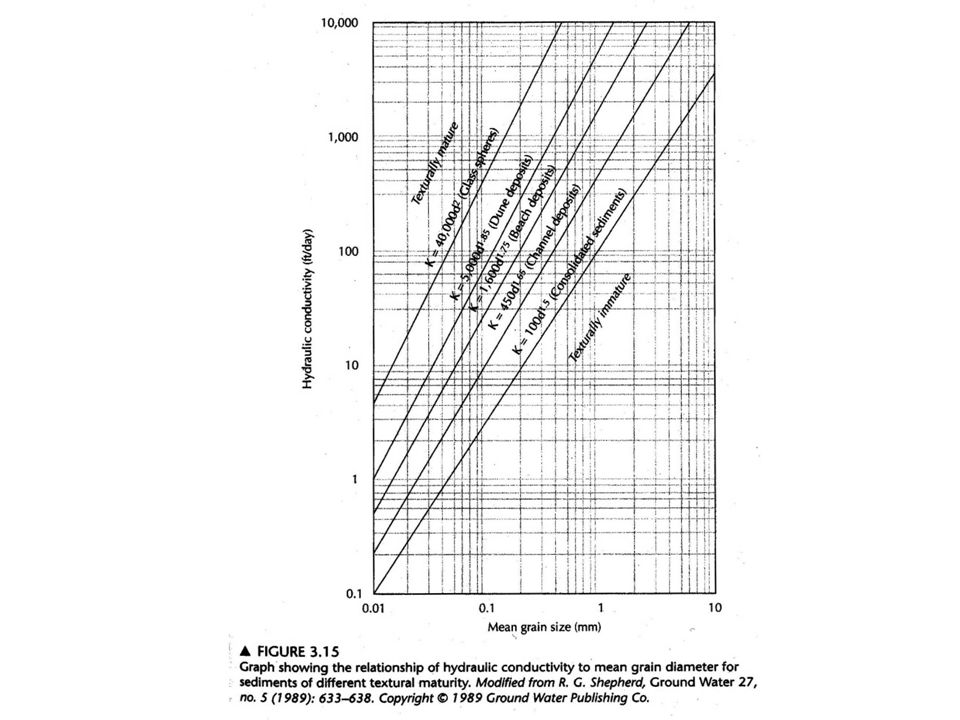
31
Hazen method Estimate hydraulic conductivity in sandy sediments.
K = C(d10)2. K = hydraulic conductivity. d10 = effective grain size (0.1 – 3.0 mm). C = coefficient (see table on P 86).
2. K = hydraulic conductivity. d10 = effective grain size (0.1 – 3.0 mm). C = coefficient (see table on P 86).")
33
Hazen method (General)
K = C(d50)j. K = hydraulic conductivity. d50 = effective grain size (mm). C = coefficient. j = an exponent (1.5 – 2).
j. K = hydraulic conductivity. d50 = effective grain size (mm). C = coefficient. j = an exponent (1.5 – 2).")
37
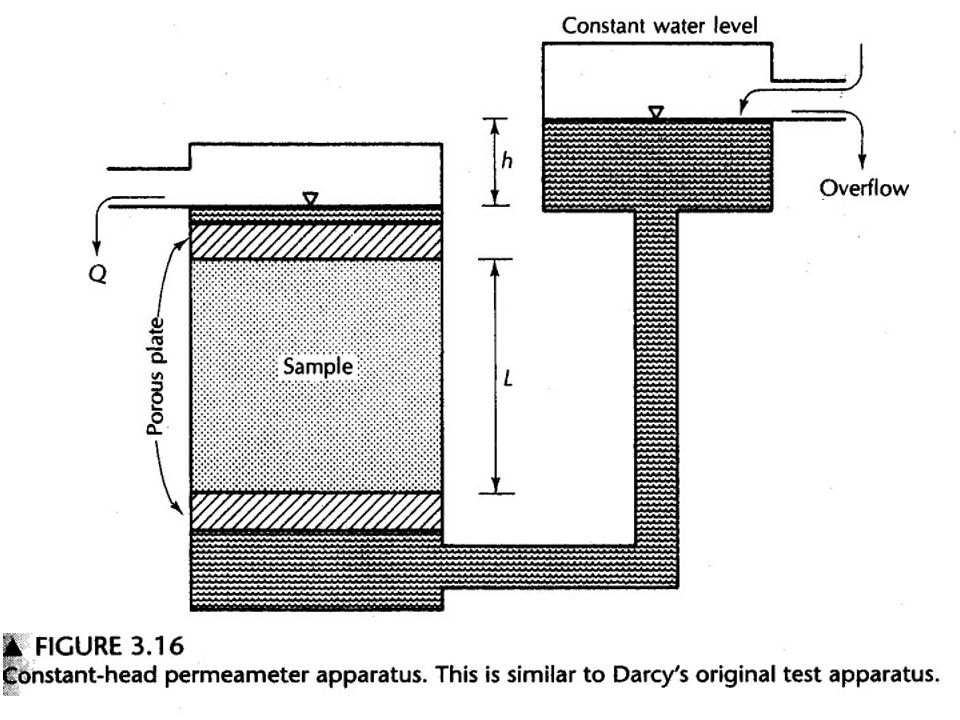
Permeameters Constant-head permeameter Qt = -[KAt(ha-hb)]/L.
K = VL/Ath. V = volume of water discharging in time. L = length of the sample. A = cross-sectional area of sample. h = hydraulic head. K = hydraulic conductivity
![Permeameters Constant-head permeameter Qt = -[KAt(ha-hb)]/L.](http://slideplayer.com/slide/7057540/24/images/37/Permeameters+Constant-head+permeameter+Qt+%3D+-%5BKAt%28ha-hb%29%5D%2FL..jpg "K = VL/Ath. V = volume of water discharging in time. L = length of the sample. A = cross-sectional area of sample. h = hydraulic head. K = hydraulic conductivity.")
39
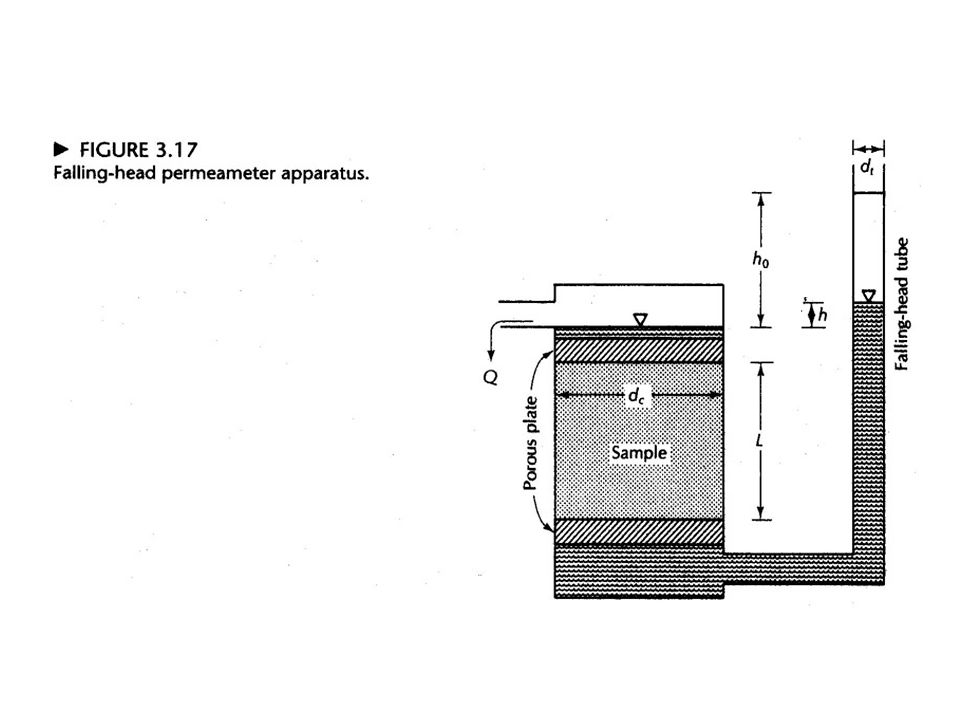
Falling head permeameter
K = [dt2L/dc2t]ln(h0/h). K = Hydraulic conductivity. L = sample length. h0 = initial head in the falling tube. h = final head in the falling tube. t = time that it takes for head to go from h0 to h. dt = inside diameter of falling head tube. dc = inside diameter of sample chamber.
. K = Hydraulic conductivity. L = sample length. h0 = initial head in the falling tube. h = final head in the falling tube. t = time that it takes for head to go from h0 to h. dt = inside diameter of falling head tube. dc = inside diameter of sample chamber.")
40
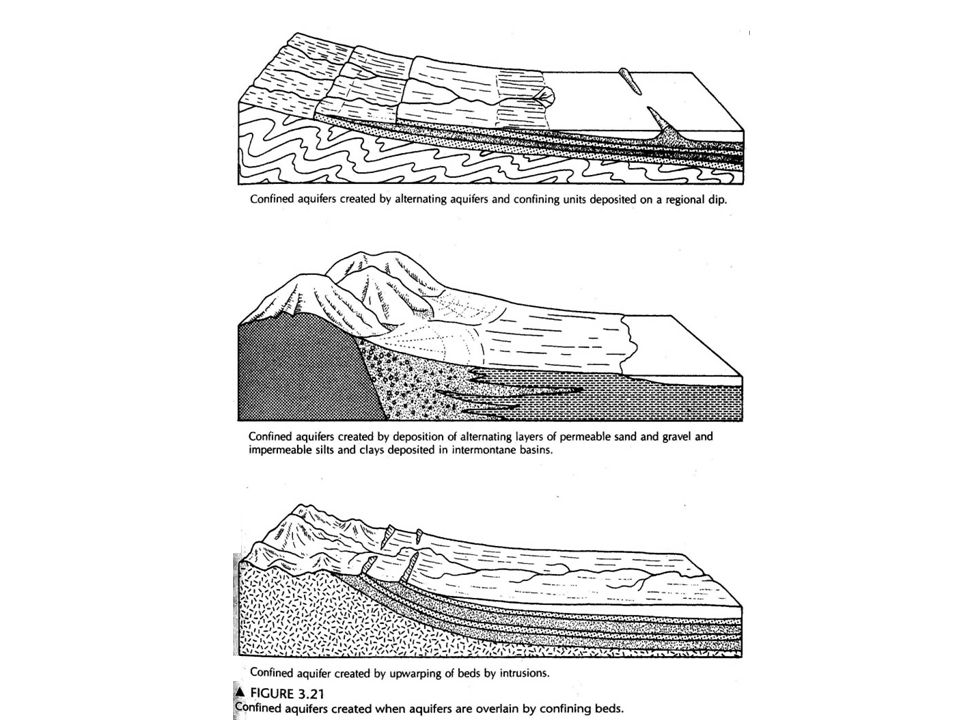
Aquifer Aquifer – geologic unit that can store and transmit water at rates fast enough to supply amounts to wells. Usually, intrinsic permeability > 10-2 Darcy. Confining layer – unit with little or no permeability … < 10-2 Darcy. aquifuge – absolutely impermeable unit. aquitard - a unit can store and transmit water slowly. Also called leaky confining layer. Raritan formation on Long Island. -- all these definitions are in a relative sense.

41
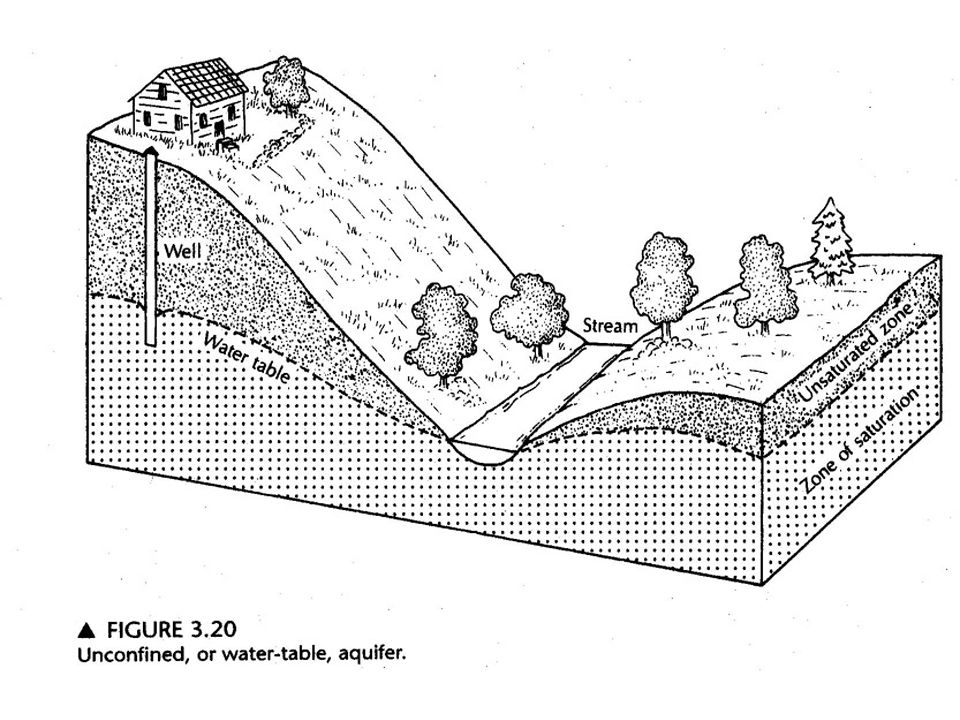
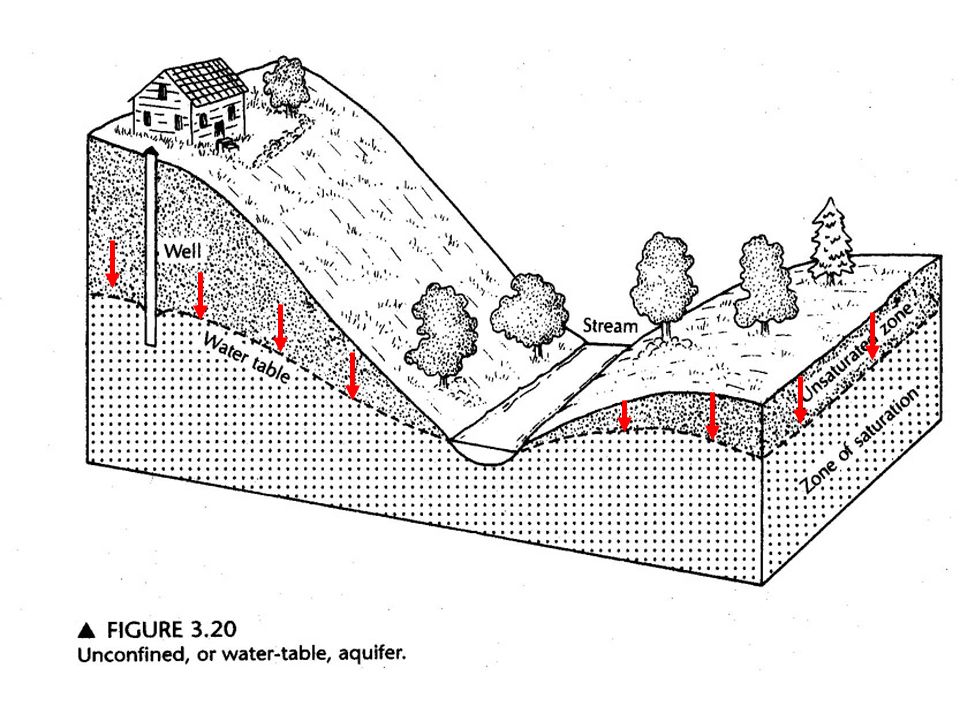
Aquifer – Cont. Unconfined aquifer – water-table aquifer.

44
Aquifer – Cont. Unconfined aquifer. Confined or artesian aquifers.

45
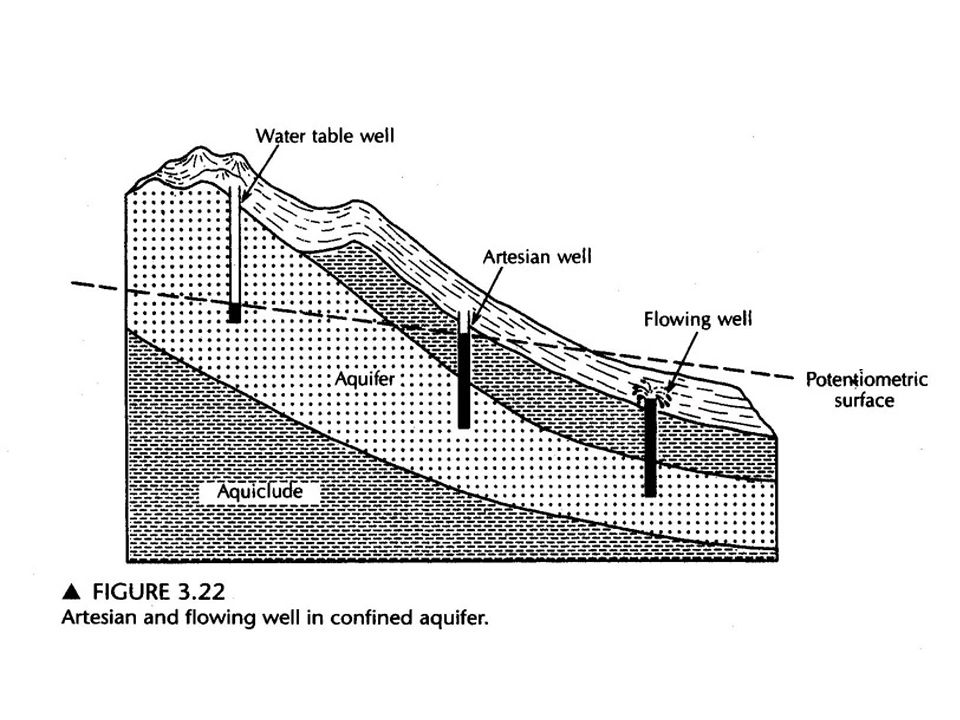
Aquifer – Cont. Unconfined aquifer. Confined or artesian aquifers.
Potentiometric surface – surface at which water will rise in a well cased to the aquifer.

48
Aquifer – Cont. Unconfined aquifer. Confined or artesian aquifers.
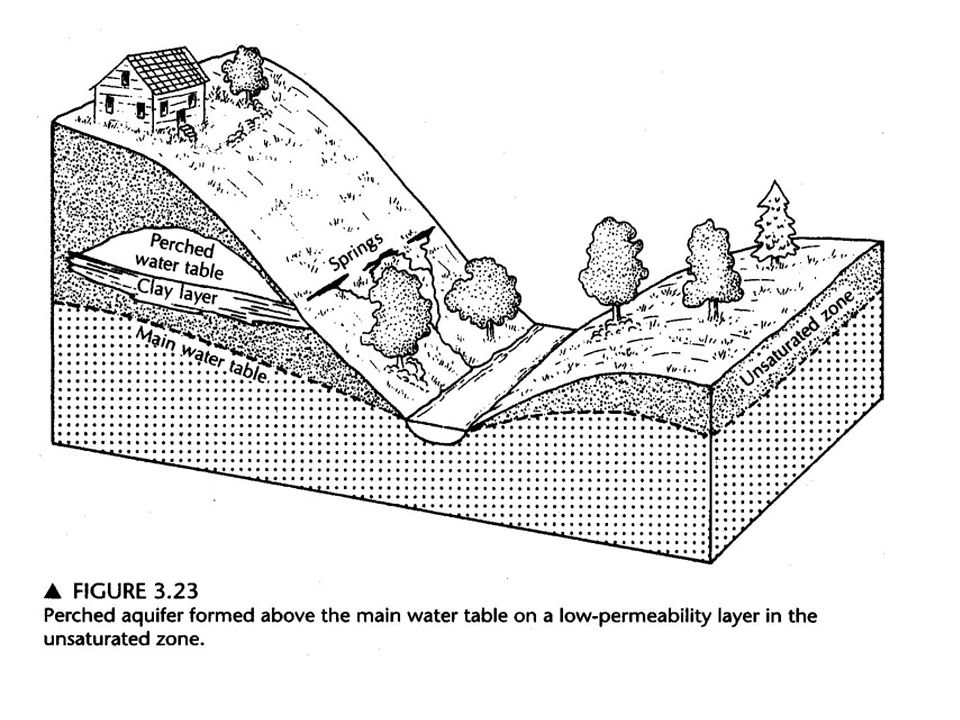
Potentiometric surface – surface at which water will rise in a well cased to the aquifer. Perched aquifer.

50
Aquifer

51
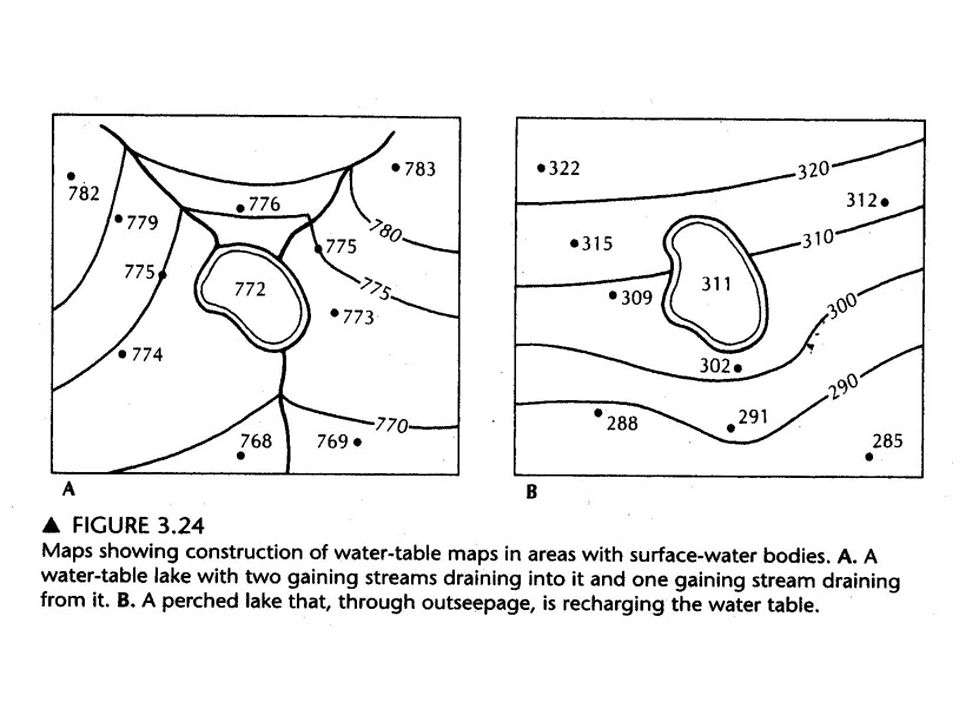
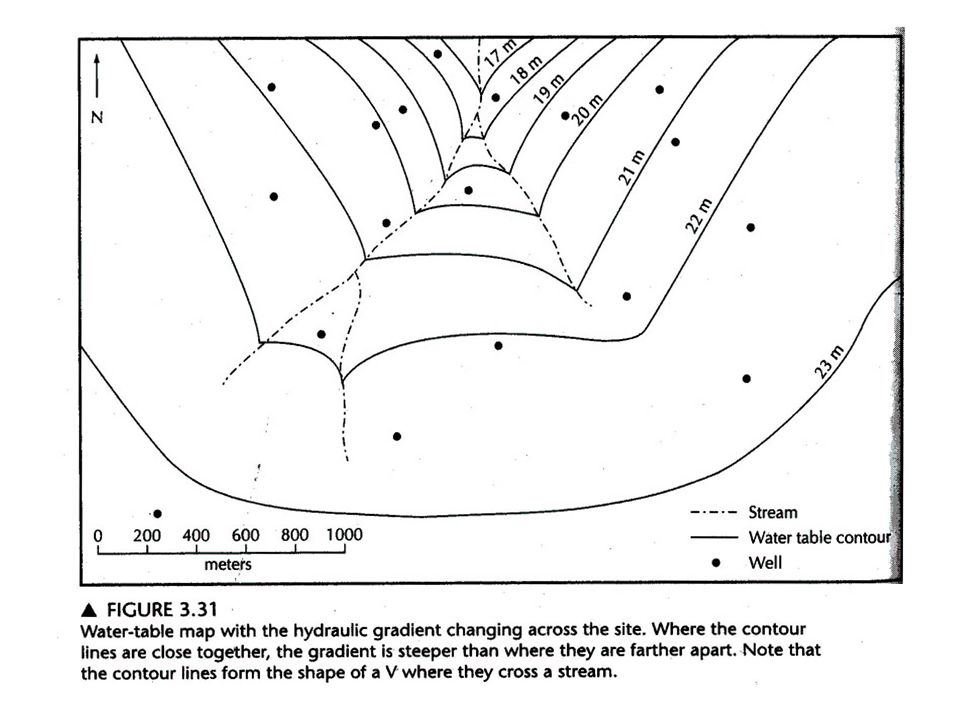
Water table Water table map – unconfined aquifer.
Rivers, lakes as reference Contouring – use topographic information. Contours V-upstream for gaining streams. Contours bend downstream for losing streams.

53
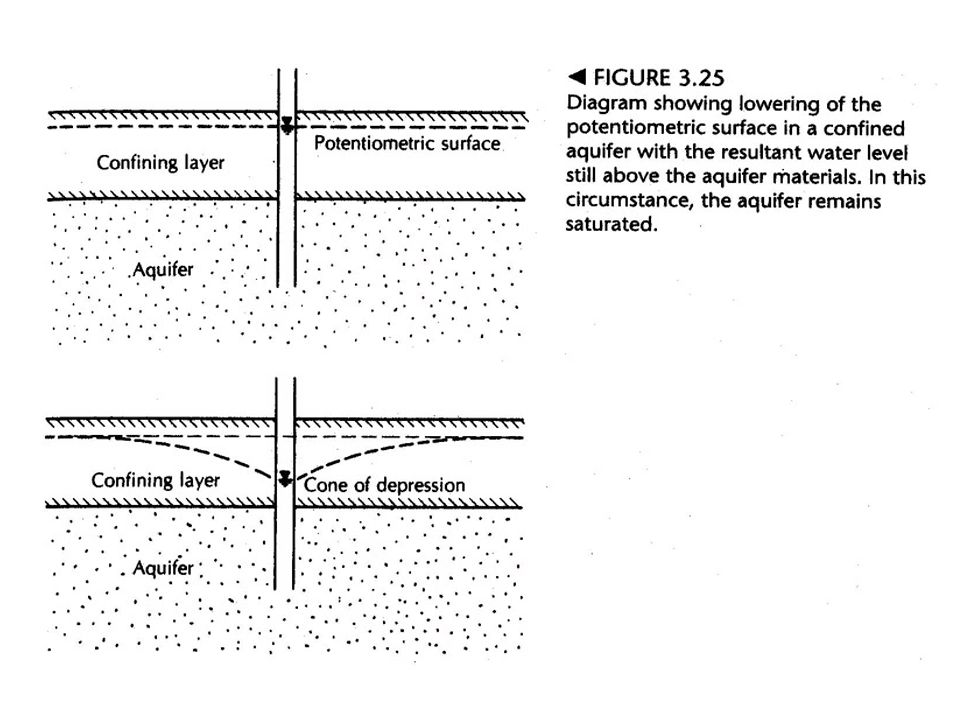
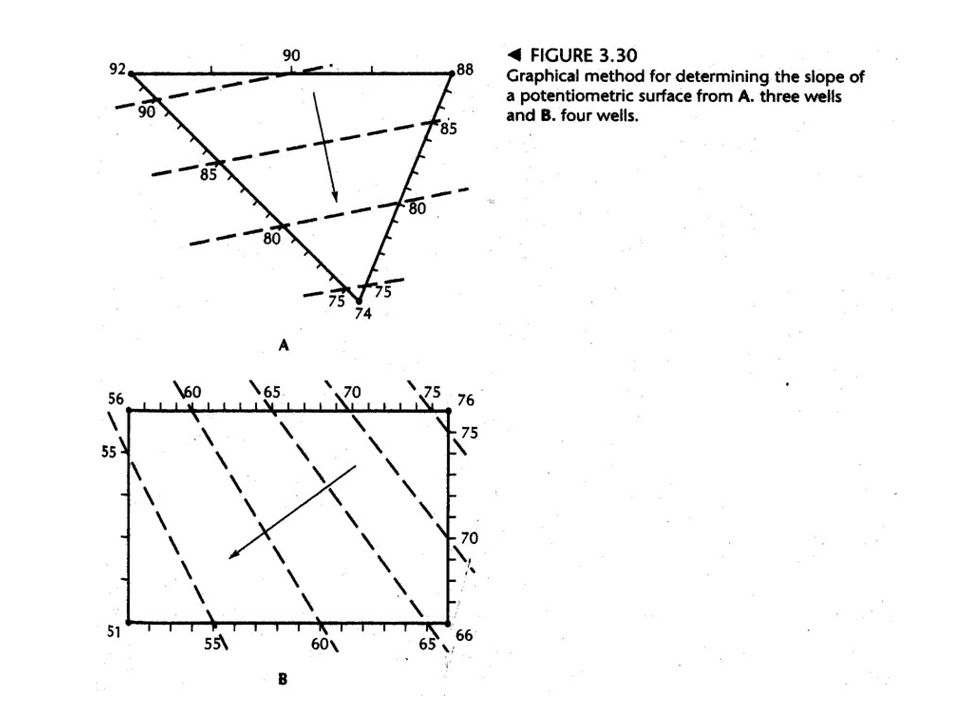
Potentiometric surface maps
Potentiometric surface map – confined aquifer. Not influenced by topography, surface water features, river

54
Transmissivity The amount of water that can be transmitted horizontally through a unit width by the full saturated thickness of the aquifer under a hydraulic gradient of 1. T = bK T = transmissivity. b = saturated thickness. K = hydraulic conductivity. Multilayer => T1 + T2 + … + Tn

55
Compressibility and Effective Stress
σT = σe + P σT = total stress produced by weight of overlying rock and water. P = fluid pressure. σe = effective stress (actual stress borne by aquifer skeleton).
.")
56
Changes in Stress dσT = dσe + dP => change in total stress produces change in effective stress and pressure. Confined aquifer => change in pressure but very little change in thickness of saturated water column => dP = - dσe

57
Bulk Modulus = (DP/Q) … where Q = dilatation = DV/V and P = pressure
 … where Q = dilatation = DV/V and P = pressure")
58
Aquifer Compressibility
Reduction in pressure P => effective stress will increase => compaction of aquifer skeleton. Consolidation depends on aquifer compressibility α. α = [-db/b]/dσe = [db/b]/dP b = original aquifer thickness, db = change in aquifer thickness.

60
Elasticity Change in pressure due to change in head affects mineral grain arrangement and water density => elasticity. Water contracts as pressure increases and expands as pressure decreases. Decline in head => aquifer skeleton compresses => reduces effective porosity => expels water. Additional water expels as water expands due to pressure drop.

61
Specific Storage Specific storage Ss = amount of water per unit volume stored or expelled owing to compressibility of mineral skeleton and pore water per unit change in head (1/L). Ss = ρwg(α+nβ) α = compressibiliy of aquifer skeleton. n = porosity. β = compressibility of water.
. Ss = ρwg(α+nβ) α = compressibiliy of aquifer skeleton. n = porosity. β = compressibility of water.")
62
Storativity When head of saturated aquifer or confining unit changes => water is stored or expelled. Storage coefficient = volume of water that permeable unit will absorb or expel per unit surface area per unit change in head Storage coefficient or storativity is dimensionless.

63
Storativity of confined Unit
S = b Ss Ss = specific storage. b = aquifer thickness. All water released in confined, saturated aquifer comes from compressibility of mineral skeleton and pore water.

64
Storativity in Unconfined Unit
Changes in saturation associated with changes in storage. Storage or release depends on specific yield Sy and specific storage Ss. S = Sy + b Ss

65
Volume of water drained from aquifer
Vw = SAdh Vw = volume of water drained. S = storativity (dimensionless). A = area overlying drained aquifer. dh = average decline in head.
. A = area overlying drained aquifer. dh = average decline in head.")
66
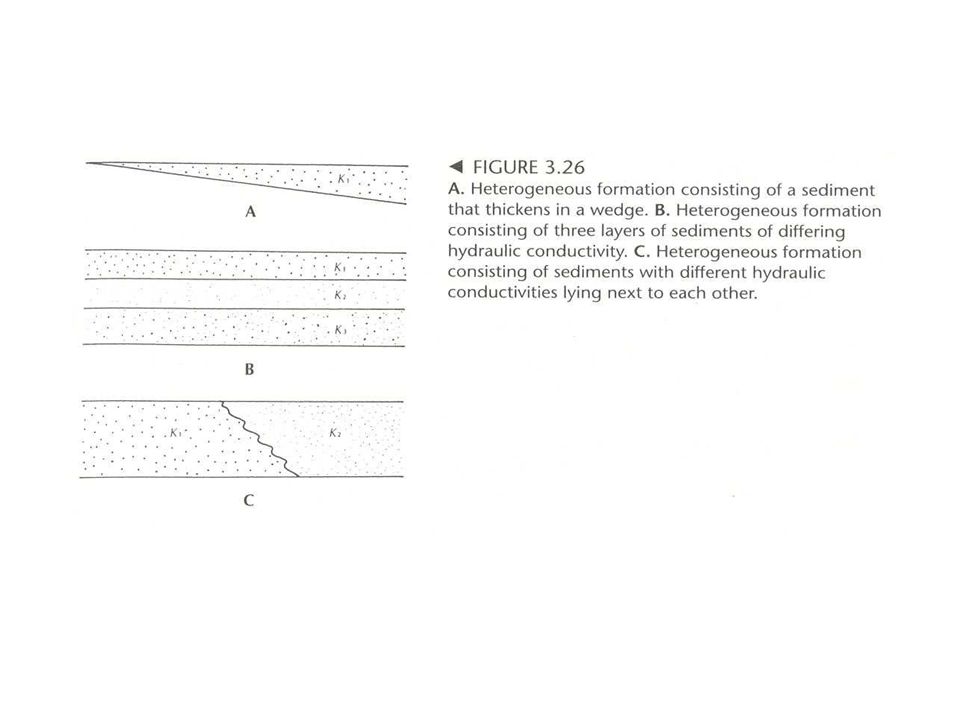
Homogeneity and Isotropy
Homogeneous – same properties – hydraulic conductivity, specific storage, specific yield – at all locations. Heterogeneous – hydraulic properties change spatially.

68
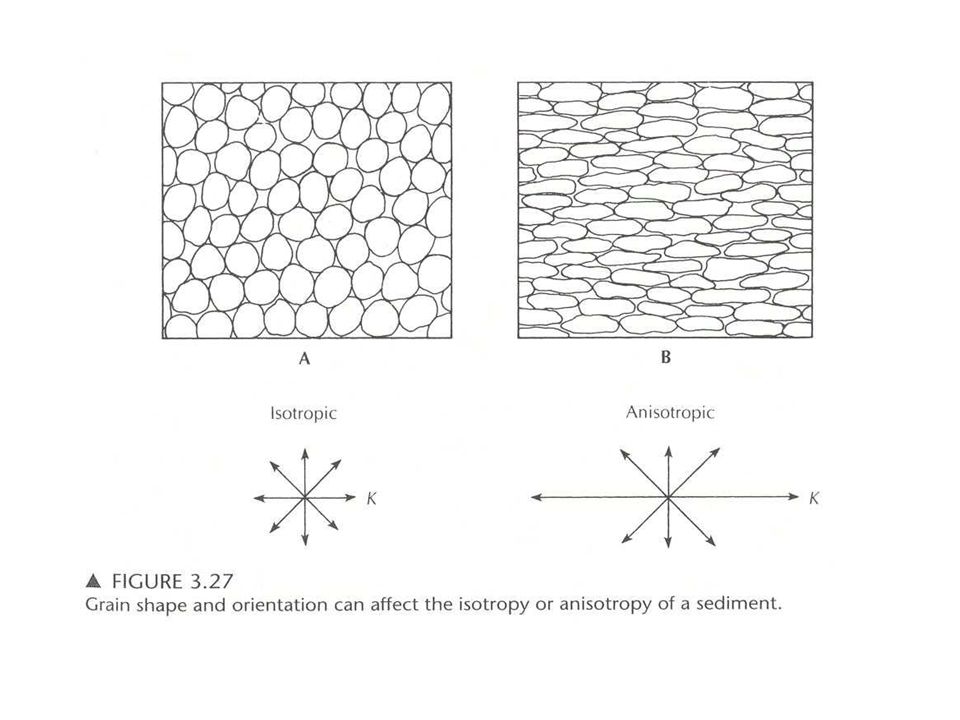
Isotropic and Anisotropic
Isotropic – same intrinsic permeability in all directions. Anisotropic – direction dependent.

70
High K K = 0

71
Average horizontal conductivity:
Kh avg = m=1,n (Khmbm/b) Kv avg Kh avg Average vertical conductivity: Kv avg = b / m=1,n (bm /Kvm)
 Kv avg. Kh avg. Average vertical conductivity: Kv avg = b / m=1,n (bm /Kvm)")
73
Grad h = [(dh/dx)2 + (dh/dy)2]0.5
θ = arctan ((dh/dy)/(dh/dx)) dh/dy θ O dh/dx X
![Grad h = [(dh/dx)2 + (dh/dy)2]0.5](http://slideplayer.com/slide/7057540/24/images/73/Grad+h+%3D+%5B%28dh%2Fdx%292+%2B+%28dh%2Fdy%292%5D0.5.jpg "θ = arctan ((dh/dy)/(dh/dx)) dh/dy. θ. O. dh/dx. X.")
77
Aquifer Properties: Porosity, specific yield, specific retention.
Potential: Transmissivity, storativity. Types: confined, unconfined. Hydraulic conductivity, Physical Laws controlling water transport.

78
Specific Yield and Retention
Specific yield – Sy: ratio of volume of water that drains from a saturated rock owing to the attraction of gravity to the total volume of the rock. Specific retention – Sr: ratio of the volume of water in a rock can retain against gravity drainage to the total volume of the rock. n = Sy + Sr. Sr increases with decreasing grain size.

79
Darcy’s Experiment Q ha – hb. Q 1/L.
Darcy’s Law: Q = -KA(ha-hb)/L. Q = -KA(dh/dl). dh/dl = Hydraulic gradient. dh = change in head between two points separated by small distance dl.
/L. Q = -KA(dh/dl). dh/dl = Hydraulic gradient. dh = change in head between two points separated by small distance dl.")
80
Hydraulic conductivity
K = hydraulic conductivity (L/T). K is also referred to as the coefficient of permeability. K = -Q[A(dh/dl)] [ L3/T/[L2(L/L)] = L/T] V = Q/A = -K(dh/dl) = specific discharge or Darcian velocity.
. K is also referred to as the coefficient of permeability. K = -Q[A(dh/dl)] [ L3/T/[L2(L/L)] = L/T] V = Q/A = -K(dh/dl) = specific discharge or Darcian velocity.")
81
Factors influencing hydraulic conductivity
Porous medium. Fluid passing through the medium.

82
Factors influencing hydraulic conductivity
Q d2 Q γ. Q 1/μ. d = mean pore diameter. γ = specific weight. μ = viscosity.

83
Intrinsic Permeability
Intrinsic permeability Ki = Cd2 (L2). K = Ki (γ/μ) or K = Ki (ρg/ μ) Petroleum industry 1 Darcy = unit of intrinsic permeability Ki 1 darcy = 1 cP x 1 cm3/s / (1 atm/ 1 cm). cP – centipoise dyn s/cm2 atm – atmospheric pressure – x 106 dyn/cm2 1 darcy = 9.87 x 10⁻⁹ cm2 ~ 10-8 cm2
. K = Ki (γ/μ) or K = Ki (ρg/ μ) Petroleum industry 1 Darcy = unit of intrinsic permeability Ki. 1 darcy = 1 cP x 1 cm3/s / (1 atm/ 1 cm). cP – centipoise dyn s/cm2. atm – atmospheric pressure – x 106 dyn/cm2. 1 darcy = 9.87 x 10⁻⁹ cm2 ~ 10-8 cm2.")
84
Factors affecting permeability of sediments
Grain size increases permeability increases. S. Dev. Of particle size increase poor sorting => permeability decrease. Coarse samples show a greater decrease of permeability as S. Dev. Of particle size increases. Unimodal samples (one dominant size) vs. bimodal samples.
 vs. bimodal samples.")
85
Aquifer – Cont. Unconfined aquifer. Confined or artesian aquifers.

86
Aquifer

87
Water table Water table map – unconfined aquifer.
Rivers, lakes as reference Contouring – use topographic information. Contours V-upstream for gaining streams. Contours bend downstream for losing streams.

88
Potentiometric surface maps
Potentiometric surface map – confined aquifer. Not influenced by topography, surface water features, river

Similar presentations


>")


