Download presentation
Presentation is loading. Please wait.

1
Chapter 12 Atomic X-Ray Spectroscopy

2
is based on measurement of emission,
X-ray spectroscopy, like optical spectroscopy, is based on measurement of emission, absorption, scattering, fluorescence, and diffraction of electromagnetic radiation. X-ray fluorescence and X-ray absorption methods are widely used for the qualitative and quantitative determination of all elements in the periodic table having atomic numbers greater than that of sodium. With special equipment, elements with atomic numbers in the range of 5 to 10 can also be determined.

3
12A FUNDAMENTAL PRINCIPLES

4
X-Rays are short wavelength electromagnetic radiation produced by the deceleration of high-energy electrons or by electronic transitions of electrons in the inner orbitals of atoms.

5
12A-1 Emission of X-Rays

6
For analytical purposes, X-rays are obtained in four ways: 1
For analytical purposes, X-rays are obtained in four ways: 1. by bombardment of a metal with a beam of high-energy electrons, 2. by exposure of a substance to a primary beam of X-rays in order to generate a secondary beam of X-ray fluorescence, 3. by use of a radioactive source whose decay process results in X-ray emission, 4. from a synchrotron radiation source.

7
Continuum Spectra from Electron Beam Sources

8
V: accelerating voltage e: charge on electron
Ee = E’e + h At o, E’e = 0 h0 = hc/o = Ve V: accelerating voltage e: charge on electron l0 = 12,398/V Duane-Hunt Law Independent of material Related to acceleration voltage E l0 FIGURE Distribution of continuum radiation from an X-ray tube with a tungsten target. The numbers above the curves indicate the accelerating voltages.

9
FIGURE 12-2 Line spectrum for an X-ray with a molybdenum target.
From electron transitions involving inner shells Atomic number >23 2 line series K and L E K> EL Atomic number < 23 K only A minimum acceleration voltage is required for FIGURE Line spectrum for an X-ray with a molybdenum target. A minimum acceleration voltage required for each element increases with atomic number

10
Line Spectra from Electron Beam Sources

12
FIGURE Partial energy level diagram showing common transitions producing X-rays. The most intense lines are indicated by the wider arrows.

14
Line Spectra from Fluorescent Sources
Spectra from Radioactive Sources X-Radiation is often a product of radioactive decay processes.

15
TABLE 12-2 Common Radio isotopic Sources for X-ray Spectroscopy

17
12A-2 Absorption Spectra When a beam of X-rays is passed through a thin layer of matter, its intensity or power is generally diminished as a consequence of absorption and scattering. The absorption spectrum of an element, like its emission spectrum, is simple and consists of a few well-defined absorption peaks.

18
The Absorption Process
The Mass Absorption Coefficient

19
X-ray absorption spectra for lead and silver.
Ln P0/P = μX μ is the linear absorption coefficient is characteristic of the Element and # of atoms in the path of the beam. X is sample thickness Ln P0/P = μMηX η is density of the sample μM is mass absorption coefficient FIGURE 12-5 X-ray absorption spectra for lead and silver.

20
12A-3 X-ray Fluorescence

21
12A-4 Diffraction of X-rays

22
Bragg's Law

24
12B INSTRUMENT COMPONENTS

25
12B-1 Sources

26
The X-ray Tube Radioisotopes Secondary Fluorescent Sources

27
Determining the energy of the X-Ray
100KV! Controlling the intensity of X-Ray

28
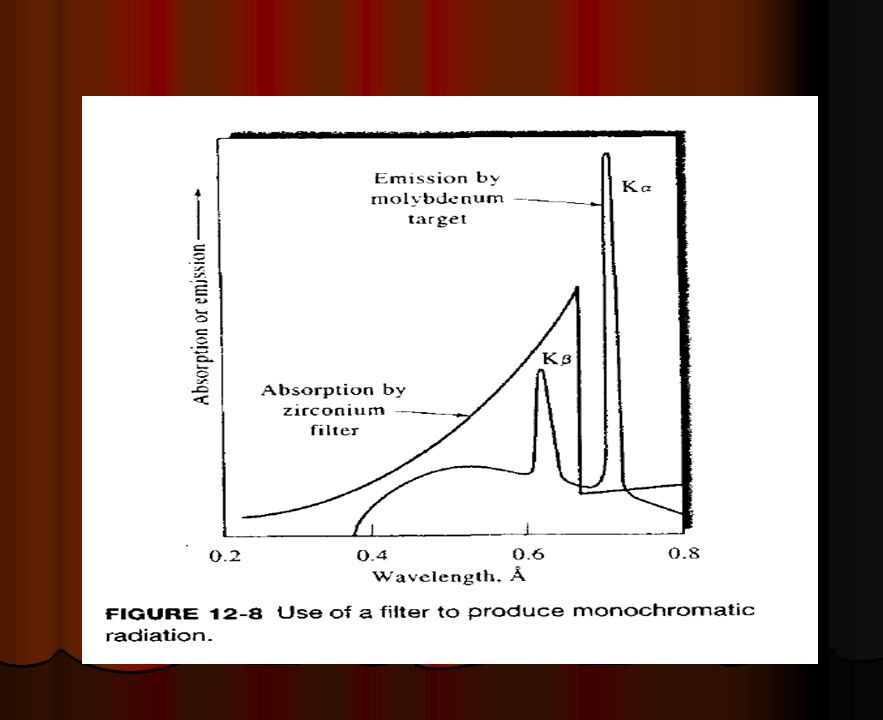
12B-2 Filters for X-rays

30
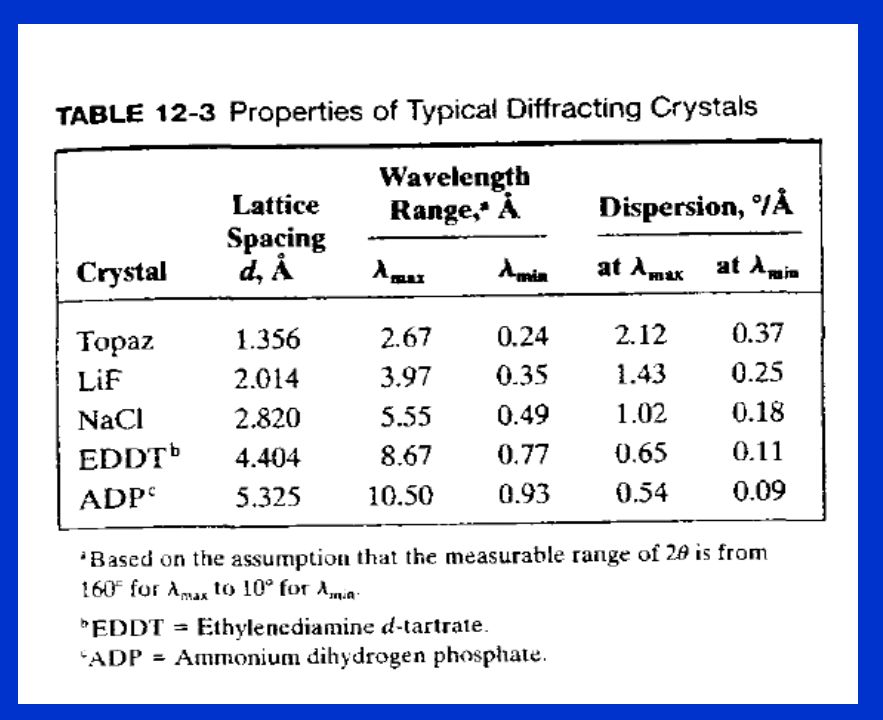
12B-3 X-ray Monochromators

31
FIGURE 12-9 An X-ray monochromator and detector.
Note that the angle of the detector with respect to the beam (2ө) is twice that of the crystal face. For absorption analysis, the source is an X-ray tube and the sample is located in the beam as shown. For emission measurements, the sample becomes a source of X-ray fluorescence as shown in the insert.
 is twice that of the crystal face. For absorption. analysis, the source is an X-ray tube and the. sample is located in the beam as shown. For emission. measurements, the sample becomes a source of X-ray. fluorescence as shown in the insert.")
33
12B-4 X-ray Transducers and Signal Processors

34
Photon Counting Gas-Filled Transducers The Geiger Tube

37
Proportional Counters Ionization Chambers Scintillation Counters
Semiconductor Transducers

38
FIGURE 12-12 Vertical cross section of a
lithium-drifted silicon detector for X-rays and radiation from radioactive sources.

39
Distribution of Pulse-Heights from X-ray Transducers

40
12B-5 Signal Processors

41
Pulse-Height Selectors
Pulse-Height Analyzers Scalers and Counters

43
12C X-RAY FLUORESCENCE METHODS

44
12C-1 Instruments

45
Wavelength-Dispersive Instruments
Energy-Dispersive Instruments

46
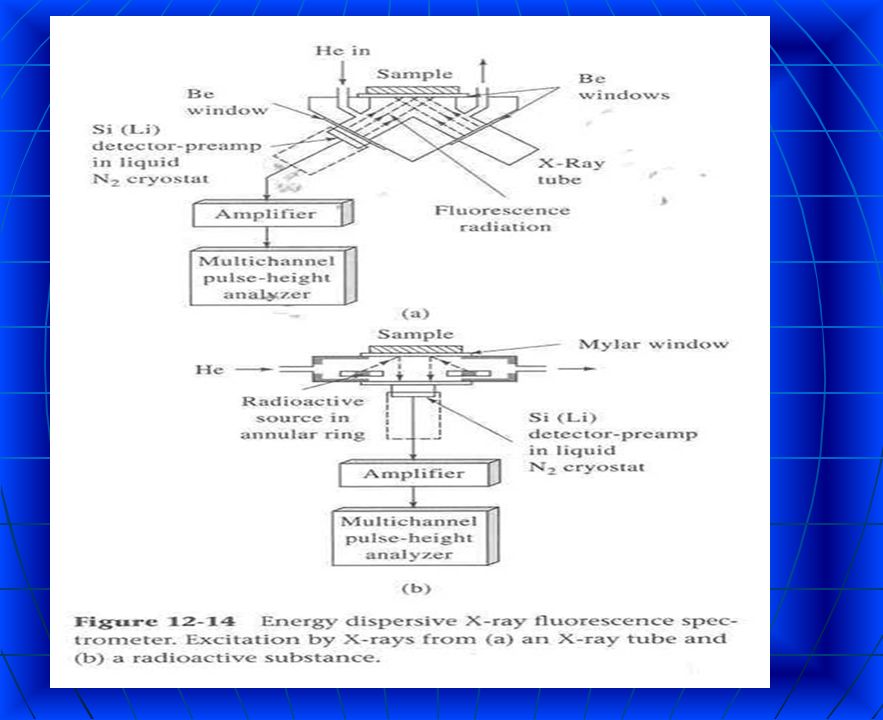
FIGURE 12-14 Energy-dispersive X-ray fluorescence spectrometer
FIGURE Energy-dispersive X-ray fluorescence spectrometer. Excitation by X-rays from (a) an X-ray tube and (b) a radioactive substance
 an X-ray tube and (b) a radioactive substance.")
48
FIGURE 12-15

49
Semi quantitative Analysis
12C-2 Qualitative and Semi quantitative Analysis

50
FIGURE X-Ray fluorescence spectrum for a genuine bank note recorded with a wave- length dispersive spectrometer.

51
FIGURE Spectrum of an iron sample obtained with an energy-dispersive instrument with a Rh anode X-ray tube source. The numbers above the peaks are energies in keV. (Reprinted with permission from J. A. Cooper, Amer. Lab., 1976,8 (11),44. Copyright 1976 by International Scientific Communications, Inc.)
,44. Copyright 1976 by International Scientific Communications, Inc.).")
52
12C-3 Quantitative Analysis

53
Calibration Against Standards Use of Internal Standards
Matrix Effects Calibration Against Standards Use of Internal Standards Dilution of Samples and Standards

54
Some Quantitative Applications of X-ray Fluorescence
Advantages and Disadvantages of X-ray Fluorescence Methods

55
12D X-RAY ABSORPTION METHODS

56
12E X-RAY DIFFRACTION METHODS

57
12E-1 Identification of Crystalline Compounds

58
Automatic Diffractometers
Photographic Recording

59
FIGURE Schematic of (a) a Debye- Scherrer powder camera; (b) the film strip after development. D2, D1 and T indicate positions of the film in the camera.

60
12E-2 Interpretation of Diffraction Patterns

61
12F THE ELECTRON MICROPROBE

Similar presentations


 K = Hot filament cathode A = Tungsten anode U h = Heater Voltage (e.g. 12V) U a = Accelerating.>")
>")


 Pure metal target (Cu) Electrons remover inner-shell electrons from target. Other electrons “fall”>")
 X-Ray Diffraction (XRD) Theory and Analytical Technique.>")


 is a form of electromagnetic radiation. X- rays have a.>")


