Download presentation
Presentation is loading. Please wait.

1
Process & Review: SE-GAP Avian Distribution Models for the Southeast Species in Changing Landscapes Workshop Species in Changing Landscapes Workshop Matt Rubino 1, Steve Williams 1, & Amy Silvano 2 1 Biodiversity and Spatial Information Center, NCSU 2 Alabama GAP Project, Auburn University Matt Rubino 1, Steve Williams 1, & Amy Silvano 2 1 Biodiversity and Spatial Information Center, NCSU 2 Alabama GAP Project, Auburn University

2
Vertebrate Data 608 Species (terrestrial) 253 birds 253 birds Known Range Predicted Habitat Models Presence/Absence Distribution Maps Knowledge Based Information 608 Species (terrestrial) 253 birds 253 birds Known Range Predicted Habitat Models Presence/Absence Distribution Maps Knowledge Based Information
 253 birds 253 birds Known Range Predicted Habitat Models Presence/Absence Distribution Maps Knowledge Based Information 608 Species (terrestrial) 253 birds 253 birds Known Range Predicted Habitat Models Presence/Absence Distribution Maps Knowledge Based Information")
3
SE-GAP Known Range Maps

4
Habitat Text Review Form

5
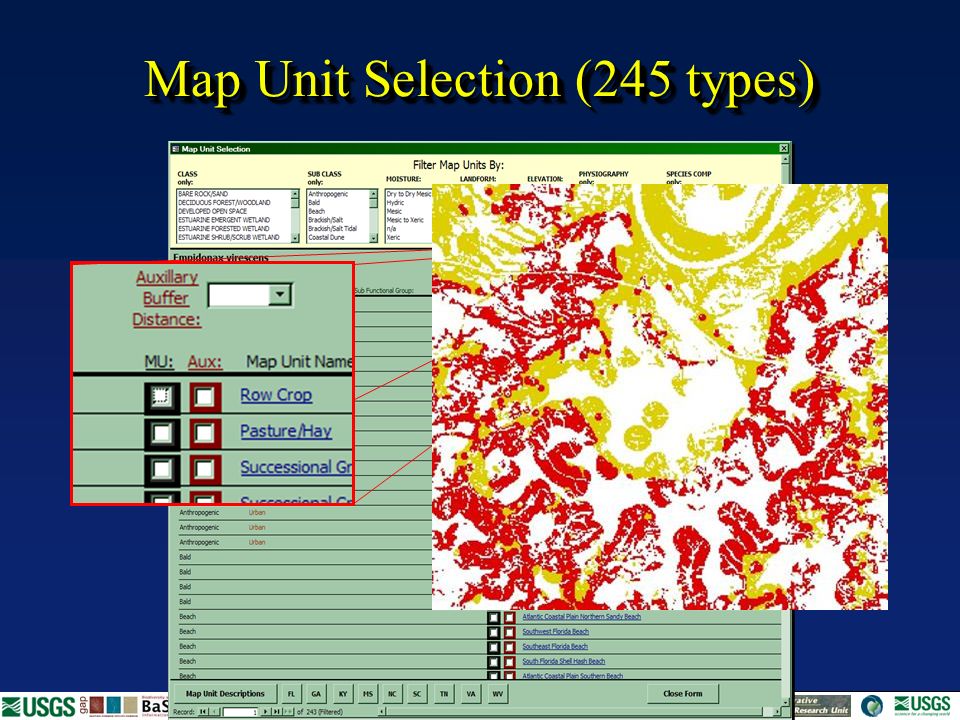
SE-GAP Land Cover Map Units Ecological Systems - NatureServe Matrix, Large Patch, and Linear Types Matrix, Large Patch, and Linear Types Small patch on a case by case basis Small patch on a case by case basis Includes “modifiers” to systems Includes “modifiers” to systems ~174 systems mapped ~174 systems mapped Anthropogenic Classes Plantations, Clearcuts, Mines/Quarries Plantations, Clearcuts, Mines/Quarries Pasture/Hay, Row Crops Pasture/Hay, Row Crops Development, Open Space, Utility Swaths Development, Open Space, Utility Swaths Ecological Systems - NatureServe Matrix, Large Patch, and Linear Types Matrix, Large Patch, and Linear Types Small patch on a case by case basis Small patch on a case by case basis Includes “modifiers” to systems Includes “modifiers” to systems ~174 systems mapped ~174 systems mapped Anthropogenic Classes Plantations, Clearcuts, Mines/Quarries Plantations, Clearcuts, Mines/Quarries Pasture/Hay, Row Crops Pasture/Hay, Row Crops Development, Open Space, Utility Swaths Development, Open Space, Utility Swaths

6
Map Unit Selection (245 types)
")
9
Ancillary Data Form

10
LAND COVER DERIVATIVES DERIVATIVES Patch Size Contiguous: Size, Buffers Size, Buffers Patch Size Contiguous: Size, Buffers Size, Buffers NonContiguous: % in X area % in X areaNonContiguous:

11
Ancillary Data Form LAND COVER DERIVATIVES DERIVATIVES Patch Size Contiguous: Size, Buffers Size, Buffers Patch Size Contiguous: Size, Buffers Size, Buffers NonContiguous: % in X area % in X areaNonContiguous: 50ha minimum contiguous patch

12
Ancillary Data Form LAND COVER DERIVATIVES DERIVATIVES Patch Size Contiguous: Size, Buffers Size, Buffers Patch Size Contiguous: Size, Buffers Size, Buffers NonContiguous: % in X area % in X areaNonContiguous: 50ha minimum contiguous patch

13
Ancillary Data Form LAND COVER DERIVATIVES DERIVATIVES Edge Type: Forest/Open Ecotone Only Forest/Open Ecotone Only F/O + Shrubland/Woodland F/O + Shrubland/Woodland Edge Type: Forest/Open Ecotone Only Forest/Open Ecotone Only F/O + Shrubland/Woodland F/O + Shrubland/Woodland Forest Interior Patch Size Contiguous: Size, Buffers Size, Buffers Patch Size Contiguous: Size, Buffers Size, Buffers EdgeEdge NonContiguous: % in X area % in X areaNonContiguous:

14
Type: Freshwater Only Freshwater Only Brackish/Saltwater Only Brackish/Saltwater Only Type: Freshwater Only Freshwater Only Brackish/Saltwater Only Brackish/Saltwater Only Ancillary Data Form HYDROGRAPHYHYDROGRAPHY Buffer distances: 30, 60, 120, 250, 500, 30, 60, 120, 250, 500, 1000, 2000, 4000, >4k 1000, 2000, 4000, >4k Buffer distances: 30, 60, 120, 250, 500, 30, 60, 120, 250, 500, 1000, 2000, 4000, >4k 1000, 2000, 4000, >4k Velocity: Fast Only, Slow Only Fast Only, Slow OnlyVelocity: SalinitySalinity Stream Flow Type/BufferType/Buffer

15
Ancillary Data Form ROAD DENSITY / URBAN AVOID MASK URBAN AVOID MASK ROAD DENSITY / URBAN AVOID MASK URBAN AVOID MASKLevel: Low, Medium, High Low, Medium, HighLevel: ELEVATIONLANDFORMSELEVATIONLANDFORMS

16
Ancillary Data Form MODELING NOTES

17
Acadian Flycatcher Epidonax virescens Appropriate Vegetation (forested map units)
")
18
Acadian Flycatcher Epidonax virescens Appropriate Vegetation (forested map units) Elevation Mask (< 4000’)
 Elevation Mask (< 4000’)")
19
Acadian Flycatcher Epidonax virescens Appropriate Vegetation (forested map units) Elevation Mask (< 4000’) Proximity to Water Mask (< 200m)
 Elevation Mask (< 4000’) Proximity to Water Mask (< 200m)")
20
SE-GAP Pres./Abs. Distribution Model Prothonotary Warbler Protonotaria citrea

21
Model Assessment Reviewer Agreement with model Need to keep it relatively simple and concise Need to keep it relatively simple and concise Assess major model components and overall model performance Assess major model components and overall model performance Bayesian Belief Network Framework Bayesian Belief Network Framework Reviewer Agreement with model Need to keep it relatively simple and concise Need to keep it relatively simple and concise Assess major model components and overall model performance Assess major model components and overall model performance Bayesian Belief Network Framework Bayesian Belief Network Framework

22
A Priori Rankings generated by Modelers

23
Reviewer Agreement with Model 1.The light green shaded area is an accurate representation of the known range extent of this species.

24
Reviewer Agreement with Model 1.The light green shaded area is an accurate representation of the known range extent of this species. 2.The parameters used to model the predicted distribution of this species accurately represent its habitat requirements in the southeastern United States. 1.The light green shaded area is an accurate representation of the known range extent of this species. 2.The parameters used to model the predicted distribution of this species accurately represent its habitat requirements in the southeastern United States.

25
Reviewer Agreement with Model 1.The light green shaded area is an accurate representation of the known range extent of this species. 2.The parameters used to model the predicted distribution of this species accurately represent its habitat requirements in the southeastern United States. 3.The spatial data adequately represent the species' habitat requirements. 1.The light green shaded area is an accurate representation of the known range extent of this species. 2.The parameters used to model the predicted distribution of this species accurately represent its habitat requirements in the southeastern United States. 3.The spatial data adequately represent the species' habitat requirements.

26
Reviewer Agreement with Model 1.The light green shaded area is an accurate representation of the known range extent of this species. 2.The parameters used to model the predicted distribution of this species accurately represent its habitat requirements in the southeastern United States. 3.The spatial data adequately represent the species' habitat requirements. 4.The red pixels on the map adequately represent the distribution of this species' habitat within the identified range extent. 1.The light green shaded area is an accurate representation of the known range extent of this species. 2.The parameters used to model the predicted distribution of this species accurately represent its habitat requirements in the southeastern United States. 3.The spatial data adequately represent the species' habitat requirements. 4.The red pixels on the map adequately represent the distribution of this species' habitat within the identified range extent.

27
Reviewer Agreement with Model 1.The light green shaded area is an accurate representation of the known range extent of this species. 2.The parameters used to model the predicted distribution of this species accurately represent its habitat requirements in the southeastern United States. 3.The spatial data adequately represent the species' habitat requirements. 4.The red pixels on the map adequately represent the distribution of this species' habitat within the identified range extent. 5.The published literature adequately documents the breeding habitat requirements for this species in the southeastern United States. 1.The light green shaded area is an accurate representation of the known range extent of this species. 2.The parameters used to model the predicted distribution of this species accurately represent its habitat requirements in the southeastern United States. 3.The spatial data adequately represent the species' habitat requirements. 4.The red pixels on the map adequately represent the distribution of this species' habitat within the identified range extent. 5.The published literature adequately documents the breeding habitat requirements for this species in the southeastern United States.

28
Reviewer Agreement with Model 1.The light green shaded area is an accurate representation of the known range extent of this species. 2.The parameters used to model the predicted distribution of this species accurately represent its habitat requirements in the southeastern United States. 3.The spatial data adequately represent the species' habitat requirements. 4.The red pixels on the map adequately represent the distribution of this species' habitat within the identified range extent. 5.The published literature adequately documents the breeding habitat requirements for this species in the southeastern United States. 6.I am an expert in the natural history of this species. 1.The light green shaded area is an accurate representation of the known range extent of this species. 2.The parameters used to model the predicted distribution of this species accurately represent its habitat requirements in the southeastern United States. 3.The spatial data adequately represent the species' habitat requirements. 4.The red pixels on the map adequately represent the distribution of this species' habitat within the identified range extent. 5.The published literature adequately documents the breeding habitat requirements for this species in the southeastern United States. 6.I am an expert in the natural history of this species.

29
Decision to Revise Known Range Known Range Model Parameters Model Parameters Pred. Dist. Performance Pred. Dist. Performance Ample Literature Spatial Data Spatial Data Bayesian Belief Network Weighted Component and Composite Score for Model 1 - Strongly Disagree 5 - Strongly Agree Reviewer Self-Confidence 1 - Strongly Disagree 5 - Strongly Agree 1 - Strongly Disagree 5 - Strongly Agree 1 - Strongly Disagree 5 - Strongly Agree 1 - Strongly Disagree 5 - Strongly Agree 1 - Strongly Disagree 5 - Strongly Agree

Similar presentations


>")


