Download presentation
Presentation is loading. Please wait.

1
Global Precipitation Analyses and Reanalyses Phil Arkin, Cooperative Institute for Climate Studies Earth System Science Interdisciplinary Center, University of Maryland

2
Scientific Issues Precipitation matters! Precipitation matters! Fresh water for people, agriculture and industry Fresh water for people, agriculture and industry Extremes, both droughts and floods, have great impact on societies Extremes, both droughts and floods, have great impact on societies One of the most anticipated manifestations of global change One of the most anticipated manifestations of global change Precipitation is an index of the vigor of the hydrological cycle – generally expected to change with global temperature increases Precipitation is an index of the vigor of the hydrological cycle – generally expected to change with global temperature increases We can “measure” (estimate quantitatively) precipitation over the globe We can “measure” (estimate quantitatively) precipitation over the globe Fundamental questions: Fundamental questions: How much precipitation occurs? (i.e. What is the strength of the global hydrological cycle?) How much precipitation occurs? (i.e. What is the strength of the global hydrological cycle?) How does precipitation vary with time and space? (i.e. How is the hydrological cycle changing? What are the important characteristics of its variability?) How does precipitation vary with time and space? (i.e. How is the hydrological cycle changing? What are the important characteristics of its variability?)
 precipitation over the globe We can measure (estimate quantitatively) precipitation over the globe Fundamental questions: Fundamental questions: How much precipitation occurs. (i.e. What is the strength of the global hydrological cycle ) How much precipitation occurs. (i.e. What is the strength of the global hydrological cycle ) How does precipitation vary with time and space. (i.e. How is the hydrological cycle changing. What are the important characteristics of its variability ) How does precipitation vary with time and space. (i.e. How is the hydrological cycle changing. What are the important characteristics of its variability ).")
3
Observing Precipitation Not uniformly well defined – generally speaking we attempt to obtain spatial and/or temporal means, but rigorous definitions are not typical Not uniformly well defined – generally speaking we attempt to obtain spatial and/or temporal means, but rigorous definitions are not typical Gauges – point values with relatively well understood errors Gauges – point values with relatively well understood errors Remote Sensing – radars (surface and space), passive radiometers (space-based) Remote Sensing – radars (surface and space), passive radiometers (space-based) All of these are inferences All of these are inferences Errors vary in time and space and are poorly known/understood Errors vary in time and space and are poorly known/understood Models - precipitation is not a random occurrence Models - precipitation is not a random occurrence Atmospheric winds, temperature, moisture strongly influence where precipitation falls and how much occurs Atmospheric winds, temperature, moisture strongly influence where precipitation falls and how much occurs So initialized (NWP) model precipitation can be viewed as an estimate So initialized (NWP) model precipitation can be viewed as an estimate Extensive validation, especially for forecasts, which provides some information on errors; but model changes go on continuously so that information is constantly being outdated – so atmospheric reanalyses best Extensive validation, especially for forecasts, which provides some information on errors; but model changes go on continuously so that information is constantly being outdated – so atmospheric reanalyses best Quantitative, but dependent on reality of model physical processes Quantitative, but dependent on reality of model physical processes
, passive radiometers (space-based) Remote Sensing – radars (surface and space), passive radiometers (space-based) All of these are inferences All of these are inferences Errors vary in time and space and are poorly known/understood Errors vary in time and space and are poorly known/understood Models - precipitation is not a random occurrence Models - precipitation is not a random occurrence Atmospheric winds, temperature, moisture strongly influence where precipitation falls and how much occurs Atmospheric winds, temperature, moisture strongly influence where precipitation falls and how much occurs So initialized (NWP) model precipitation can be viewed as an estimate So initialized (NWP) model precipitation can be viewed as an estimate Extensive validation, especially for forecasts, which provides some information on errors; but model changes go on continuously so that information is constantly being outdated – so atmospheric reanalyses best Extensive validation, especially for forecasts, which provides some information on errors; but model changes go on continuously so that information is constantly being outdated – so atmospheric reanalyses best Quantitative, but dependent on reality of model physical processes Quantitative, but dependent on reality of model physical processes")
4
TMPA 3-HrlyCMORPH 3-Hrly MERRA 3-Hrly First 7 days of January 2004

5
Integrating/Analyzing Precipitation Observations Analysis – creating complete (in time and space) fields from varying and incomplete observations Analysis – creating complete (in time and space) fields from varying and incomplete observations Satellite-derived estimates have complementary characteristics (geostationary IR is more complete but has poor accuracy, low Earth orbit PMW is more accurate but has sparse sampling) so combining them makes sense (CMAP, GPCP, CMORPH, TMPA, GSMaP…) Satellite-derived estimates have complementary characteristics (geostationary IR is more complete but has poor accuracy, low Earth orbit PMW is more accurate but has sparse sampling) so combining them makes sense (CMAP, GPCP, CMORPH, TMPA, GSMaP…) CMAP and GPCP use gauges to reduce bias over land, leading to complexities regarding homogeneity CMAP and GPCP use gauges to reduce bias over land, leading to complexities regarding homogeneity
 fields from varying and incomplete observations Analysis – creating complete (in time and space) fields from varying and incomplete observations Satellite-derived estimates have complementary characteristics (geostationary IR is more complete but has poor accuracy, low Earth orbit PMW is more accurate but has sparse sampling) so combining them makes sense (CMAP, GPCP, CMORPH, TMPA, GSMaP…) Satellite-derived estimates have complementary characteristics (geostationary IR is more complete but has poor accuracy, low Earth orbit PMW is more accurate but has sparse sampling) so combining them makes sense (CMAP, GPCP, CMORPH, TMPA, GSMaP…) CMAP and GPCP use gauges to reduce bias over land, leading to complexities regarding homogeneity CMAP and GPCP use gauges to reduce bias over land, leading to complexities regarding homogeneity")
6
Global Precipitation Climatologies GPCP (left)/CMAP (right) mean annual cycle and global mean time series Monthly/5-day; 2.5° lat/long global Both based on microwave/IR combined with gauges
/CMAP (right) mean annual cycle and global mean time series Monthly/5-day; 2.5° lat/long global Both based on microwave/IR combined with gauges")
7
CMAP and GPCP have some shortcomings: CMAP and GPCP have some shortcomings: Resolution – too coarse for many applications that require finer spatial/temporal resolution Resolution – too coarse for many applications that require finer spatial/temporal resolution Aging - based on products and techniques available some time ago Aging - based on products and techniques available some time ago Short records - limited to period since 1979 (or later) Short records - limited to period since 1979 (or later) Incomplete error characterization Incomplete error characterization Particular problems with high latitude and orographic precipitation Particular problems with high latitude and orographic precipitation Goals of our current work: Goals of our current work: Experiment with new approaches to analyzing precipitation during the modern era (1979 – present) Experiment with new approaches to analyzing precipitation during the modern era (1979 – present) Using reanalysis precipitation and optimal interpolation to improve global analyses Using reanalysis precipitation and optimal interpolation to improve global analyses Combine different satellite-derived precipitation estimates to produce high time/space resolution precipitation analyses Combine different satellite-derived precipitation estimates to produce high time/space resolution precipitation analyses Develop and verify methods to extend global precipitation analyses to the entire 20 th Century Develop and verify methods to extend global precipitation analyses to the entire 20 th Century
 Short records - limited to period since 1979 (or later) Incomplete error characterization Incomplete error characterization Particular problems with high latitude and orographic precipitation Particular problems with high latitude and orographic precipitation Goals of our current work: Goals of our current work: Experiment with new approaches to analyzing precipitation during the modern era (1979 – present) Experiment with new approaches to analyzing precipitation during the modern era (1979 – present) Using reanalysis precipitation and optimal interpolation to improve global analyses Using reanalysis precipitation and optimal interpolation to improve global analyses Combine different satellite-derived precipitation estimates to produce high time/space resolution precipitation analyses Combine different satellite-derived precipitation estimates to produce high time/space resolution precipitation analyses Develop and verify methods to extend global precipitation analyses to the entire 20 th Century Develop and verify methods to extend global precipitation analyses to the entire 20 th Century")
8
New Global Analysis and Reanalysis Back to 1900 (Matt Sapiano, UMD/CICS and Tom Smith, NESDIS/STAR) Concept: combine satellite-based estimates (most accurate in tropics and convective regimes) with model-derived precipitation (most accurate in high latitudes and synoptic situations) using optimal interpolation (permits weighting based on relative errors and provides error estimates) Concept: combine satellite-based estimates (most accurate in tropics and convective regimes) with model-derived precipitation (most accurate in high latitudes and synoptic situations) using optimal interpolation (permits weighting based on relative errors and provides error estimates) Begin with monthly, 2.5°, global coverage for the period 1979 – present, although shorter for many combinations Begin with monthly, 2.5°, global coverage for the period 1979 – present, although shorter for many combinations Goal for 1998 – present is 0.25°, 3-hourly or daily Goal for 1998 – present is 0.25°, 3-hourly or daily Use the new analyses and other information as basis to reconstruct/reanalyze global precipitation back to 1900 Use the new analyses and other information as basis to reconstruct/reanalyze global precipitation back to 1900 Goal is good temporal stability and accurate rendition of oceanic variability on scales from seasonal to decadal Goal is good temporal stability and accurate rendition of oceanic variability on scales from seasonal to decadal
 Concept: combine satellite-based estimates (most accurate in tropics and convective regimes) with model-derived precipitation (most accurate in high latitudes and synoptic situations) using optimal interpolation (permits weighting based on relative errors and provides error estimates) Concept: combine satellite-based estimates (most accurate in tropics and convective regimes) with model-derived precipitation (most accurate in high latitudes and synoptic situations) using optimal interpolation (permits weighting based on relative errors and provides error estimates) Begin with monthly, 2.5°, global coverage for the period 1979 – present, although shorter for many combinations Begin with monthly, 2.5°, global coverage for the period 1979 – present, although shorter for many combinations Goal for 1998 – present is 0.25°, 3-hourly or daily Goal for 1998 – present is 0.25°, 3-hourly or daily Use the new analyses and other information as basis to reconstruct/reanalyze global precipitation back to 1900 Use the new analyses and other information as basis to reconstruct/reanalyze global precipitation back to 1900 Goal is good temporal stability and accurate rendition of oceanic variability on scales from seasonal to decadal Goal is good temporal stability and accurate rendition of oceanic variability on scales from seasonal to decadal")
9
Available Datasets: Satellite IR-based products: OLR, OPI, GPI IR-based products: OLR, OPI, GPI Passive microwave: UMORA (Wentz), GPROF, NESDIS (Ferraro), GPCP (Wilheit-Chang) Passive microwave: UMORA (Wentz), GPROF, NESDIS (Ferraro), GPCP (Wilheit-Chang) Radar: TRMM Radar: TRMM Combinations: TRMM Combined, 3B42, CMORPH, GSMaP, PERSIANN,… Combinations: TRMM Combined, 3B42, CMORPH, GSMaP, PERSIANN,… Periods of record and coverage vary widely Periods of record and coverage vary widely Our initial version uses GPROF over land and an optimal combination of UMORA and GPROF over the oceans Our initial version uses GPROF over land and an optimal combination of UMORA and GPROF over the oceans
, GPROF, NESDIS (Ferraro), GPCP (Wilheit-Chang) Passive microwave: UMORA (Wentz), GPROF, NESDIS (Ferraro), GPCP (Wilheit-Chang) Radar: TRMM Radar: TRMM Combinations: TRMM Combined, 3B42, CMORPH, GSMaP, PERSIANN,… Combinations: TRMM Combined, 3B42, CMORPH, GSMaP, PERSIANN,… Periods of record and coverage vary widely Periods of record and coverage vary widely Our initial version uses GPROF over land and an optimal combination of UMORA and GPROF over the oceans Our initial version uses GPROF over land and an optimal combination of UMORA and GPROF over the oceans")
10
Available Datasets: Models Model precipitation forecasts can complement satellite-derived estimates: Model precipitation forecasts can complement satellite-derived estimates: Better in mid and high latitudes where satellite products generally less skillful Better in mid and high latitudes where satellite products generally less skillful Better in large-scale precipitation while satellite estimates tend to be better in convective regimes Better in large-scale precipitation while satellite estimates tend to be better in convective regimes First generation: NCEP 1 and 2 First generation: NCEP 1 and 2 Second Generation: ERA-40, JRA-25 Second Generation: ERA-40, JRA-25 Third generation: MERRA, ERA-I, NCEP CFSRR Third generation: MERRA, ERA-I, NCEP CFSRR Our first version used ERA-40; ERA- I better (some results later) Our first version used ERA-40; ERA- I better (some results later) Over US SGP, model correlations better in winter, satellite better in summer
 Our first version used ERA-40; ERA- I better (some results later) Over US SGP, model correlations better in winter, satellite better in summer")
11
Multi-Source Analysis of Precipitation (MSAP) Used OI to produce blend of ERA-40 (now includes ERA-I) and SSM/I (GPROF & Wentz) Used OI to produce blend of ERA-40 (now includes ERA-I) and SSM/I (GPROF & Wentz) Relies on satellite estimates in tropics, reanalysis in high latitudes, mix in between Relies on satellite estimates in tropics, reanalysis in high latitudes, mix in between Results of initial OI in Sapiano et al., 2008, JGR Results of initial OI in Sapiano et al., 2008, JGR
 Used OI to produce blend of ERA-40 (now includes ERA-I) and SSM/I (GPROF & Wentz) Used OI to produce blend of ERA-40 (now includes ERA-I) and SSM/I (GPROF & Wentz) Relies on satellite estimates in tropics, reanalysis in high latitudes, mix in between Relies on satellite estimates in tropics, reanalysis in high latitudes, mix in between Results of initial OI in Sapiano et al., 2008, JGR Results of initial OI in Sapiano et al., 2008, JGR")
12
Bias/correlation over land from gauges MSAP correlates better with gauge analysis than does GPCP_ms (no gauge correction) in high-latitudes MSAP correlates better with gauge analysis than does GPCP_ms (no gauge correction) in high-latitudes Gauge-based bias is high; climatological gauge correction like GPCP/CMAP can help to mitigate this problem Gauge-based bias is high; climatological gauge correction like GPCP/CMAP can help to mitigate this problem
 in high-latitudes MSAP correlates better with gauge analysis than does GPCP_ms (no gauge correction) in high-latitudes Gauge-based bias is high; climatological gauge correction like GPCP/CMAP can help to mitigate this problem Gauge-based bias is high; climatological gauge correction like GPCP/CMAP can help to mitigate this problem")
13
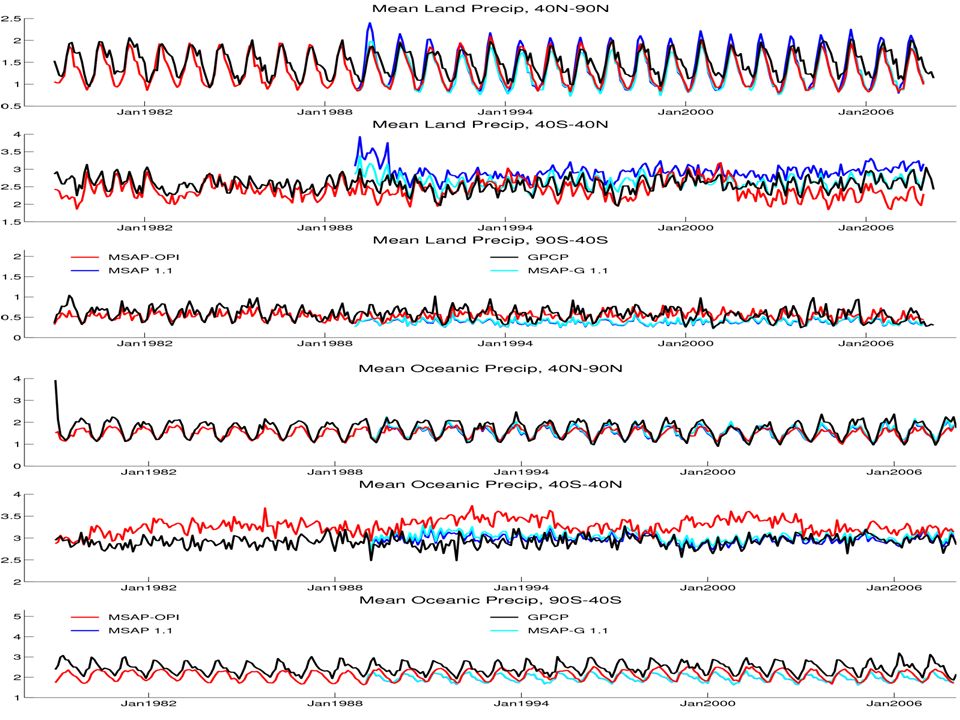
Extensions of the OI Analysis MSAP 1.1 uses ERA-I – better model precipitation MSAP-G adjusts to GPCC gauge analysis – much less bias over land MSAP-OPI uses IR- based OPI – longer record

15
The new OI analyses are promising, particularly since both reanalyses and satellite-derived estimates should improve in the future The new OI analyses are promising, particularly since both reanalyses and satellite-derived estimates should improve in the future Longer time series of global precipitation analyses is needed: Longer time series of global precipitation analyses is needed: To validate global climate models To validate global climate models To describe long-term trends in global, particularly oceanic, precipitation To describe long-term trends in global, particularly oceanic, precipitation To describe interdecadal variability in phenomena such as ENSO, the NAO, the PDO and others To describe interdecadal variability in phenomena such as ENSO, the NAO, the PDO and others Approach: reconstruct/reanalyze global precipitation back to 1900 using 2 methods Approach: reconstruct/reanalyze global precipitation back to 1900 using 2 methods EOF-based reconstruction using GPCP and other global precipitation analyses, combined with historical coastal and island rain gauge observations EOF-based reconstruction using GPCP and other global precipitation analyses, combined with historical coastal and island rain gauge observations CCA reanalysis using SST and SLP, based on modern era analyses CCA reanalysis using SST and SLP, based on modern era analyses EOF reconstruction appears better at depicting short-term variability; offers monthly, 2.5° resolution; poor on decadal-scale EOF reconstruction appears better at depicting short-term variability; offers monthly, 2.5° resolution; poor on decadal-scale CCA reanalysis seems to capture decadal/centennial-scale variability and trends; only annual, 5° resolution CCA reanalysis seems to capture decadal/centennial-scale variability and trends; only annual, 5° resolution

16
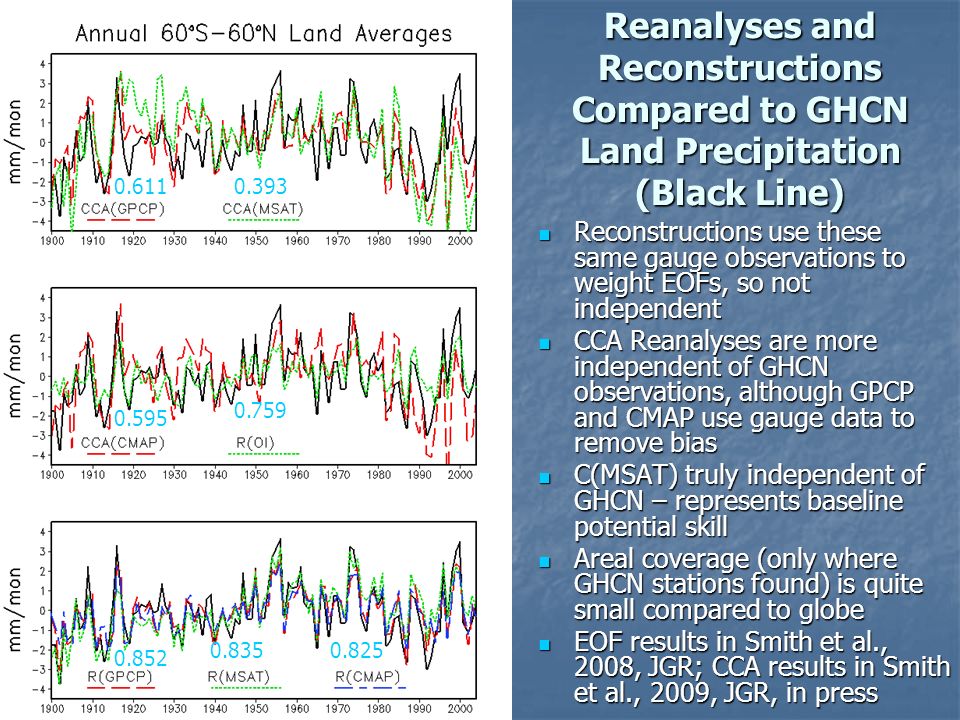
Reanalyses and Reconstructions Compared to GHCN Land Precipitation (Black Line) Reconstructions use these same gauge observations to weight EOFs, so not independent Reconstructions use these same gauge observations to weight EOFs, so not independent CCA Reanalyses are more independent of GHCN observations, although GPCP and CMAP use gauge data to remove bias CCA Reanalyses are more independent of GHCN observations, although GPCP and CMAP use gauge data to remove bias C(MSAT) truly independent of GHCN – represents baseline potential skill C(MSAT) truly independent of GHCN – represents baseline potential skill Areal coverage (only where GHCN stations found) is quite small compared to globe Areal coverage (only where GHCN stations found) is quite small compared to globe EOF results in Smith et al., 2008, JGR; CCA results in Smith et al., 2009, JGR, in press EOF results in Smith et al., 2008, JGR; CCA results in Smith et al., 2009, JGR, in press Fig 1: DJF means. 0.6110.393 0.759 0.595 0.852 0.8350.825
17
CCA Reanalyses CCA nearly independent of GHCN observations, although GPCP uses gauge data to remove bias (CCA based on gauge-free version of GPCP gives similar results) CCA nearly independent of GHCN observations, although GPCP uses gauge data to remove bias (CCA based on gauge-free version of GPCP gives similar results) Top panel shows comparison over land areas where gauges are found – small areal coverage Top panel shows comparison over land areas where gauges are found – small areal coverage Decadal-scale signal looks reasonable Decadal-scale signal looks reasonable Ability to resolve finer scale phenomena like ENSO is limited – yearly, 5°, bigger errors on short time scales Ability to resolve finer scale phenomena like ENSO is limited – yearly, 5°, bigger errors on short time scales See Smith et. al. 2009 (in press), JGR See Smith et. al. 2009 (in press), JGR Fig 1: DJF means.
, JGR See Smith et. al (in press), JGR Fig 1: DJF means..")
18
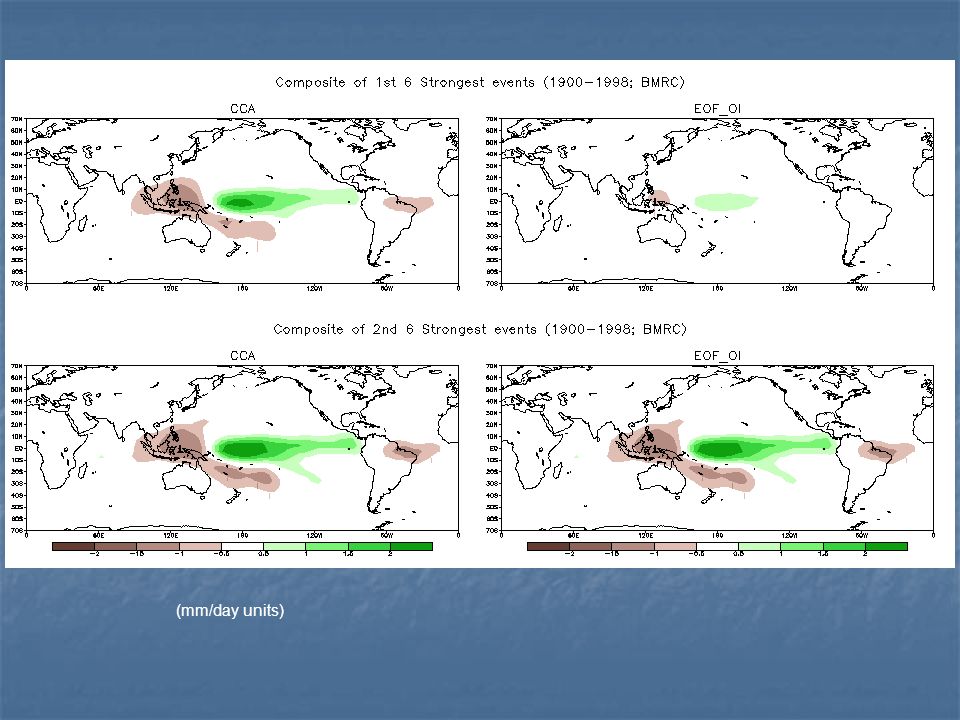
X X XXXXXXXXX X Southern Oscillation Index XXXXXXXXXX X

19
(mm/day units)
")
21
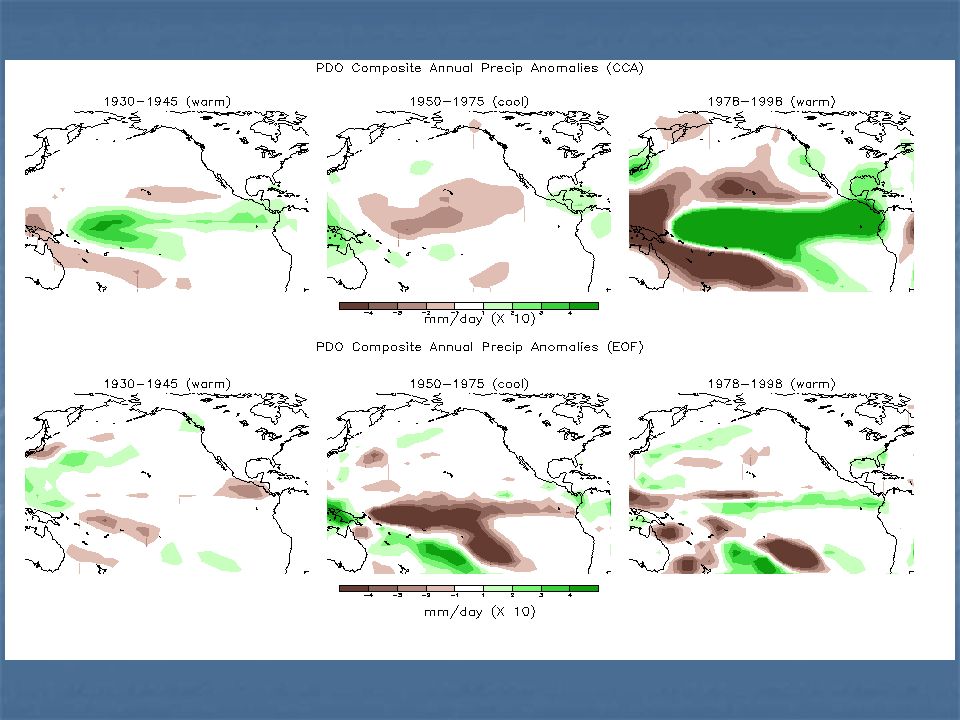
Warm Phase Cool Phase Pacific Decadal Oscillation (PDO) From http://jisao.washington.edu/pdo (1930-1945) (1978-1998) (1950-1975)
 From ( ) ( ) ( )")
23
Datasets based on observations (GPCP, CMAP) give about 2.6 mm/day (AR4 range is about 2.5-3.2 mm/day) Datasets based on observations (GPCP, CMAP) give about 2.6 mm/day (AR4 range is about 2.5-3.2 mm/day) Data assimilation products average about 3 mm/day; also have larger mean annual cycle and greater interannual variability than observation-based products Data assimilation products average about 3 mm/day; also have larger mean annual cycle and greater interannual variability than observation-based products ESRL-Compo/Whittaker SLP-based reanalysis is about 3.3 mm/day ESRL-Compo/Whittaker SLP-based reanalysis is about 3.3 mm/day (figure courtesy Junye Chen, NASA/GMAO-MERRA) (figure courtesy Junye Chen, NASA/GMAO-MERRA) Global Mean Precipitation from Reanalyses and Reconstructions
 give about 2.6 mm/day (AR4 range is about mm/day) Datasets based on observations (GPCP, CMAP) give about 2.6 mm/day (AR4 range is about mm/day) Data assimilation products average about 3 mm/day; also have larger mean annual cycle and greater interannual variability than observation-based products Data assimilation products average about 3 mm/day; also have larger mean annual cycle and greater interannual variability than observation-based products ESRL-Compo/Whittaker SLP-based reanalysis is about 3.3 mm/day ESRL-Compo/Whittaker SLP-based reanalysis is about 3.3 mm/day (figure courtesy Junye Chen, NASA/GMAO-MERRA) (figure courtesy Junye Chen, NASA/GMAO-MERRA) Global Mean Precipitation from Reanalyses and Reconstructions")
24
All plots are anomalies relative to the mean of the CCA reanalysis (same as GPCP) All plots are anomalies relative to the mean of the CCA reanalysis (same as GPCP) +/- 1 and 2 SD plotted for AR4 runs +/- 1 and 2 SD plotted for AR4 runs Compo reanalysis above AR4 range – at the high end of modern reanalyses, which are wetter than GPCP and CMAP Compo reanalysis above AR4 range – at the high end of modern reanalyses, which are wetter than GPCP and CMAP GPCP and CCA in lower part of AR4 range GPCP and CCA in lower part of AR4 range
 All plots are anomalies relative to the mean of the CCA reanalysis (same as GPCP) +/- 1 and 2 SD plotted for AR4 runs +/- 1 and 2 SD plotted for AR4 runs Compo reanalysis above AR4 range – at the high end of modern reanalyses, which are wetter than GPCP and CMAP Compo reanalysis above AR4 range – at the high end of modern reanalyses, which are wetter than GPCP and CMAP GPCP and CCA in lower part of AR4 range GPCP and CCA in lower part of AR4 range")
25
Note scale changed by factor of 10 Note scale changed by factor of 10 Biases removed so means are the same for all time series Biases removed so means are the same for all time series AR4 ensemble mean exhibits much less variability since it is an average of many (20 or so) runs AR4 ensemble mean exhibits much less variability since it is an average of many (20 or so) runs
 runs AR4 ensemble mean exhibits much less variability since it is an average of many (20 or so) runs")
26
Re-scale AR4 ensemble mean so variance is about same as a single realization Re-scale AR4 ensemble mean so variance is about same as a single realization CCA and AR4 ensemble mean show similar centennial-scale changes, but interannual variations rather different CCA and AR4 ensemble mean show similar centennial-scale changes, but interannual variations rather different

27
Conclusions/Issues OI analysis offers potential, but still plenty of things to work on OI analysis offers potential, but still plenty of things to work on Use other satellite products (IR, Wilheit/Chang, TRMM PR) Use other satellite products (IR, Wilheit/Chang, TRMM PR) Other reanalyses – take advantage of variety Other reanalyses – take advantage of variety Reconstruction back to 1900 is encouraging Reconstruction back to 1900 is encouraging EOF-based product shows skill in capturing seasonal-to-decadal variations EOF-based product shows skill in capturing seasonal-to-decadal variations Decadal-to-centennial variations well-represented in CCA Decadal-to-centennial variations well-represented in CCA A combined approach will be tried next A combined approach will be tried next Many issues related to satellite-derived precipitation estimates: Many issues related to satellite-derived precipitation estimates: Solid precipitation – snow, etc. Solid precipitation – snow, etc. High latitude and orographic precipitation High latitude and orographic precipitation Light precipitation – drizzle, fog, cloud liquid water Light precipitation – drizzle, fog, cloud liquid water Broader issues related to global precipitation data sets: Broader issues related to global precipitation data sets: Oceanic precipitation magnitude – critical to understanding the global water cycle Oceanic precipitation magnitude – critical to understanding the global water cycle Temporal stability – critical to understanding global climate change Temporal stability – critical to understanding global climate change Sustainability of integrated global precipitation data sets Sustainability of integrated global precipitation data sets Sustainability of critical observations – both satellite and in situ Sustainability of critical observations – both satellite and in situ

Similar presentations


 Phil Arkin, Cooperative Institute for.>")


 Analyses for Climate NOAA’s National Climatic Data Center Asheville, NC Thomas M. Smith Richard W. Reynolds Kenneth.>")

 Phil Arkin, Cooperative Institute for.>")


 to an Ensemble of Analyses Including CFSR Wesley Ebisuzaki 1, Fedor Mesinger 2, Li Zhang.>")


 Satellite Climate Studies Branch (SCSB) 1 1 Reconstruction of Near-Global Precipitation Variations Thomas Smith 1.>")