Download presentation
Presentation is loading. Please wait.

1
FSIS Listeria Risk Assessment Daniel Gallagher Dept. of & Environmental Engineering Dept. of Civil & Environmental Engineering Virginia Tech Eric Ebel and Janell Kause FSIS Risk Assessment Division USDA Listeria Public Meeting February 26, 2003

2
Overview FDA Listeria risk ranking of RTE products FSIS Risk Management Questions FSIS Listeria Risk Assessment Model Data Inputs and Assumptions Model Implementation Risk Assessment Outputs Summary of Findings

3
FDA Risk Ranking of RTE Products Approach: Relative Risk Ranking of Food Categories Purpose: Identify foods that pose the greatest public health risk and focus resources accordingly Evaluated Lm from retail to public health Available public comment Version 2 to be released

4
FSIS Listeria Risk Management Questions Examine the effectiveness of testing and sanitation of food contact surfaces on mitigating product contamination, and reducing the subsequent risk of illness Evaluate the effectiveness of other interventions (e.g., pre- and post-packaging interventions) Provide guidance on how frequently to test and sanitize food contact surfaces for Listeria spp.
 Provide guidance on how frequently to test and sanitize food contact surfaces for Listeria spp.")
5
Possible Sources of Lm in RTE Products at Retail Inadequate lethality during processing Direct deposition from non-food contact surface Transfer from food contact surface Focus on food contact surfaces as the source of Lm

6
Model Description Dynamic “in-plant” Monte Carlo model predicts Lm concentrations at retail Coupled with an updated version of the FDA Listeria risk assessment model to predict human health impacts Mass balance approach –track bacteria as move from one media to another Incorporates FCS testing, product testing, sanitation, pre- and post-packaging interventions, growth inhibitors Conducted on deli meats (“high risk”)
")
7
Conceptual Model, Part 1

8
Conceptual Model, Part 2

9
Risk Assessment Outputs The risk of illness or death on a per annum basis from Lm in deli meat as a function of: –Testing (Listeria spp.) and sanitation frequency (based on plant size) of food contact surfaces –Testing (Lm) and disposition of RTE product –Pre- and post-packaging interventions The likelihood of detecting Lm in a product lot if a FCS tests positive for Listeria spp.
 and sanitation frequency (based on plant size) of food contact surfaces –Testing (Lm) and disposition of RTE product –Pre- and post-packaging interventions The likelihood of detecting Lm in a product lot if a FCS tests positive for Listeria spp.")
10
Key Data Requirements Contamination Events –frequency, duration, levels Transfer coefficients from FCS to product Lm to Lspp ratios Line production levels by plant size

11
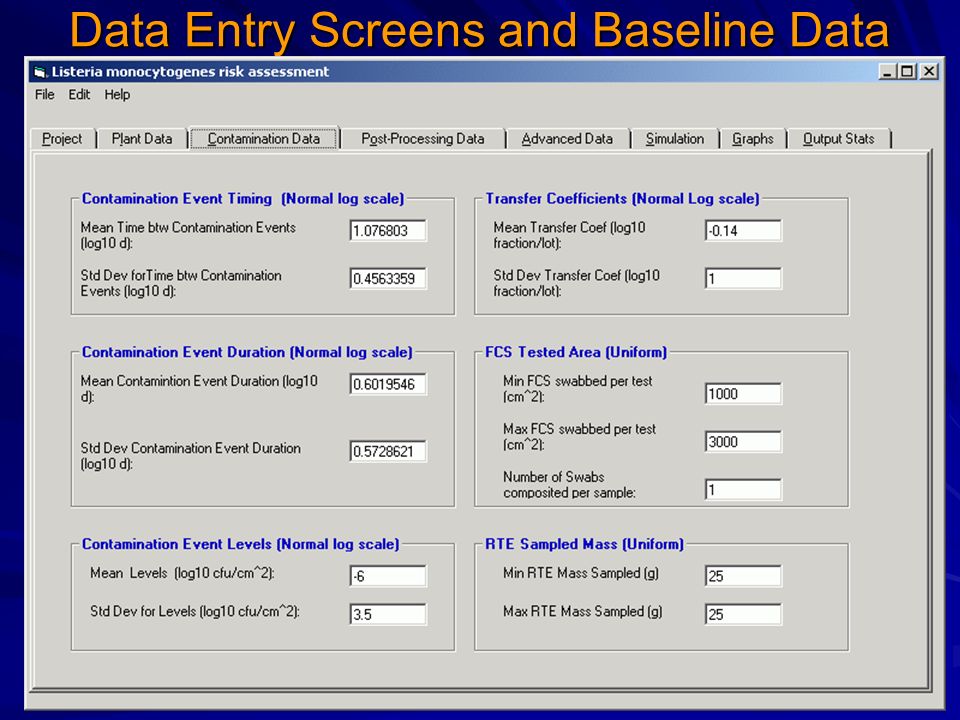
Contamination Event: Frequency Data source: FSIS IDV data Date description: Lspp prevalence over time for various food contact surfaces Method: Fit with survival analysis Results: Log normal distribution –Mean time between contamination events: 23.1 days –Standard deviation: 38 days

12
Contamination Event: Duration Data Source: Tompkin 2002 Data description: Sequential weekly Lspp positives for food contact surfaces Method: Fit with survival analysis Results: log normal distribution –Mean: 8.8 days –Standard deviation: 2.1 days

13
Transfer Coefficients Data Source: published literature Results: –Montville et al. (2001) and Chen et al. (2001) found that transfer coefficients of bacteria were log normally distributed. Range: 0.01% to 10% Standard deviation ~ 1 log –Midelet & Carpentier (2002) found that after 12 contacts, 60%-100% of initial Lm transferred, ~100% of other bacteria. LMRA uses a log mean of –0.14 with a log SD of 1. Truncate to 100% at max.
 and Chen et al. (2001) found that transfer coefficients of bacteria were log normally distributed. Range: 0.01% to 10% Standard deviation ~ 1 log –Midelet & Carpentier (2002) found that after 12 contacts, 60%-100% of initial Lm transferred, ~100% of other bacteria. LMRA uses a log mean of –0.14 with a log SD of 1. Truncate to 100% at max..")
14
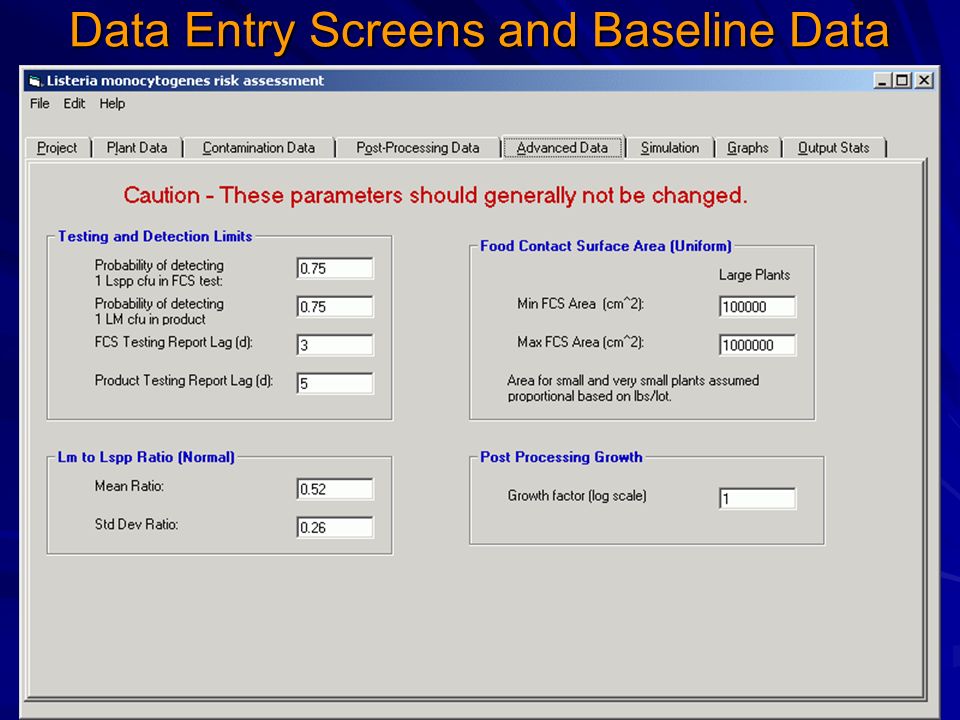
Lspp to Lm Ratio Data Source: prevalence data provided in Tompkin (2002) and blinded industry data (no available Listeria level data) Assumption: prevalence ratio used for level ratio Results: ratios fit (truncated) normal distribution –Mean: 52.6% –Standard deviation: 26.7%
 and blinded industry data (no available Listeria level data) Assumption: prevalence ratio used for level ratio Results: ratios fit (truncated) normal distribution –Mean: 52.6% –Standard deviation: 26.7%")
15
Production Levels/ Lot Volumes by Plant Size Data source: FSIS RTE Survey Lot size per line per shift varies by plant size: –Large: 48%, 19000 lb ± 14000 –Small: 48%, 7100 lb ± 10600 –Very Small: 4%, 2800 lb ± 9500 Assume that FCS area varies proportionately.

16
Contamination Event Added Lspp to Food Contact Surface Source: No available data (calibrated data input) Assumption: Added levels are log normally distributed Method: Calibrate the added levels so that the predicted Lm distribution at retail matches the FDA retail distribution
 Assumption: Added levels are log normally distributed Method: Calibrate the added levels so that the predicted Lm distribution at retail matches the FDA retail distribution")
17
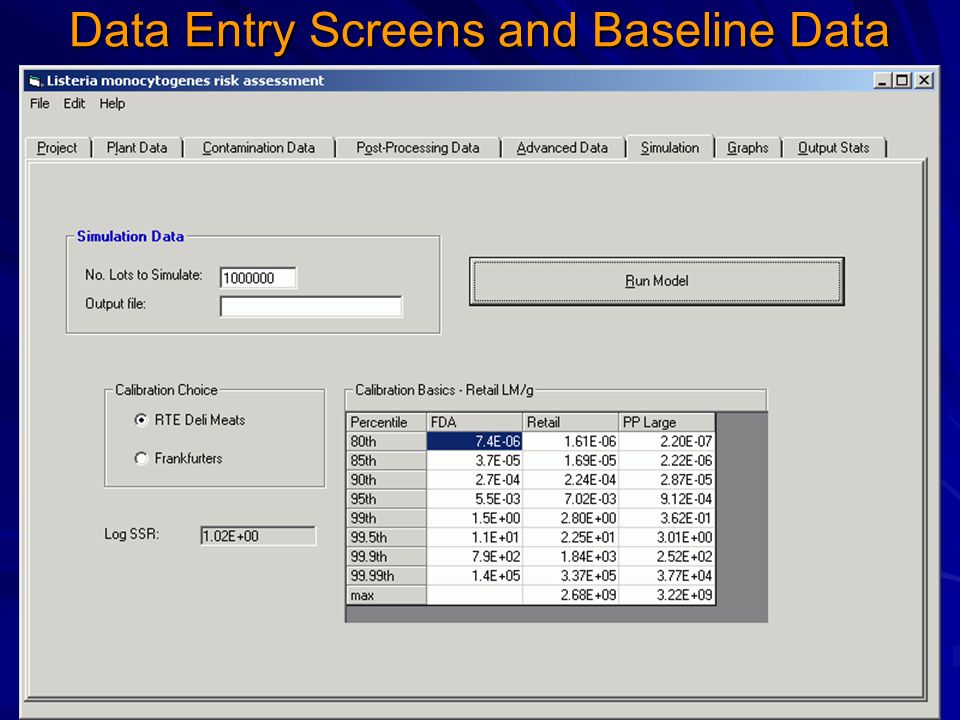
Model Calibration FDA Lm concentration distribution at retail Prevalence of Lm in product –Levine et al. (2001) found prevalence from 0.52% - 5.16% in RTE meat and poultry. Generally decreasing with time. Generally 1-3% in 1999. –Luchansky (in press) found 1.6% prevalence in frankfurter packages –NFPA (2002) found 0.9% prevalence in RTE meat
 found prevalence from 0.52% % in RTE meat and poultry. Generally decreasing with time. Generally 1-3% in –Luchansky (in press) found 1.6% prevalence in frankfurter packages –NFPA (2002) found 0.9% prevalence in RTE meat.")
18
Preliminary USDA Data CY 2002 HAACP code 03G (fully cooked, not shelf stable) subcategory: sliced, diced, shredded (e.g. sliced ham, sliced bologna, sliced chicken breast, diced chicken) 23 Lm positives out of 997 samples prevalence of 2.3%
 23 Lm positives out of 997 samples prevalence of 2.3%.")
19
Model Implementation and Baseline Data

20
Data Entry Screens and Baseline Data

26
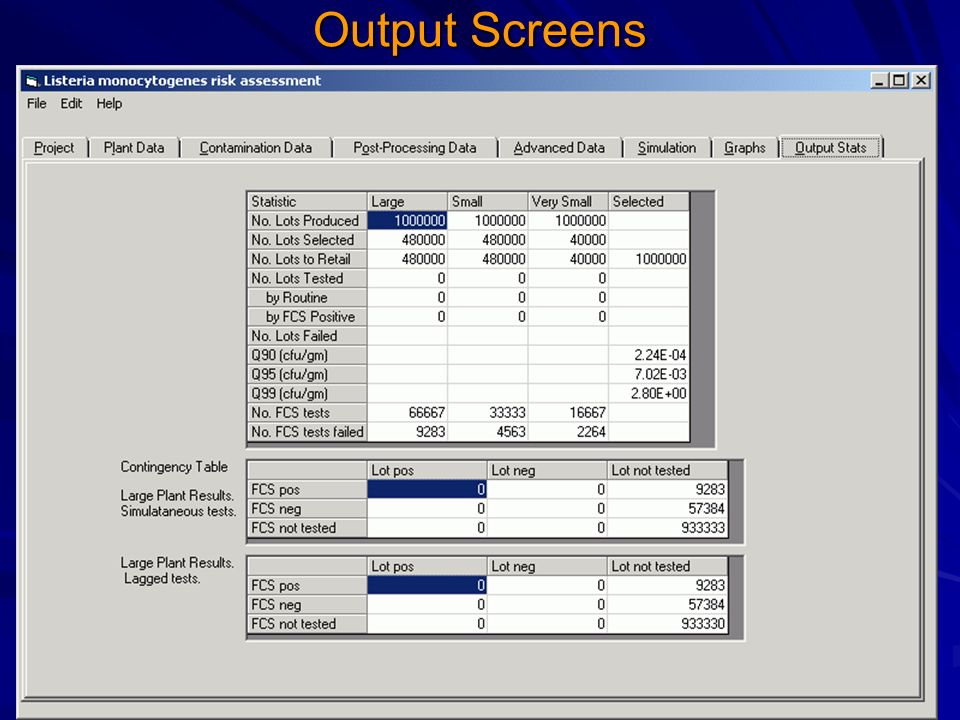
Output Screens

28
Results: Lot Timeline

29
Post processing Growth ? FDA model assumes about 1.9 logs of growth on average between processing and retail. Source % at Processing % at Retail FSIS 1% - 3% measured? NFPA?0.9%measured LMRA uses same approach as FDA but with less growth (1 log vs 1.9 logs). Lack of variability may impact growth-inhibiting-packaging conclusions. LMRA uses same approach as FDA but with less growth (1 log vs 1.9 logs). Lack of variability may impact growth-inhibiting-packaging conclusions.
. Lack of variability may impact growth-inhibiting-packaging conclusions. LMRA uses same approach as FDA but with less growth (1 log vs 1.9 logs). Lack of variability may impact growth-inhibiting-packaging conclusions..")
30
Analysis of growth Production Log(Lm per gram) Growth Log(Growth) = Retail Log(Lm per gram) + Normal(µ 1,σ 1 )Normal(µ 2,σ 2 )Normal(µ 1 +µ 2, σ 2 1 +σ 2 2 )+= Given a retail distribution, solve for production distribution for different assumed growth distributions. Then examine implied sample prevalence levels assuming a test positive threshold of 1 Lm organism in 25 gram samples.

31
Case 1 + =

32
Case 2 + =

33
Case 3 + =

34
Mass Balance: Tracking Lspp on FCS

35
Model Evaluation

36
Comparison of FSIS Model Outputs to FDA Risk Assessment Inputs

37
Baseline predictions Calibration to “average” updated FDA/FSIS model Lm concentration in retail deli meat distribution Lack of uncertainty about concentration has small effect on uncertainty about public health predictions In-plant baseline predictions repeatable Median, 5 th and 95 th percentiles in predicted elderly deaths

38
Model Stability

39
Model Results

40
Scenarios Tested Baseline calibration: no testing, no interventions, no post-processing, no GIP FCS Testing Levels, test and hold yes, dispose product yes, test lot yes, enhanced cleaning yes (No. tests per line per month for large, small, very small plants) –4-2-1 –8-4-2 –10-10-10 –16-8-4 –32-16-8 –60-60-60 60-60-60 Lot testing, dispose product yes 100% post-processing treatment (90% - 95% effective) for all three plant sizes, no testing 100% growth-inhibiting packaging (90% 95% effective) for all three plant sizes, no testing All scenarios tested for production of 1,000,000 lots.
 –4-2-1 –8-4-2 – – – – Lot testing, dispose product yes 100% post-processing treatment (90% - 95% effective) for all three plant sizes, no testing 100% growth-inhibiting packaging (90% 95% effective) for all three plant sizes, no testing All scenarios tested for production of 1,000,000 lots..")
41
FCS Testing/Sanitation Impacts

42
Contingency Table: Likelihood of Detecting Listeria spp./Lm Overall FCS prevalence of ~ 13.7% Overall Lot prevalence of ~2.2% Lot prevalence when FCS is positive ~15.7% FCS testing improves lot testing by factor of 7 60-60-60 FCS tests, 60-60-60 lot tests, test and hold in place

43
Test and Hold Comparison

44
Test and Hold Evaluation Overall FCS prevalence approximately constant at ~13-14 % regardless of test and hold. Overall lot prevalence 15-16% if test and hold, 4-5% if not test and hold Recall overall lot prevalence ~2.2% For retail Lm, test and hold only significant at more frequent FCS testing

45
Sensitivity Analysis

46
Sensitivity Analysis: Sampled RTE Mass

47
Sensitivity Analysis: FCS Area Tested

49
Sensitivity Analysis: Post processing

50
Evaluation of prevalence for different Lm/Lspp ratios Each new ratio requires a recalibration to match the observed Lm distribution at retail. These results are preliminary

51
Sensitivity Analysis Findings RTE sampled mass, retail Lm –Mass should be limited only by lab considerations. FCS area sampled, retail Lm –Caution: assumes Lm evenly distributed FCS testing is effective for a wide range of Lm/Lspp ratios. The effectiveness is higher at higher ratios. Post processing & industry participation, retail Lm

52
Public Health Impacts

53
Predicted elderly deaths from deli meats

54
Predicted intermediate age deaths from deli meats

55
Predicted neonatal deaths from deli meats

56
Predicted lives saved relative to baseline ScenarioElderlyIntermediateNeonatesTotal 4-2-1204125 8-4-230?? 10-10-1040?? 16-8-430?? 32-16-860?? 40-20-107015489 60-60-60120277154 60-60-60 RTE120267153 PP-95%12026?146 PP-99%1733910221 GIP11025?135 PP-95% & GIP1864111238

57
Test and control combinations Note: Testing is non-additive with post-processing treatment.

58
Model Variables Only considers food contact surface as source of Lspp/Lm in product Only a “generic” food contact surface Assumes Lspp evenly distributed across food contact surface, and Lm evenly distributed within product Operates on a product lot basis

59
Summary Findings Food contact surfaces found to be positive for Listeria species greatly increased the likelihood of finding RTE product lots positive for Lm (x7 if test and hold, x2 if not) ). Frequency of contamination of FCS with Listeria species appears to encompass a broad timeframe, and the duration of contamination lasts about a week. The proposed minimal frequency of FCS testing/sanitation, as presented in the proposed rule (66 FR 12589, Feb. 27, 2001) results in a small reduction in the levels of Lm in deli meats at retail. Increased frequency of testing/sanitation leads to proportionally lower risk of listeriosis. Combinations of interventions appear to be much more effective than any single intervention in mitigating the potential contamination of RTE product with Lm and reducing the subsequent risk of illness or death.
 results in a small reduction in the levels of Lm in deli meats at retail. Increased frequency of testing/sanitation leads to proportionally lower risk of listeriosis. Combinations of interventions appear to be much more effective than any single intervention in mitigating the potential contamination of RTE product with Lm and reducing the subsequent risk of illness or death..")
60
Questions?

61
Lm Distributions at Retail for Scenarios Tested

62
Health Impacts for Scenarios Tested

Similar presentations


 in Retail Delicatessens>")


 October 2009 *The views and opinions.>")

