Download presentation
Presentation is loading. Please wait.

2
Christian Arnault Émini The University of Yaoundé II - Cameroon Workshop on Economic Partnership Agreements (EPAs) For Southern Africa Maputo (Mozambique) 4 – 5 April 2005 The Poverty Impacts of the Doha Round and the Role of Tax Policy: A Case Study for Cameroon The Poverty Impacts of the Doha Round and the Role of Tax Policy: A Case Study for Cameroon John Cockburn Université Laval – Quebec, Canada Bernard Decaluwé Université Laval – Quebec, Canada
 For Southern Africa Maputo (Mozambique) 4 – 5 April 2005 The Poverty Impacts of the Doha Round and the Role of Tax Policy: A Case Study for Cameroon The Poverty Impacts of the Doha Round and the Role of Tax Policy: A Case Study for Cameroon John Cockburn Université Laval – Quebec, Canada Bernard Decaluwé Université Laval – Quebec, Canada")
3
Background on economy and poverty in Cameroon Current patterns of trade and protection in Cameroon Synopsis of the Doha impacts on Cameroon Digression on the issue of tax replacement Conclusions SUMMARYSUMMARY

5
4 Openness of the Cameroonian Economy Real GDP Trends Before, During, and Beyond the 1986-1994 Economic Crisis

6
5 Trend in poverty Trend in poverty indices between 1996 and 2001

7
6 Trend in poverty Difference between the value of a poverty index among rural households and the value of that index among urban households

8
7 Trend in poverty

9
8

10
9 The Cameroon Social Accounting Matrix for 2001 Sets Description of elements Activities (10) Agriculture (2)Foodstuffs agriculture, Cash crops agriculture Industries (6) Forestry, Crude oil, Processed food, Processed wood, Refined petroleum, Miscellaneous industries Services (2)Tradable services, Public services Institutions (10995) Households (10992) As processed from the results of the 2001 household survey in Cameroon (ECAM II) Others (3)Firms, Government, Rest of the World Production Factors Agricultural LaborSkilled Labor, Unskilled Labor Nonagricultural LaborSkilled Labor, Unskilled Labor CapitalSector-specific LandUsed by agricultural activities
 Agriculture (2)Foodstuffs agriculture, Cash crops agriculture Industries (6) Forestry, Crude oil, Processed food, Processed wood, Refined petroleum, Miscellaneous industries Services (2)Tradable services, Public services Institutions (10995) Households (10992) As processed from the results of the 2001 household survey in Cameroon (ECAM II) Others (3)Firms, Government, Rest of the World Production Factors Agricultural LaborSkilled Labor, Unskilled Labor Nonagricultural LaborSkilled Labor, Unskilled Labor CapitalSector-specific LandUsed by agricultural activities")
11
10 Households’ Income Composition Income sources Household groups UrbanRuralMale-ledFemale-ledPoor Non poor Skilled agricultural labor 1.513.47.24.611.15.1 Unskilled agricultural labor 1.033.915.914.733.78.2 Skilled nonagricultural labor 58.419.640.941.518.150.6 Unskilled nonagricultural labor 11.811.411.710.613.410.8 Agricultural capital 1.212.16.44.014.72.5 Nonagricultural capital 26.07.816.923.77.422.2 Land 0.11.80.90.81.70.5 Total factor income 100.0

13
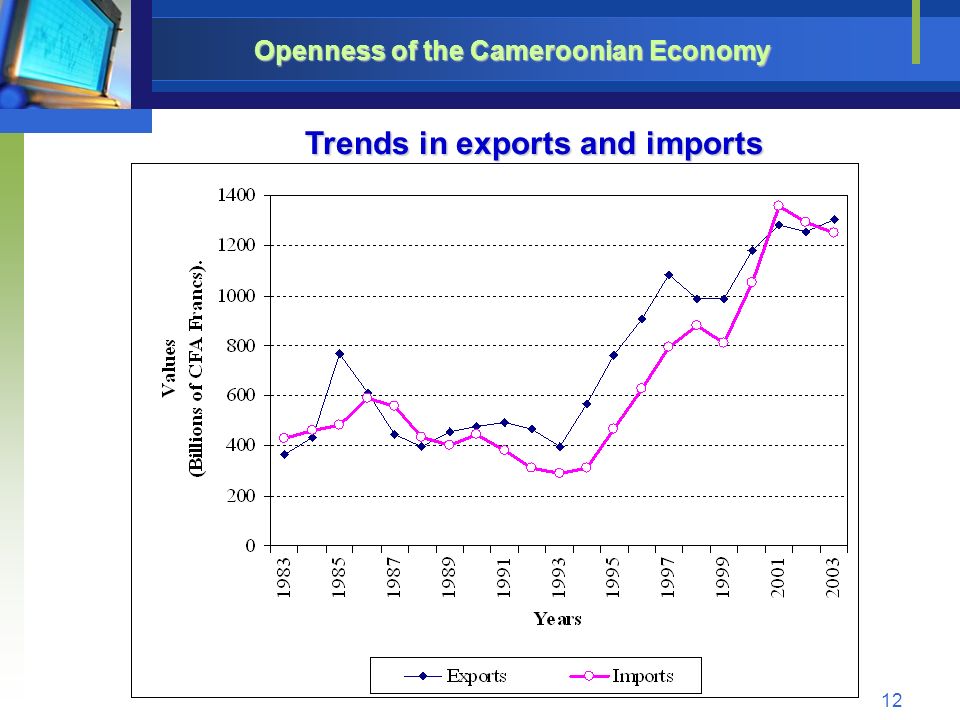
12 Openness of the Cameroonian Economy Trends in exports and imports

14
13 Openness of the Cameroonian Economy Trends in Trade Balance

15
14 Openness of the Cameroonian Economy 55% 77% Top-Five Import and Export Goods in 2003 Top-Five Import and Export Goods in 2003

16
15 Openness of the Cameroonian Economy Cameroon’s Trade Orientation in 2003 Cameroon’s Trade Orientation in 2003

17
16 Openness of the Cameroonian Economy Import penetration and export orientation (in percentage)
")
18
17 Openness of the Cameroonian Economy Import tariffs and shares in the base run – 2001 (in percentage)
")
20
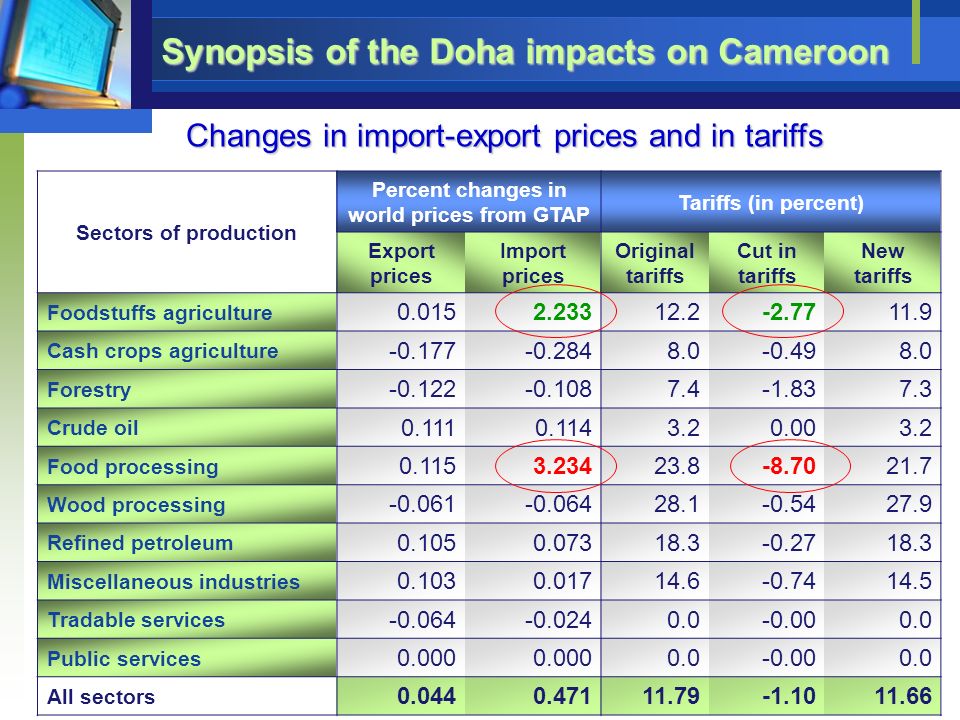
19 Synopsis of the Doha impacts on Cameroon Sectors of production Percent changes in world prices from GTAP Tariffs (in percent) Export prices Import prices Original tariffs Cut in tariffs New tariffs Foodstuffs agriculture 0.0152.23312.2-2.7711.9 Cash crops agriculture -0.177-0.2848.0-0.498.0 Forestry -0.122-0.1087.4-1.837.3 Crude oil 0.1110.1143.20.003.2 Food processing 0.1153.23423.8-8.7021.7 Wood processing -0.061-0.06428.1-0.5427.9 Refined petroleum 0.1050.07318.3-0.2718.3 Miscellaneous industries 0.1030.01714.6-0.7414.5 Tradable services -0.064-0.0240.0-0.000.0 Public services 0.000 0.0-0.000.0 All sectors 0.0440.47111.79-1.1011.66 Changes in import-export prices and in tariffs
 Export prices Import prices Original tariffs Cut in tariffs New tariffs Foodstuffs agriculture Cash crops agriculture Forestry Crude oil Food processing Wood processing Refined petroleum Miscellaneous industries Tradable services Public services All sectors Changes in import-export prices and in tariffs")
21
20 Synopsis of the Doha impacts on Cameroon Macro and sectoral impacts

22
21 Synopsis of the Doha impacts on Cameroon Sectors of production Percent changes in prices by sector OutputExportImport Locally sold output without tax Locally sold output with taxes Absor ption Household consumpti on Foodstuffs agriculture 0.440.191.950.44 0.46 Cash crops agriculture 0.09-0.02-0.320.16 Forestry -0.02-0.060.03-0.01 Crude oil 0.11 0.00 Food processing 0.600.291.540.63 0.760.97 Wood processing -0.05 0.05-0.050.04 0.21 Refined petroleum 0.040.080.120.020.080.090.13 Miscellaneous industries 0.070.080.120.070.11 0.24 Tradable services 0.02-0.02 0.030.060.050.07 Public services 0.380.00 0.38 0.00 All sectors 0.170.070.290.190.210.220.34

23
22 Synopsis of the Doha impacts on Cameroon Sectors of production Percent changes in volumes by sector OutputExportImport Locally sold output Absorption Household consumption Foodstuffs agriculture 0.04-1.03-6.150.060.00-0.1 Cash crops agriculture -0.30-0.953.450.23 0.0 Forestry -0.14-0.36-0.32-0.11 0.0 Crude oil 0.00 -0.040.00-0.030.0 Food processing 0.47-1.07-3.870.600.05-0.4 Wood processing -0.06-0.05-0.06-0.03 -0.2 Refined petroleum -0.040.14-0.26-0.12-0.13-0.2 Miscellaneous industries 0.050.13-0.020.050.03-0.2 Tradable services -0.09-0.250.24-0.07-0.05-0.2 Public services 0.00 0.0 All sectors 0.00-0.15-0.550.06-0.01-0.2

24
23 Synopsis of the Doha impacts on Cameroon Macro and sectoral impacts Change in CPI: +0.34

25
24 Change in households’ Income Income sources Household groups UrbanRural Share (%)Change (%)Share (%)Change (%) Skilled agricultural labor 1.50.4713.40.48 Unskilled agricultural labor 1.00.4033.90.51 Skilled nonagricultural labor 58.4-0.0419.60.00 Unskilled nonagricultural labor 11.80.0211.40.00 Agricultural capital 1.20.4912.10.43 Nonagricultural capital 26.00.037.80.70 Land 0.10.001.80.03 Total factor income 100.00.00100.00.34
Change (%)Share (%)Change (%) Skilled agricultural labor Unskilled agricultural labor Skilled nonagricultural labor Unskilled nonagricultural labor Agricultural capital Nonagricultural capital Land Total factor income")
26
25 Change in households’ Income Income sources Household groups Male-ledFemale-led Share (%)Change (%)Share (%)Change (%) Skilled agricultural labor 7.20.494.60.43 Unskilled agricultural labor 15.90.5114.70.44 Skilled nonagricultural labor 40.9-0.0341.5-0.03 Unskilled nonagricultural labor 11.70.0110.6-0.01 Agricultural capital 6.40.454.00.31 Nonagricultural capital 16.90.1823.70.09 Land 0.90.030.80.00 Total factor income 100.00.17100.00.10
Change (%)Share (%)Change (%) Skilled agricultural labor Unskilled agricultural labor Skilled nonagricultural labor Unskilled nonagricultural labor Agricultural capital Nonagricultural capital Land Total factor income")
27
26 Change in households’ Income Income sources Household groups Poor in base runNon poor in base run Share (%)Change (%)Share (%)Change (%) Skilled agricultural labor 11.10.485.10.48 Unskilled agricultural labor 33.70.518.20.49 Skilled nonagricultural labor 18.1-0.0150.6-0.03 Unskilled nonagricultural labor 13.40.0110.80.01 Agricultural capital 14.70.452.50.40 Nonagricultural capital 7.40.4322.20.13 Land 1.70.030.50.03 Total factor income 100.00.32100.00.09
Change (%)Share (%)Change (%) Skilled agricultural labor Unskilled agricultural labor Skilled nonagricultural labor Unskilled nonagricultural labor Agricultural capital Nonagricultural capital Land Total factor income")
28
27 Poverty impacts

29
28 Poverty impacts

30
29 Poverty impacts Number of former poor people who escape from poverty Number of former non poor people who become poor Net change in the number of poor people ABC=B-A 56,00014,000-42,000 Estimates of changes in the number of poor following the Doha scenario

32
31 Digression on the issue of Tax Replacement To capture the possible bias induced by the choice of the replacement tax, we compare the effects of combined ROW and Cameroon liberalization using alternatively two taxation systems as replacement tax: A Value Added Tax A proportional household consumption tax. VAT versus neutral consumption tax as replacement tax

33
32 Digression on the issue of Tax Replacement Importance of the VAT among indirect taxes in Cameroon – year 2001

34
33 Digression on the issue of Tax Replacement The VAT applied in Cameroon is progressive Average VAT effective rate

35
34 Digression on the issue of Tax Replacement Comparative effects on price indices

36
35 Digression on the issue of Tax Replacement Comparative effects on volume indices

37
36 Digression on the issue of Tax Replacement Comparative effects on factor remuneration rates, household income and welfare

38
37 Digression on the issue of Tax Replacement Comparative effects on household income

39
38 Digression on the issue of Tax Replacement Comparative effects on poverty headcount

40
39 Digression on the issue of Tax Replacement Comparative effects on the number of poor Number of former poor people who escape from poverty Number of former non poor people who become poor Net change in the number of poor people ABC=B-A Neutral consumption tax as the replacement tax 63,000999,000+936,000 VAT as the replacement tax 43,000708,000+665,000

42
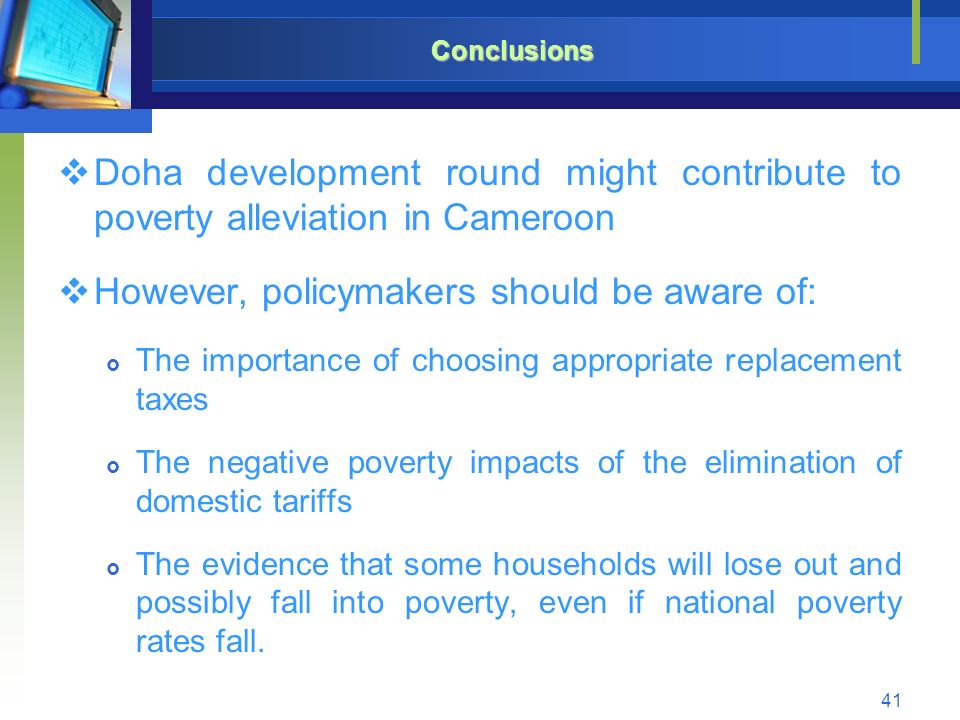
41 Conclusions Doha development round might contribute to poverty alleviation in Cameroon However, policymakers should be aware of: The importance of choosing appropriate replacement taxes The negative poverty impacts of the elimination of domestic tariffs The evidence that some households will lose out and possibly fall into poverty, even if national poverty rates fall.

43
42 Conclusions Free-trade in ROW strongly alleviates poverty, at least at the national level Whereas Cameroon’s own liberalization worsens the poverty and inequality situations In case of combined ROW and own liberalization, the adverse impacts of own liberalization proves to strongly outweigh the favorable outcomes of the ROW liberalization.

Similar presentations


, CUTS International.>")


