Download presentation
Presentation is loading. Please wait.

1
Saginaw KEYS Data Analysis Training for Continuous School Improvement March 20 and 21, 2006 Jacques Nacson jnacson@nea.org jnacson@nea.org Gary Obermeyer obee@learningoptions.net obee@learningoptions.net

2
Workshop Agenda Welcome and Introductions Review of Agenda and Objectives Your Expectations and KEYS Experiences KEYS and Continuous School Improvement: The Action Research Cycle KEYS Data Analysis and Interpretations --Indicators and Predictions --General Data-Related Considerations --Demo Report: Charts and Data Points --Tools and Data Analysis Worksheets --Navigating the Online Data Report and Online Resources The NEA KEYS 2.0 Toolkit and Use of the Action and Facilitation Guides

3
Workshop Objectives To examine KEYS data within the larger context of continuous school improvement processes To learn how to analyze and interpret KEYS data and how results can be shared with school staff and other stakeholders To consider strategies for how KEYS data might be used as a stimulus to drive your targeted school improvement efforts To learn how to use KEYS support materials, including online resources, to help you take next steps beyond preliminary analysis of KEYS data

4
Problem or Opportunity Identified Data Collection Diagnosis & Refinement of Problem Action Planning Action Taking Implementation& Evaluation

5
Model for Understanding and Interpreting KEYS 2.0 Data School completes KEYS 2.0 survey School receives scores on KEYS 42 indicators of school quality Use other data, including student achievement to confirm, validate or justify Make inferences about our school’s quality based on the KEYS results and assessments of other data School makes decisions about next steps and plans for improvement Make judgments based on theories or hypotheses (if, then) to explain “why” Implementation of planned intervention Process & product evaluation including effects on student achievement NEA 6 Keys to School Quality
 to explain why Implementation of planned intervention Process & product evaluation including effects on student achievement NEA 6 Keys to School Quality")
6
General Questions and Principles to Consider Before Looking at Your KEYS 2.0 Data

7
General Questions and Principles to Consider Before Looking at Your KEYS 2.0 Data (continued)
")
8
Flow Chart of Suggested Activities/Processes For Analyzing and Interpreting Your Data School Community Completes KEYS Survey School Improvement Plan Implemented and Evaluated Created a School Improvement Team (SIT) SIT trained in action research, use of quality tools and analysis and interpretation of KEYS Results SIT conducted preliminary analysis and interpretation of KEYS results and prepared for involvement of whole school community SIT assisted whole school community to examine results and make preliminary recommendations SIT considered whole school’s recommendations and begins deliberative process SIT developed preliminary school improvement plan based on KEYS data and other data and present to school community for feedback School improvement plan approved and ready for implementation ? No Yes No Yes ? ? ? ? ? No ? Yes No

9
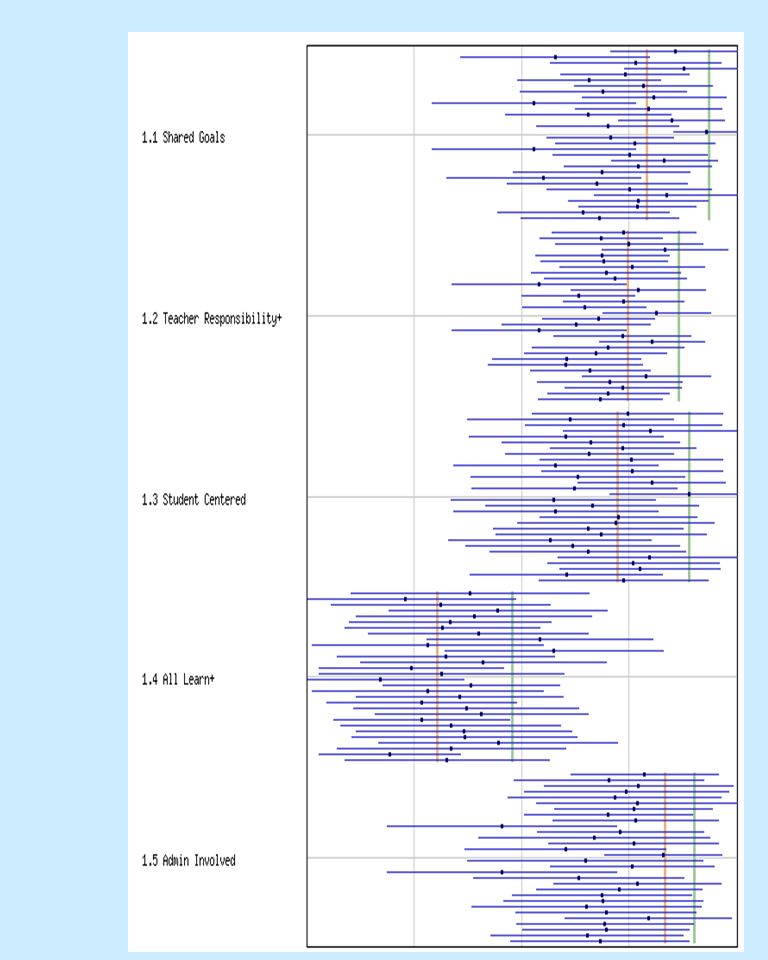
Understanding the Graphs for Each Key Horizontal Axis Measure of quality: 5 point scale Left side Disagree (low value) Right side Agree (high value) Vertical Axis Indicators (groups of questions that measure the same concept) KEY 1. Shared Understanding and Commitment To High Goals Respondents Provide Direct Instruction to Students

10
Understanding the Graphs for Each Key School AverageAll Schools Average 90 th Percentile Score Data Points School average (red) All schools average (38 pilot schools) (Purple) 90 th percentile score of the pilot sample (Yellow) Length of the horizontal bar (Purple) 1 standard deviation above and below the school average (measure of agreement) The Goals for your school in terms of continuous improvement for each indicator The school average moving continuously toward the right side (agree – high value of quality for that indicator) At the same time, reduce the standard deviation (narrow the length of the horizontal bar, meaning greater agreement among respondents) Standard Deviation
 All schools average (38 pilot schools) (Purple) 90 th percentile score of the pilot sample (Yellow) Length of the horizontal bar (Purple) 1 standard deviation above and below the school average (measure of agreement) The Goals for your school in terms of continuous improvement for each indicator The school average moving continuously toward the right side (agree – high value of quality for that indicator) At the same time, reduce the standard deviation (narrow the length of the horizontal bar, meaning greater agreement among respondents) Standard Deviation")
11
District Reports

13
5.4 Safe Environment

14
Worksheet for Analyzing KEYS 2.0 Results (Analysis of Individual Indicators) Preliminary Analysis NOTE: THIS WORKSHEET HAS BEEN REDESIGNED Measures of Quality Degree of Consensus Low ( Wide >1.3 pt.) High ( Narrow <1.3pt.) Very High (between 4.1 & 5.0) High (between 3.4 & 4.0) Low (between 2.1 & 2.6) Very Low (average score between 1 & 2) Indicators Key:_________________ Constituency Group:_________________ Date of Survey:______________________
 Preliminary Analysis NOTE: THIS WORKSHEET HAS BEEN REDESIGNED Measures of Quality Degree of Consensus Low ( Wide >1.3 pt.) High ( Narrow <1.3pt.) Very High (between 4.1 & 5.0) High (between 3.4 & 4.0) Low (between 2.1 & 2.6) Very Low (average score between 1 & 2) Indicators Key:_________________ Constituency Group:_________________ Date of Survey:______________________")
15
Worksheet for Analyzing KEYS 2.0 Results (Analysis of Cross Key Indicators) (Secondary Analysis) Related IndicatorsIndicators Key:_____________________ Constituency Group:____________________ Date of Survey:________________________ score
 (Secondary Analysis) Related IndicatorsIndicators Key:_____________________ Constituency Group:____________________ Date of Survey:________________________ score")
16
Action Guide

17
Facilitation guide

18
Tool Box that contains a CD with all materials

22
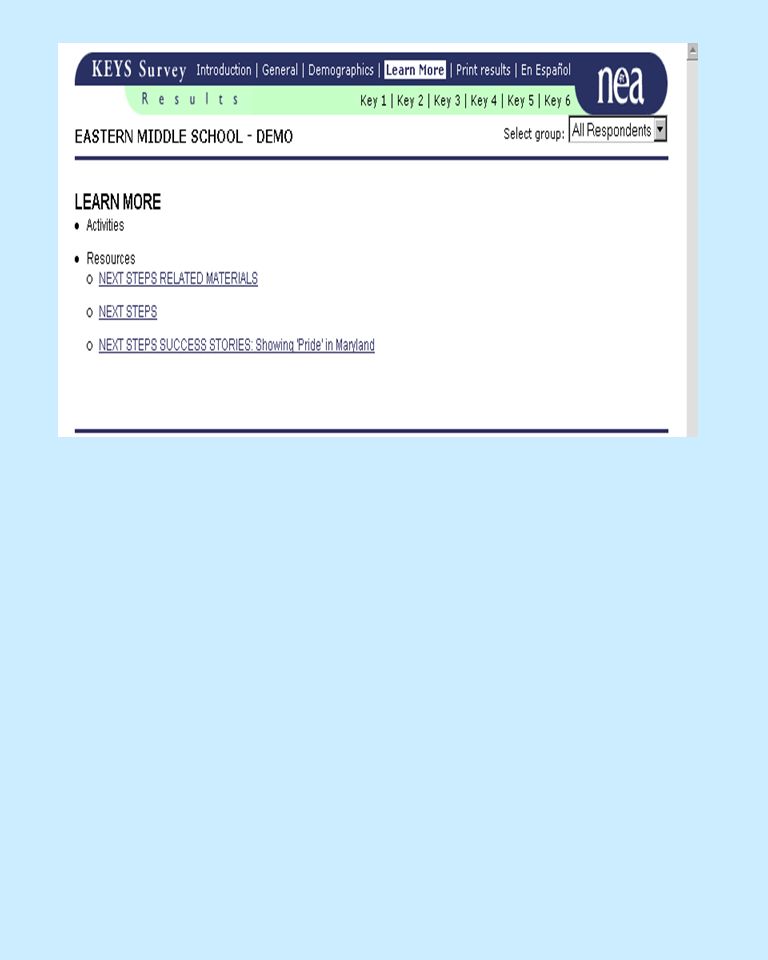
IntroductionIntroduction | General | Demographics | Learn More | Print results | En EspañolGeneralDemographicsLearn MorePrint results En Español Key 1Key 1 | Key 2 | Key 3 | Key 4 | Key 5 | Key 6Key 2Key 3Key 4Key 5Key 6 Select group: Eastern Middle School - DEMO Return to the KEYS Homepage

25
Steps a School Might Take Once KEYS Preliminary Analyses are Completed 1.GAPS: Decide on one indicator or a group of indicators where gap (s) exist. 2.RELEVANCE: Reflect with the “team” on the relevance, importance and priority of the selection. 3.DATA COLLECTION- VALIDATION: Consider the need to collect additional data to validate the KEYS findings. 4.DATA COLLECTION- DIAGNOSIS AND REFINEMENT: Examine what is the “root” cause of the problem.

26
Steps a School Might Take Once KEYS Preliminary Analyses are Completed 5. THEORY OF ACTION: Identify and select the most appropriate solution for your context. 6.ACTION PLANNING: Set achievable goals and develop specific action/project plans. 7.IMPLEMENTATION: Action plans must be implemented for improvement to occur. 8.DATA COLLECTION- EVALUATION: Both process and product evaluations are necessary for learning to happen. 9.BACK TO STEP 1

27
Objectives for Advanced Training KEYS Data Analysis Understand the Value of Data for Making Good Decisions Distinguish Between Symptoms and Root Causes for Continuous Improvement Learn How to Analyze and Use Data through the Continuous Improvement Cycle (PDCA) Use Quality Tools to Improve Process Quality and Student Outcomes Understand the Concept of Variation and Use Control Charts to reduce variation and improve outcomes
 Use Quality Tools to Improve Process Quality and Student Outcomes Understand the Concept of Variation and Use Control Charts to reduce variation and improve outcomes")
28
Agenda for Advanced Training KEYS Data analysis Data and General Data Principles W. Edward Deming – Data and Variation Continuous Improvement Cycle (PDCA) Quality Tools Statistical Process Control-Quality Control Charts Getting to the Root Cause Collecting, Organizing and Analyzing your Data Selecting the Right Intervention Based on Theory and Hypothesis Testing Planning and Carrying Out the Intervention Evaluating the success of the Intervention
 Quality Tools Statistical Process Control-Quality Control Charts Getting to the Root Cause Collecting, Organizing and Analyzing your Data Selecting the Right Intervention Based on Theory and Hypothesis Testing Planning and Carrying Out the Intervention Evaluating the success of the Intervention.")
Similar presentations


>")

 Professional Learning Communities (Self Audit) School Improvement Snapshot School Improvement.>")


 problem to: funding agencies,>")


