Download presentation
Presentation is loading. Please wait.

1
Predicting performance of applications and infrastructures Tania Lorido 27th May 2011

2
Problem definition Objective Predicting utilization of resources (memory, CPU,...) on different computing systems in order to determine application behavior. To predict performance if the available resources change To change available resources in elastic infrastructures Three scenarios Benchmark traces on a simulator (INSEE) NAS Parallel Benchmarks Real applications on real systems (Data from U. of Florida) Applications running in the cloud (Arsys)
 NAS Parallel Benchmarks Real applications on real systems (Data from U. of Florida) Applications running in the cloud (Arsys).")
3
First scenario: INSEE

4
What is INSEE? Interconnection Network Simulation and Evaluation Environment Input: Traces containing messages sent among nodes. Output: Execution time And many other network-related figures

5
Objectives Get a dataset running several traces on the simulator Create different models -> execution time prediction Learn about ML techniques

6
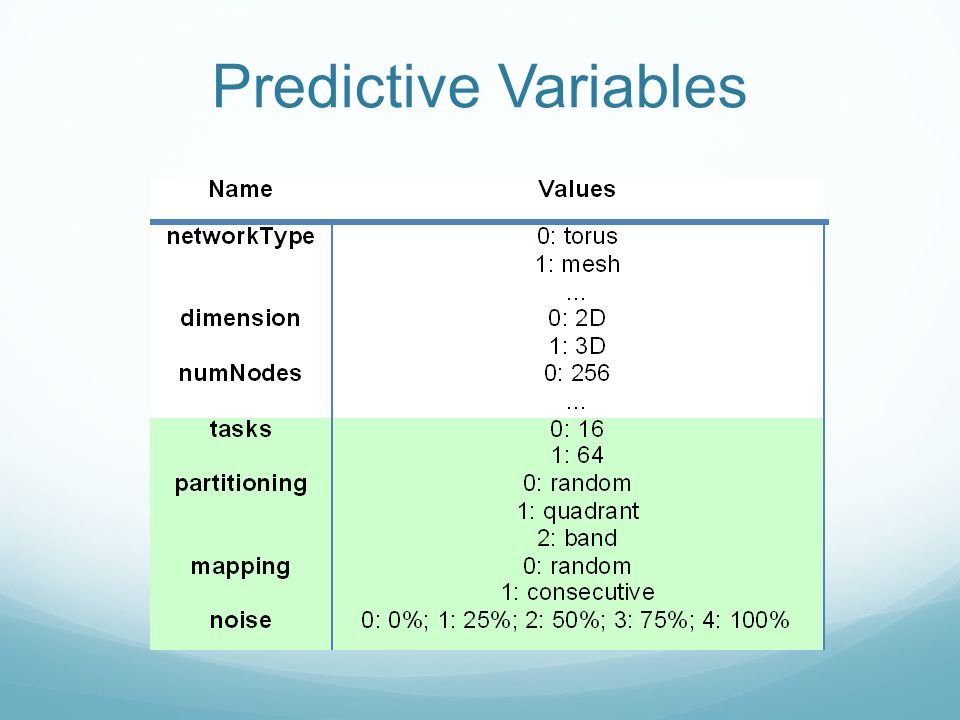
Input traces NAS Parallel Benchmark suite Scientific codes implemented in Fortran + MPI Can run in systems of different sizes Tested with 16 or 64 tasks Run on a real system (Kalimero-like cluster) Captured the whole list of point-to-point messages sent between every pair of tasks.
 Captured the whole list of point-to-point messages sent between every pair of tasks.")
7
Topologies 2D mesh2D torus

8
We have…... a set of tasks: 16 or 64 … a set of nodes: 256 (16x16 torus) How to assign tasks to nodes?
 How to assign tasks to nodes .")
9
Partitioning Selecting a set of nodes Three options: random, band & quadrant An example: We need 4 nodes Topology: mesh

10
Random Band Quadrant

11
Mapping Assigning each task to one of the nodes in the set Two options: random & consecutive Example… … with band partitioning

12
Random Consecutive

13
Background noise In a real environment, several applications compete for the network. We emulate that with random messages sent among nodes: background noise Different levels

14
Predictive Variables

16
Experiment A model for each trace type (7 types) Class variable: execution time discretized in 3 bins Width Height (equal frequency) Classifiers: KNN, Naive Bayes, J48 tree 10 repeated, 5 cross-validation Accuracy
 Class variable: execution time discretized in 3 bins Width Height (equal frequency) Classifiers: KNN, Naive Bayes, J48 tree 10 repeated, 5 cross-validation Accuracy")
17
Results (I)
")
18
Results (II)
")
19
Interpretation for results Quite good results (80-100% of accuracy) Background noise doesn’t affect (information gain = 0.00015) … learning about ML techniques.
 Background noise doesn’t affect (information gain = ) … learning about ML techniques.")
20
Second scenario: parallel application data from the U. of Florida

21
What have they done? Run a couple of real applications on real systems to obtain datasets Apply several regression techniques to predict execution time and other parameters related to resource usage. KNN, LR, DT, SVM, … Propose a new algorithm and compare it with “classical ones”

22
Objectives Repeat the experiment – same results? Discretize variables and apply classification techniques. Multidimensional prediction

23
Real applications Bioinformatics applications: BLAST : Basic Local Alignment Search Tool RAxML : Randomized Axelerated Maximum Likelihood

24
… running on real systems

25
Datasets are available BLASTRAxML 6592 data points Two class variables Execution time (seconds) Output size (bytes) 487 data points Two class variables Execution time (seconds) Resident Set Size, RSS (bytes)
 Output size (bytes) 487 data points Two class variables Execution time (seconds) Resident Set Size, RSS (bytes)")
26
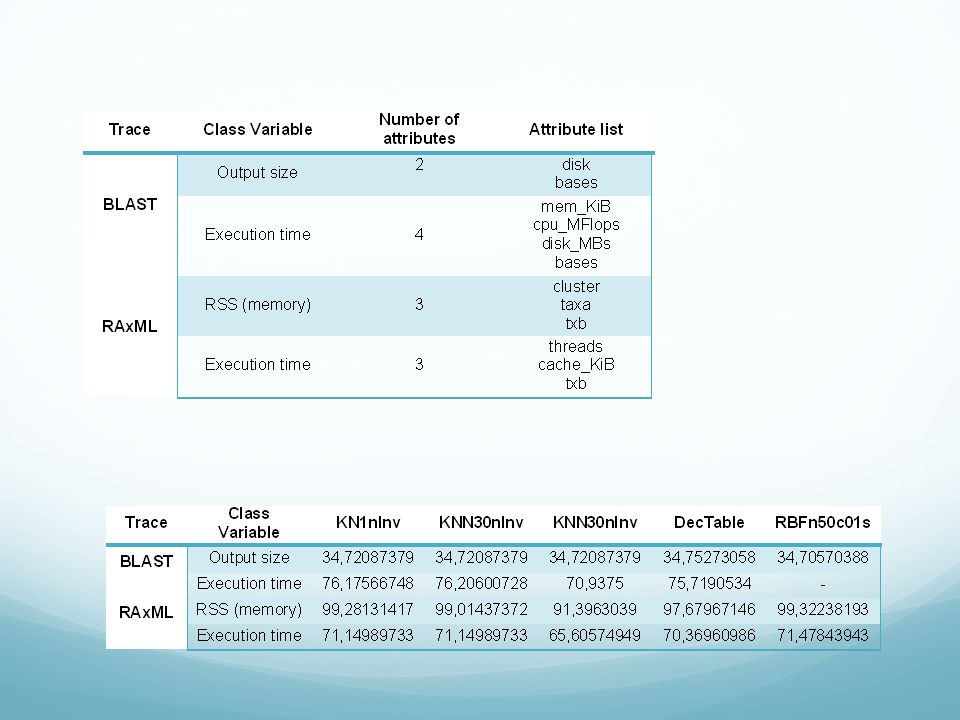
Predictive variables - RAxML

27
Attribute selection Different sets chosen by the authors

28
Testing different classifiers…

29
First experiment - Regression 10 repeated, 10 cross-validation Classifier evaluation: Percentage error where f i = forecast value, a i = actual value Mean Percentage Error

30
Results

31
Second experiment – Classification Output variable discretized in 4 bins Width Height (equal frequency) Predictive variables discretized applying Fayyad Irani Makes groups trying to minimize entropy Same classifiers, except Linear Regression and SVM Classifier evaluation criterion: Accuracy
 Predictive variables discretized applying Fayyad Irani Makes groups trying to minimize entropy Same classifiers, except Linear Regression and SVM Classifier evaluation criterion: Accuracy")
32
Results

33
Interpretation Height-based discretization: 65 – 75% accuracy Width-based discretization 92 – 96% accuracy … BUT…

34
Attribute selection Information gain with respect to the class is 0 (or close to) for some variables Previous attribute selection is done based on author criterion So… we apply: Attribute Evaluator: CfsSubsetEval Search Method: BestFirst And the results….
 for some variables Previous attribute selection is done based on author criterion So… we apply: Attribute Evaluator: CfsSubsetEval Search Method: BestFirst And the results….")
36
Conclusions Regression experiment repeated with the same results Width-based discretization discarded “Same results” after attribute selection And next… Multidimensional prediction: BLAST: Execution time & output size RAxML: Execution time & memory size (RSS)
")
37
Third scenario: prediction of resource demands in cloud computing This is future work

38
What does Arsys offer? (I) Traditional application and web hosting An IaaS cloud computing platform
 Traditional application and web hosting An IaaS cloud computing platform")
39
What does Arsys offer? (II) A tool for the client to create and manage his own VMs: RAM Number of cores Disk space Theoretically, no limits in resource usage Resources can be changed dynamically Elasticity
 A tool for the client to create and manage his own VMs: RAM Number of cores Disk space Theoretically, no limits in resource usage Resources can be changed dynamically Elasticity.")
40
What do they want? A tool that: Monitors resource utilization by a user’s VM… … and predicts future utilization to… … proactively modify resource reservations… … to optimize application performance… … and cost Initially we will focus on the prediction part

41
Variables to predict ( an example ) Used amount of RAM. MB. Used amount of SWAP. MB. Amount of free disk space. MB. Disk performance. KB/s Processor load. MHz Processor use percentage. Network bandwidth usage. Kb/s

42
Approaches 1/0 predictions based on threshold Will a variable reach a certain value? Interval-based predictions Regression Time series Prediction based on trends

43
Questions?

44
Predicting performance of applications and infrastructures Tania Lorido 27th May 2011

Similar presentations


 Computer Science cpsc502, Lecture 15 Nov, 1, 2011 Slide credit: C. Conati, S.>")


 –Each record contains a set of attributes, one of the attributes is the class.>")


