Download presentation
Presentation is loading. Please wait.

1
Statistics

2
Intro to statistics Presentations More on who to do qualitative analysis Tututorial time

3
Inferential statistics

8
Descriptive vs Inferential statistics Descriptive statistics like totals (how many people came?), percentages (what proportion of the total were adolescents?) and averages (how much did they enjoy it?) use numbers to describe things that happen. Descriptive data page Descriptive data page Inferential statistics infer or predict the differences and relationships between things. They also tell us how certain or confident we can be about the predictions.

9
Why statistics are important Statistics are concerned with difference – how much does one feature of an environment differ from another Suicide rates/100,000 people

10
Why statistics are important Relationships – how does much one feature of the environment change as another measure changes The response of the fear centre of white people to black faces depending on their exposure to diversity as adolescents

11
The two tasks of statistics Magnitude: What is the size of the difference or the strength of the relationship? Reliability. What is the degree to which the measures of the magnitude of variables can be replicated with other samples drawn from the same population.

12
Magnitude – what’s our measure? Suicide rates/100,000 people Raw number? Some aggregate of numbers? Mean, median, mode?

13
Arithmetic mean or average Mean (M or X), is the sum ( X) of all the sample values ((X 1 + X 2 + X 3.…… X 22 ) divided by the sample size (N). Mean/average = X/N ABA*BCA*C Overall rating Gener al Unitec 2121 3002 43120 54 7 63 6 7 8 838 16 928 10 57___ 14___ N146 64

14
Compute the mean GeneralUnitec Total ( X) 1262493 N14664 mean8.647.70
 N14664 mean")
15
The median median is the "middle" value of the sample. There are as many sample values above the sample median as below it. If the number (N) in the sample is odd, then the median = the value of that piece of data that is on the (N-1)/2+1 position of the sample ordered from smallest to largest value. E.g. If N=45, the median is the value of the data at the (45-1)/2+1=23 rd position If the sample size is even then the median is defined as the average of the value of N/2 position and N/2+1. If N=64, the median is the average of the 64/2 (32 nd ) and the 64/2+1(33 rd ) position
 in the sample is odd, then the median = the value of that piece of data that is on the (N-1)/2+1 position of the sample ordered from smallest to largest value. E.g. If N=45, the median is the value of the data at the (45-1)/2+1=23 rd position If the sample size is even then the median is defined as the average of the value of N/2 position and N/2+1. If N=64, the median is the average of the 64/2 (32 nd ) and the 64/2+1(33 rd ) position.")
16
Other measures of central tendency The mode is the single most frequently occurring data value. If there are two or more values used equally frequently, then the data set is called bi- modal or tri-modal, etc The midrange is the midpoint of the sample - the average of the smallest and largest data values in the sample. (= (2+10)/2 =6 for both groups The geometric mean (log transformation) =8.46 (general) and 7.38 (Unitec) The harmonic mean (inverse transformation) =8.19 (general) and 6.94 (Unitec) Both these last measures give less weight to extreme scores
/2 =6 for both groups The geometric mean (log transformation) =8.46 (general) and 7.38 (Unitec) The harmonic mean (inverse transformation) =8.19 (general) and 6.94 (Unitec) Both these last measures give less weight to extreme scores.")
17
Compute the median and mode Overall ratingGeneralUnitec 211 302 430 547 636 7128 83816 92810 5714 N14664

18
Means, median, mode GeneralUnitec N14664 mean8.647.70 median98 mode108 geometric mean8.497.38 harmonic mean8.196.94

20
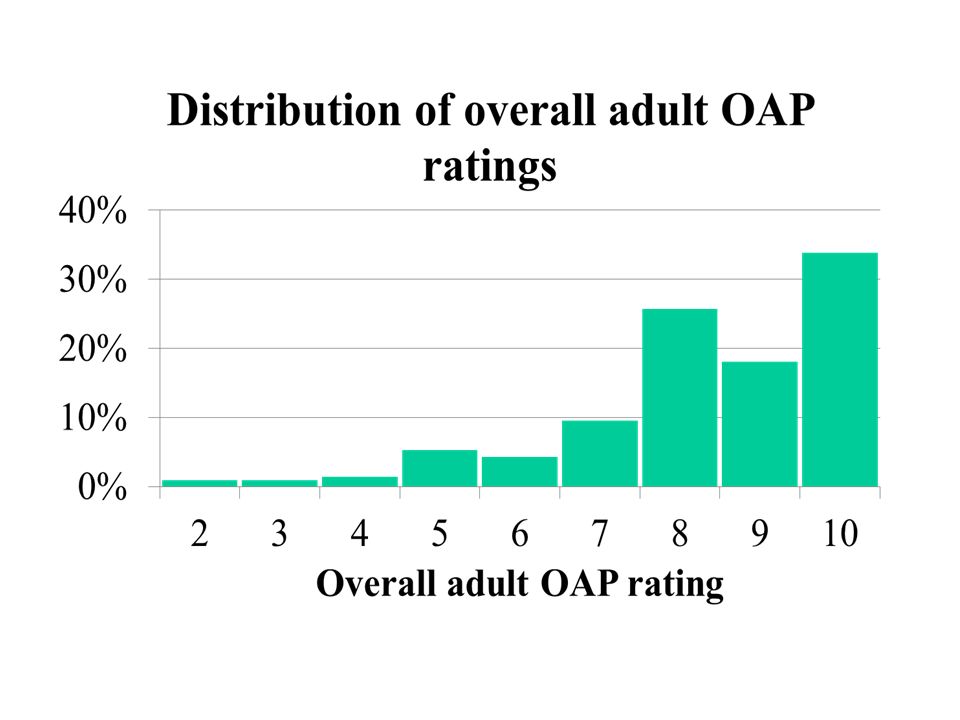
The underlying distribution of the data

21
Normal distribution

22
Data that looks like a normal distribution

23
Three things we must know before we can say events are different 1.the difference in mean scores of two or more events - the bigger the gap between means the greater the difference 2.the degree of variability in the data - the less variability the better, as it suggests that differences between are reliable

24
Variance and Standard Deviation These are estimates of the spread of data. They are calculated by measuring the distance between each data point and the mean variance (s 2 ) is the average of the squared deviations of each sample value from the mean = s 2 = X-M) 2 /(N-1) The standard deviation (s) is the square root of the variance.
 is the average of the squared deviations of each sample value from the mean = s 2 = X-M) 2 /(N-1) The standard deviation (s) is the square root of the variance..")
25
Calculating the Variance (s 2 ) and the Standard Deviation (s) for the Unitec sample Xn(X-Mu)(X-Mu) 2 *n Overall ratingUnitec 21-5.7032.5 32-4.7044.2 40-3.700.0 57-2.7051.1 66-1.7017.4 78-0.704.0 8160.301.4 9101.3016.8 10142.3073.9 N64 241.4 Mean Unitec (Mu)=7.70Variance=3.83 SD or s=1.96
 and the Standard Deviation (s) for the Unitec sample Xn(X-Mu)(X-Mu) 2 *n Overall ratingUnitec N Mean Unitec (Mu)=7.70Variance=3.83 SD or s=1.96")
26
All normal distributions have similar properties. The percentage of the scores that is between one standard deviation (s) below the mean and one standard deviation above is always 68.26% s
 below the mean and one standard deviation above is always 68.26% s.")
27
Is there a difference between Unitec and General overall OAP rating scores

28
Is there a significant difference between Unitec and General OAP rating scores ss

29
Three things we must know before we can say events are different 3.The extent to which the sample is representative of the population from which it is drawn - the bigger the sample the greater the likelihood that it represents the population from which it is drawn - small samples have unstable means. Big samples have stable means.

30
Estimating difference The measure of stability of the mean is the Standard Error of the Mean = standard deviation/the square root of the number in the sample. So stability of mean is determined by the variability in the sample (this can be affected by the consistency of measurement) and the size of the sample. The standard error of the mean (SEM) is the standard deviation of the normal distribution of the mean if we were to measure it again and again
 and the size of the sample. The standard error of the mean (SEM) is the standard deviation of the normal distribution of the mean if we were to measure it again and again.")
31
Yes it’s significant. The mean of the smaller sample (Unitec) is not too variable. Its Standard Error of the Mean = 0.24. 1.96 *SE = 0.48 = the 95% confidence interval. The General mean falls outside this confidence interval ss

32
Is the difference between means significant? What is clear is that the mean of the General group is outside the area where there is a 95% chance that the mean for the Unitec Group will fall, so it is likely that the General mean comes from a different population as the Unitec mean. The convention is to say that if mean 2 falls outside of the area (the confidence interval) where 95% of mean 1 scores is estimated to be, then mean 2 is significantly different from mean 1. We say the probability of mean 1 and mean 2 being the same is less than 0.05 (p<0.05) and the difference is significant p
 where 95% of mean 1 scores is estimated to be, then mean 2 is significantly different from mean 1. We say the probability of mean 1 and mean 2 being the same is less than 0.05 (p<0.05) and the difference is significant p.")
33
The significance of significance Not an opinion A sign that very specific criteria have been met A standardised way of saying that there is a There is a difference between two groups – p<0.05; There is no difference between two groups – p>0.05; There is a predictable relationship between two groups – p<0.05; or There is no predictable relationship between two groups - p>0.05. A way of getting around the problem of variability

34
If you argue for a one tailed test – saying the difference can only be in one direction, then you can add 2.5% error from side where no data is expected to the side where it is 2.5% of distri- bution 95% of distri- bution 2-tailed test 1-tailed test -1.96 +1.96 Standard deviations One and two tailed tests

35
T-test result t-Test: Two-Sample Assuming Unequal Variances General adultsUnitec adults Mean8.647.7 Variance2.343.83 Observations14664 t Stat for p<0.053.41 p one-tail0.00 t Critical one-tail1.66 p two-tail0.00 t Critical two-tail1.98

36
MasseyUnsworth Heights Mean9.238.33 Variance1.204.24 Observations5215 t Stat for p<0.051.62 p one-tail0.06 t Critical one-tail1.75 p two-tail0.12 t Critical two-tail2.12 malefemale Mean8.948.65 Variance1.552.28 Observations83125 t Stat for p<0.051.52 p one-tail0.07 t Critical one-tail1.65 p two-tail0.13 t Critical two-tail1.97

Similar presentations


 MODULE 2 NUMERICAL DATA REPRESENTATION.>")


 Ryan Glaman Brett Kellerstedt 1.>")
