Download presentation
Presentation is loading. Please wait.

1
Lambert E. Murray, Ph.D. Professor of Physics
An Introduction to Astronomy Part XII: The Milky Way and other Galaxies Lambert E. Murray, Ph.D. Professor of Physics

2
Fish-Eye View of the Night Sky

3
The Nature of the Milky Way
The Milky Way, as the bright central region in the last picture is known, has been visible to observers from ancient times. The nature of the milky way, however, way was not know until Galileo began to make observations with his telescope. He observed that the Milky Way was a large collection of stars concentrated in a certain region of the sky. Star counts by Sir William Herschel in the 1800s confirmed the “disk” nature of the Milky Way. Based on his data, Herschel concluded, incorrectly, that the sun was at the center of the disk.

5
Wide Angle View of Milky Way

6
Computer Generated Picture of Milky Way Galaxy

7
But What is the Milky Way
Is it the sum total of all the stars in our universe – are these all distributed in a disk? Or is the Milky Way but one member of a large number of “island universes” as was proposed by Immanuel Kant? After 1845 Lord Rosse examined many of the “nebulae” which Hershell had observed and found that some of these has a distinctly spiral shape. The lack of resolution in the telescopes of the day made it difficult to determine if these “nebulae” were gas clouds are distant groups of stars.

8
Higher Resolution: Gas Cloud or Island Universe?

9
The Answer: A New Standard Candle
The term “standard candle” is the name given to a stellar distance measuring devise. Remember that stellar distances can be determined if the luminosity of a star is known. A “standard candle” is a star with known luminosity Henrietta Leavitt in 1912 published her study of Class I Cephied variables found in the Small Magellanic Cloud. At the time it was not known that the Small Magellanic Cloud was a galaxy apart from the Milky Way. It was believed to be just another grouping of stars within the Milky Way like other open- and globular-clusters.

10
Cepheid Variables The first observed Cepheid variable is -Cephei, in the constellation Cepheus. Later, other stars were observed to have this same characteristic light curve — rapid brightening followed by slow dimming Doppler measurements show that these stars are pulsating in rhythm with their changes in luminosity. Since they are very large stars they are a fairly easy class of stars to identify.

11
The Period Luminosity Curve for Cephied Variable Stars
Leavitt assumed that all the Cepheid variables found within the Small Magellanic Cloud were roughly the same distance from us. She found that those Cephied variables with greater apparent magnitude had longer periods than those with less apparent magnitude. Using the assumption that all the stars are equal distant from us, and that their apparent magnitudes are related to their period, we can derive a luminosity – period relationship if we can determine that absolute magnitude of a single Cephied variable.

12
Period – Luminosity Relationship for Cepheid Variables

13
Cepheid Variables and Distance
Variations in the brightness of Cepheid variables corresponds to variations in the size of the star (as determined from Doppler shift measurements). There are two types of Cepheid variables: Type I Cepheid variables are metal-rich, and are brighter than type II Cepheid variables. Type II were not discovered until 1940’s and led to some confusion. Cepheid variables can act as “standard candles” to determine the distance even to distant galaxies if we can identify individual stars, since the period luminosity curve provides a means of calibration of the Cepheids.
. There are two types of Cepheid variables: Type I Cepheid variables are metal-rich, and are brighter than type II Cepheid variables. Type II were not discovered until 1940’s and led to some confusion. Cepheid variables can act as standard candles to determine the distance even to distant galaxies if we can identify individual stars, since the period luminosity curve provides a means of calibration of the Cepheids.")
15
Note on This Distance Scale
When Cepheid variables were first utilized, there were no Cepheid variables close enough to measure their distance using direct parallax measurements. Distances to the Cepheid variables in our own galaxy were determined using statistical techniques, and were dependent upon these theoretical calculations. This situation recently changed with the Hipparcos satellite, and we were able to get a more accurate measure of this important “standard candle”. It turns out that the Cepheid variable stars are actually brighter than was initially guessed using the statistical arguments. As a result, we now know that objects are actually about 10% farther away than we previously had thought, i.e., the universe is about 10% larger than we thought.

16
Two Types of Cepheid Variables
There are two types of Cepheid variables: Type I Cepheid variables are metal-rich, and are brighter than type II Cepheid variables. Each type has a characteristic Period – Luminosity curve. They can be differentiated based upon their spectra.

17
The Period-Luminosity Plot for Cepheid Variable Stars

18
Hubble’s Measurement for M31
Making use of a Cepheid variable star he observed in M31 (a spiral-shaped nebula), Hubble concluded that this nebula was 2.2 million light years beyond the Milky Way, thus establishing the existence of “island universes”, or what we today call galaxies. Today we recognize M31 as the Andromeda Galaxy, the only object not part of the Milky Way that can be seen with the naked eye from the Earth’s northern hemisphere.
, Hubble concluded that this nebula was 2.2 million light years beyond the Milky Way, thus establishing the existence of island universes , or what we today call galaxies. Today we recognize M31 as the Andromeda Galaxy, the only object not part of the Milky Way that can be seen with the naked eye from the Earth’s northern hemisphere.")
19
M31 – The Andromeda Galaxy

20
Star Clusters Found in the Milky Way
There are basically two types of star clusters found in the Milky Way: Globular Clusters – Spherical clusters of a large number of stars. These star clusters are found to be distributed approximately spherically about the center of the galaxy. Open Clusters – These clusters are relatively open in structure and are found more in the spiral arms of the galaxy, often associated with areas rich in interstellar gases and dust.

21
Globular Clusters A globular cluster is a spherical group of up to hundreds of thousands of stars, found primarily in the halo of the Galaxy. The average separation of stars near the center of a globular cluster is 0.5 light-year. Stars in the region of our Sun average 4–5 light-years apart.

22
Globular Cluster M13

24
An Open Cluster

25
Shapley Uses RR Lyra Variables to Determine our Place in the Milky Way
Shapley made use of RR Lyra variable stars found in many globular clusters to determine the distances to these clusters. RR Lyra variables, like the Cepheid variables also have a period – luminosity relationship. By measuring the distances to, and the relative locations of the globular clusters, Shapley determined that these clusters were spherically distributed about a point not centered on the Earth. He made the correct assumption that these clusters are clustered around the center of the galaxy.

27
Shapley’s Conclusions
Shapley correctly concluded that the sun lay about 2/3 of the way out from the center of the galactic disk. Shapley’s distance measurements, however, were wrong, for like many early astronomers, he was unaware of the importance of the Interstellar Medium (or ISM) and the dimming produced by the interstellar dust. This same mistake had earlier convinced William Herschel that the earth was at the center of the galaxy. He had argued that the center of the galaxy should have more stars. But when he counted the stars is the Milky Way he found that there were about as many stars is one direction as the other. He did not know about the obscuring gas and dust in the center of our field of view.
 and the dimming produced by the interstellar dust. This same mistake had earlier convinced William Herschel that the earth was at the center of the galaxy. He had argued that the center of the galaxy should have more stars. But when he counted the stars is the Milky Way he found that there were about as many stars is one direction as the other. He did not know about the obscuring gas and dust in the center of our field of view.")
28
Our Galaxy

29
Radar Mapping of the Milky Way
Radar can penetrate dust and clouds, unlike the visible region of the electromagnetic spectrum. Radar was used to map the surface of Venus through its constant cloud cover. Radar has been used to map the location and relative motion of different parts of the Milky Way Galaxy because it can penetrate the gas and dust clouds in the plane of the galaxy.

30
Our Galaxy as Mapped by Radar

31
What it Might Look Like in Visible Light

32
Galactic Rotation Measurments of the velocities of large numbers of stars in the Milky Way allow astronomers to determine the speed of the sun as it orbits the center of the galaxy. The sun, and most of its neighboring stars are found to move at ~ 220 km/sec. Thus, it takes about 240 million years for the solar system to make one complete orbit.

33
Consider a galaxy like our own.......
Knowing the orbital speed, one can calculate the force of gravity necessary...which in turns tells how much mass is necessary to keep the sun in orbit This mass is about 1011 M0 Assuming most stars are like the sun, gives about 100 billion stars in the galaxy. force of gravity solar system Consider a galaxy like our own

34
For Theoretical Galaxies
Rotation Curves For Theoretical Galaxies Rotation curve if all the known mass were located at the center Rotation curve if most mass were near the center tapering off near the edges Actual rotation curve for the Milky Way galaxy

35
Rotation Curves for Other Spiral Galaxies

36
An Interesting Dilemma
The rotation rate of a star in the galaxy depends upon the mass distribution in the galaxy. A number of spiral galaxies have rotation curves that are similar to one another. These rotation curves are inconsistent with the assumption that most of the mass of the galaxy is located toward the center of the galaxy – although that is the way things appear in the regions of the spectrum that we can detect.

37
Dark Matter This would seem to indicate that there is a large amount of matter which is not “visible” in the outer arms of the spiral galaxies. We have already noticed the existence of large dark nebulae associated with cool gases and dust. Much of the mass of a galaxy must be “dark matter”. The nature of this “dark matter” is an active topic of discussion in the astronomical community today.

38
Galaxies, Galaxies, Everywhere

39
The Universe if Full of Them
We now know that there are galaxies in all directions – thousands of them (perhaps millions) that we can see. These galaxies are distributed throughout space, but do seem to show some groupings indicating mutual gravitational interactions The following diagram is a plot of the location of some 9325 galaxies in two wedges of the universe
 that we can see. These galaxies are distributed throughout space, but do seem to show some groupings indicating mutual gravitational interactions. The following diagram is a plot of the location of some 9325 galaxies in two wedges of the universe.")
40
A Plot of 9325 Galaxies

41
Our Local Group

42
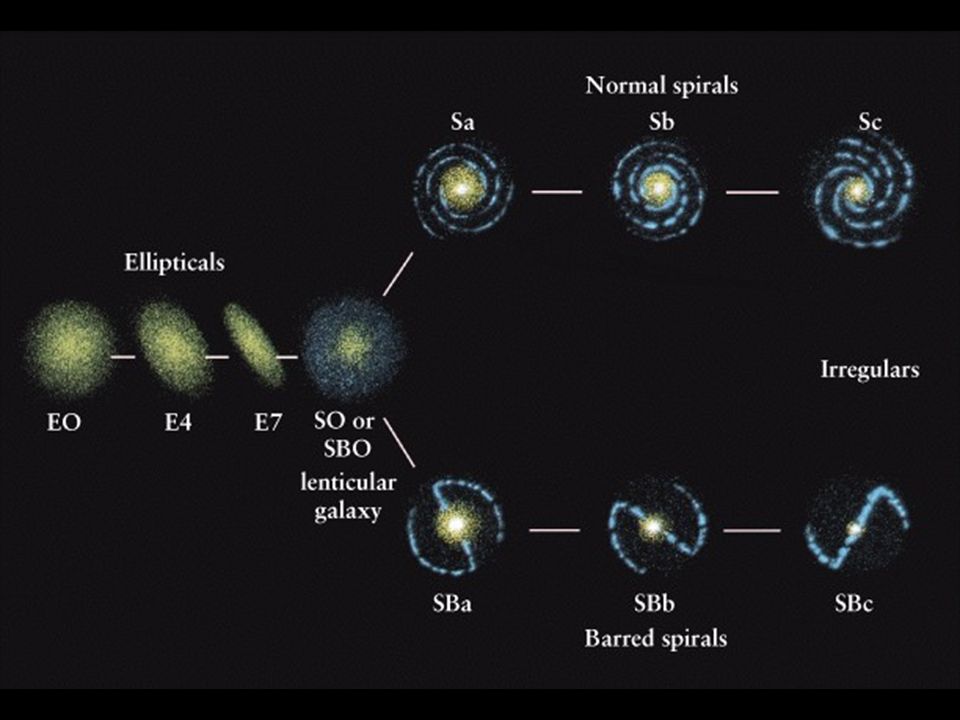
Classification of Galaxies
Galaxies are typically classified by their shape. The three major shapes are: Spiral Elliptical Bar These are then subdivided according to the following scheme.

44
Hubble’s Observation Relating the Nuclear Bulge to the Spiral Arms
Hubble, once he realized the “spiral nebulae” were really galaxies spent much time trying to classify these galaxies. He noted that the size of the nuclear bulge in spiral galaxies is correlated to the tightness of the spiral arms – the larger the bulge, the tighter the spiral arms.

45
Classification of Spirals
Note the correlation of the relative size of the nuclear bulge to the tightness of the spiral arms.

46
Determining Distances to Galaxies
Cepheid variable stars can be used to measure the distances to galaxies that are within about 60 Mpc (200 million ly). Beyond that other standard candles must be used – these all depend upon knowing (or at least having some estimate of) the absolute magnitude of the standard candle. Other standard candles which are used. Red and Blue Supergiants (out to about 250 Mpc or 800 million ly) Bright Globular clusters (out to 400 Mpc) Bright HII regions (out to 900 Mpc) Supernova explosions (beyond 900 Mpc)
. Beyond that other standard candles must be used – these all depend upon knowing (or at least having some estimate of) the absolute magnitude of the standard candle. Other standard candles which are used. Red and Blue Supergiants (out to about 250 Mpc or 800 million ly) Bright Globular clusters (out to 400 Mpc) Bright HII regions (out to 900 Mpc) Supernova explosions (beyond 900 Mpc)")
47
The Tully-Fisher Relation
Yet another standard candle is the line width of the 21-cm hydrogen emission line. The Tully-Fisher relation indicates that the broader the emission line, the brighter the galaxy. Thus the width of the emission line can be used to determine the absolute magnitude of a distant galaxy. The reason this works is that the line width is determined by the Doppler shift – red shifted on the receding side and blue shifted on the approaching side of the galaxy. The larger the shift (the wider the line) the faster the rotation of the galaxy, the more mass contained in the galaxy, thus the more stars – giving rise to a brighter galaxy.
 the faster the rotation of the galaxy, the more mass contained in the galaxy, thus the more stars – giving rise to a brighter galaxy.")
48
The Hubble Law As early as 1914, Slipher, working at the Lowell Observatory had observed that a large number of spiral galaxies that he had been studying exhibited a red shift in their spectra – indicating that most of these galaxies were moving away from us. During the 1920’s Edwin Hubble determined the distances to a number of these galaxies using Cepheid variable stars and noticed a correlation between the distance to the galaxies and the observed red–shift of the spectrum. He found that the farther away a galaxy was, the greater the red-shift.

49
Galaxies and Their Red-Shift

50
The Hubble Law

51
The Hubble Law as a Standard Candle
The Hubble relationship has been so well established that it is now used to determine the distance to far away galaxies. We appear to be in an ever-expanding universe where the galaxies are moving farther and farther away from one another (much like raisins in raisin bread as it rises).
.")
52
End of Part XII

Similar presentations


 They all have.>")


