Download presentation
Presentation is loading. Please wait.

1
Introduction to Data Assimilation: Lecture 2
Saroja Polavarapu Meteorological Research Division Environment Canada PIMS Summer School, Victoria. July 14-18, 2008

2
Outline of lecture 2 Covariance modelling – Part 1
Initialization (Filtering of analyses) Basic estimation theory 3D-Variational Assimilation (3Dvar)
 Basic estimation theory. 3D-Variational Assimilation (3Dvar)")
3
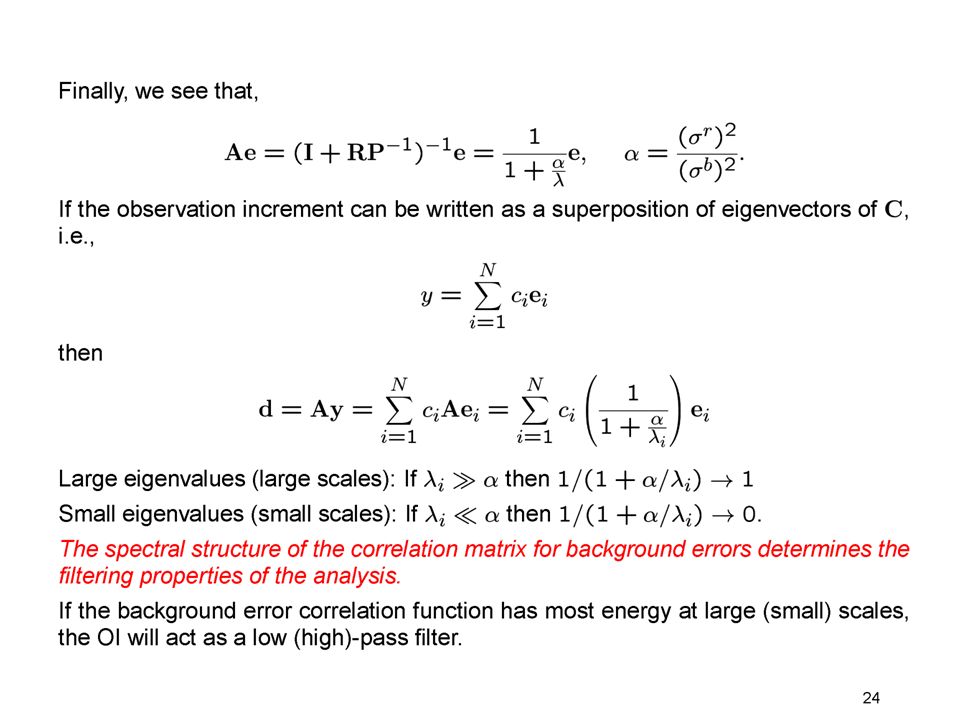
Background error covariance matrix filters analysis increments
Analysis increments (xa – xb) are a linear combination of columns of B Properties of B determine filtering properties of assimilation scheme!
 are a linear combination of columns of B. Properties of B determine filtering properties of assimilation scheme!")
4
A simple demonstration of filtering properties of B matrix
K

6
Choose a correlation function and obs increment shape then compute analysis increments
cos(x) cos(2x) sobs/sb = 0.5
 cos(2x) sobs/sb = 0.5.")
7
cos(3x) cos(4x) cos(5x) cos(6x)
 cos(4x) cos(5x) cos(6x)")
8
cos(7x) cos(9x) cos(8x) cos(10x)
 cos(9x) cos(8x) cos(10x)")
9
1. Covariance Modelling Innovations method NMC-method Ensemble method

10
Background error covariance matrix
If x is 108, Pb is 108 x 108. With 106 obs, cannot estimate Pb. Need to model Pb. The fewer the parameters in the model, the easier to estimate them, but less likely the model is to be valid

11
1. Innovations method Historically used for Optimal Interpolation
(e.g. Hollingsworth and Lonnberg 1986, Lonnberg and Hollingsworth 1986, Mitchell et al. 1990) Typical assumptions: separability of horizontal and vertical correlations Homogeneity Isotropy r i j q l m r i j m l
 Typical assumptions: separability of horizontal and vertical correlations. Homogeneity. Isotropy. r. i. j. q. l. m. r. i. j. m. l.")
12
Assume homogeneous, isotropic correlation model. Choose a
Background error Instrument+ representativeness Choose obs s.t. these terms =0 Dec. 15/87-Mar. 15/88 radiosonde data. Model: CMC T59L20 Assume homogeneous, isotropic correlation model. Choose a continuous function r(r) which has only a few parameters such as L, correlation length scale. Plot all innovations as a function of distance only and fit the function to the data. Mitchell et al. (1990)
 which has. only a few parameters such as. L, correlation length scale. Plot all. innovations as a function of distance. only and fit the function to the data. Mitchell et al. (1990)")
13
Obs and Forecast error variances
Mitchell et al. (1990) Mitchell et al. (1990)
 Mitchell et al. (1990)")
14
Vertical correlations
of forecast error Height Lonnberg and Hollingsworth (1986) Non-divergent wind Hollingsworth and Lonnberg (1986)
 Non-divergent wind. Hollingsworth and Lonnberg (1986)")
17
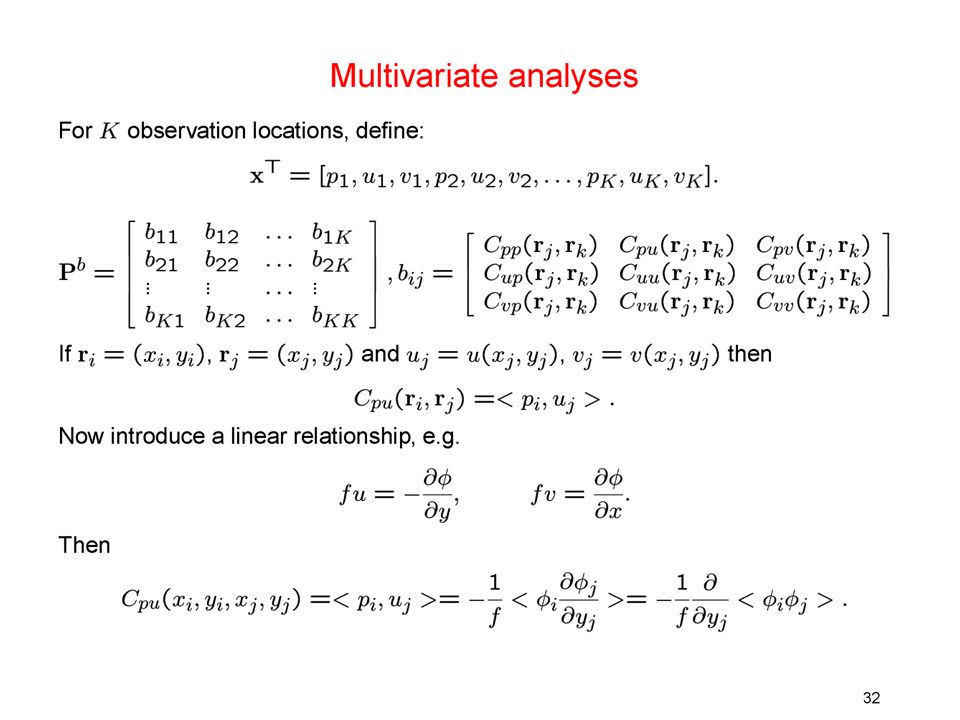
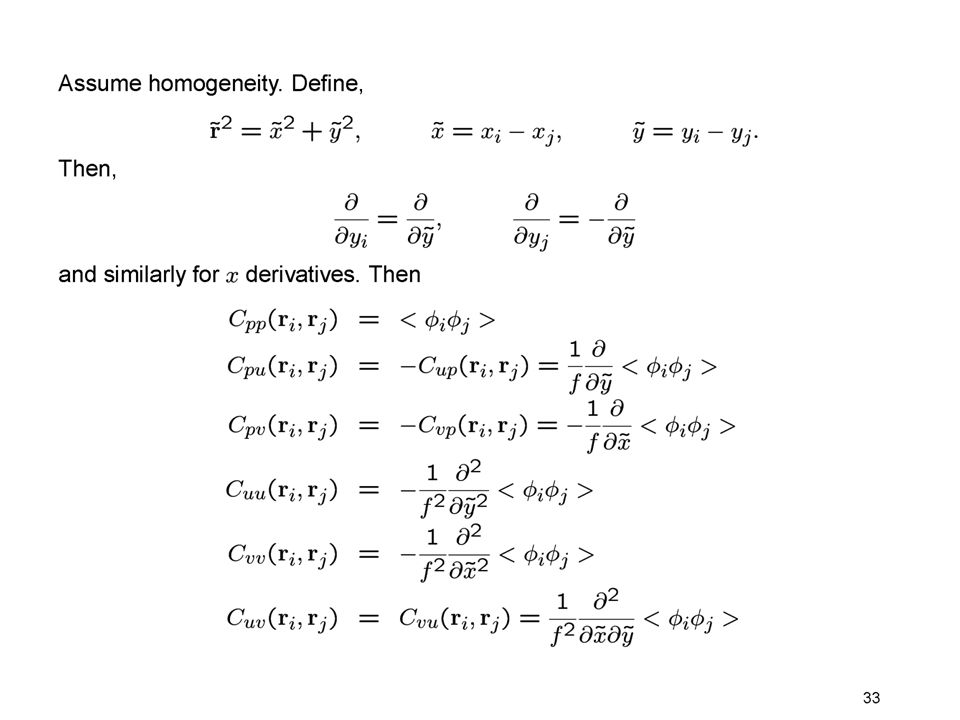
Multivariate correlations
Bouttier and Courtier 2002 Mitchell et al. (1990)
")
18
Covariances are not homogeneous
If covariances are homogeneous, variances are independent of space Covariances are not homogeneous If correlations are homogeneous, correlation lengths are independent of location Correlations are not homogeneous

19
Correlations are not isotropic
Gustafsson (1981) Daley (1991)
 Daley (1991)")
20
Are correlations separable?
If so, correlation length should be Independent of height. Lonnberg and Hollingsworth (1986) Mitchell et al. (1990)
 Mitchell et al. (1990)")
21
Covariance modelling assumptions:
No correlations between background and obs errors No horizontal correlation of obs errors Homogeneous, isotropic horizontal background error correlations Separability of vertical and horizontal background error correlations None of our assumptions are really correct. Therefore Optimal Interpolation is not optimal so it is often called Statistical Interpolation.

22
2. Initialization Nonlinear Normal Mode (NNMI)
Digital Filter Initialization (DFI) Filtering of analysis increments
 Filtering of analysis increments.")
23
Balance in data assimilation
Starting from analysis with insufficient consideration of balance, get noise This is they type of noise that made Richardson’s forecast appear unrealistic NNMI greatly reduces the noise but captures the signal well. Daley 1991

24
The “initialization” step
Integrating a model from an analysis leads to motion on fast scales Mostly evident in surface pressure tendency, divergence and can affect precipitation forecasts 6-h forecasts are used to quality check obs, so if noisy could lead to rejection of good obs or acceptance of bad obs Historically, after the analysis step, a separate “initialization” step was done to remove fast motions In the 1980’s a sophisticated “initialization” scheme based on Normal modes of the model equations was developed and used operationally with OI.

25
Nonlinear Normal Mode Initialization (NNMI)
Consider model Determine modes Separate R and G Project onto G Define balance Solution 1. E_G includes deep, high-frequency gravitational modes. E_R includes rotational modes but also shallow or low frequency gravitational modes. In early NNMI, c_R was held fixed, although that was not optimal as Saroja will desribe

26
The slow manifold G R S A N L

27
Starting from analysis with insufficient consideration of balance, get noise
This is they type of noise that made Richardson’s forecast appear unrealistic NNMI greatly reduces the noise but captures the signal well. Daley 1991

28
Digital Filter Initialization (DFI)
Lynch and Huang (1992) N=12, Dt=30 min Tc=6 h Tc=8 h Fillion et al. (1995)
 N=12, Dt=30 min. Tc=6 h. Tc=8 h. Fillion et al. (1995)")
29
Combining Analysis and Initialization steps
Doing an analysis brings you closer to the data. Doing an initialization moves you farther from the data. Gravity modes N Rossby modes Daley (1986)
")
30
Variational Normal model initialization
Daley (1978), Tribbia (1982), Fillion and Temperton (1989), etc. Minimize I such that uI, vI, fI stays on M. Daley (1986)
, Tribbia (1982), Fillion and Temperton (1989), etc. Minimize I such that uI, vI, fI stays on M. Daley (1986)")
31
So filter analysis increments only
Some signals in the forecast e.g. tides should NOT be destroyed by NNMI! So filter analysis increments only Distance from origin gives amplitude of mode, angle from pos real axis its phase. Circular trajectory about origin: propagting linear wave. Circular trajectory with offset: a stationary component equal to the magnitude of the offset is also present. Semi-diurnal mode has amplitude seen in free model run, if anl increments are filtered Seaman et al. (1995)
")
32
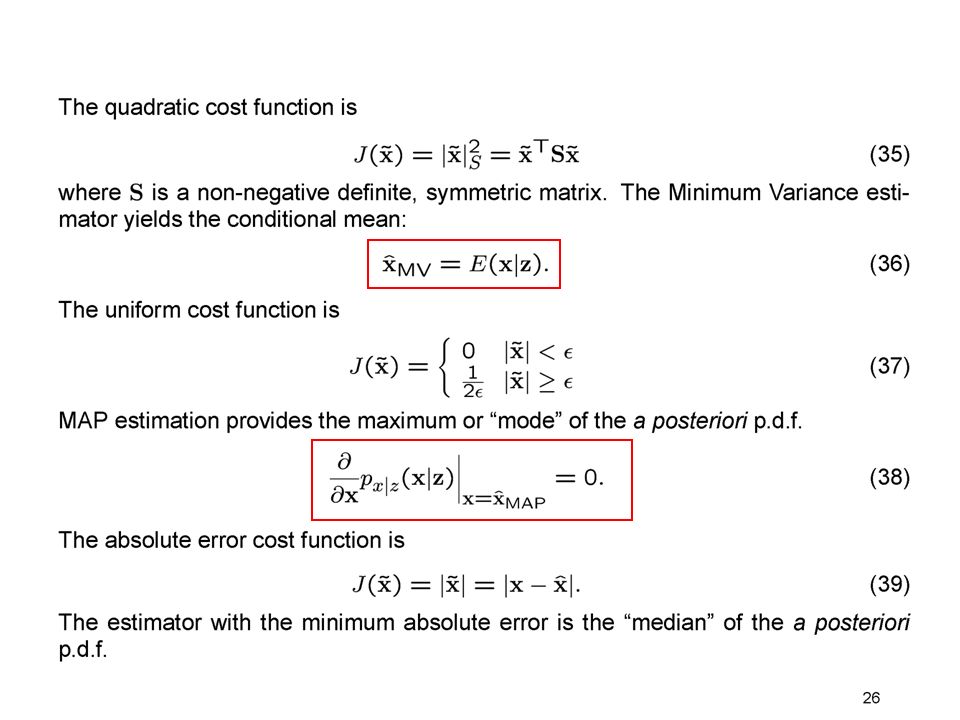
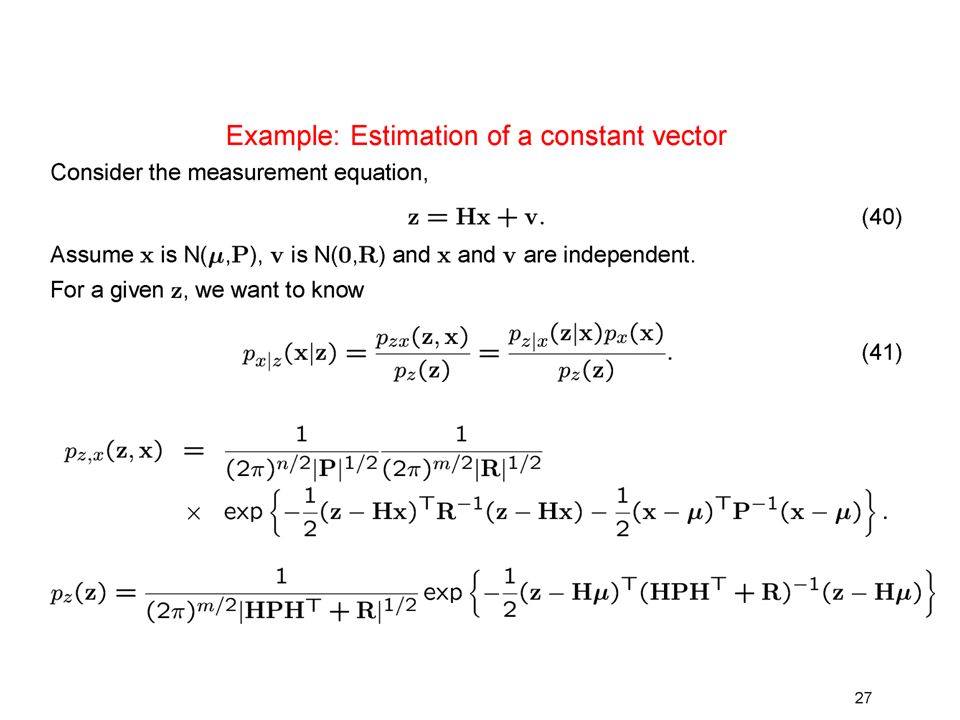
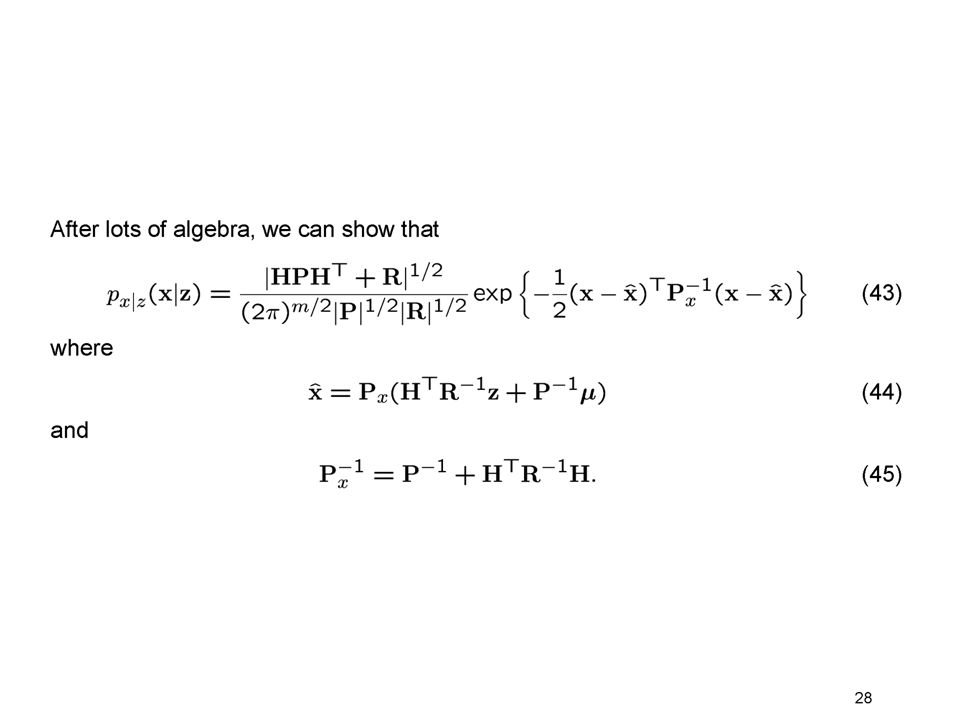
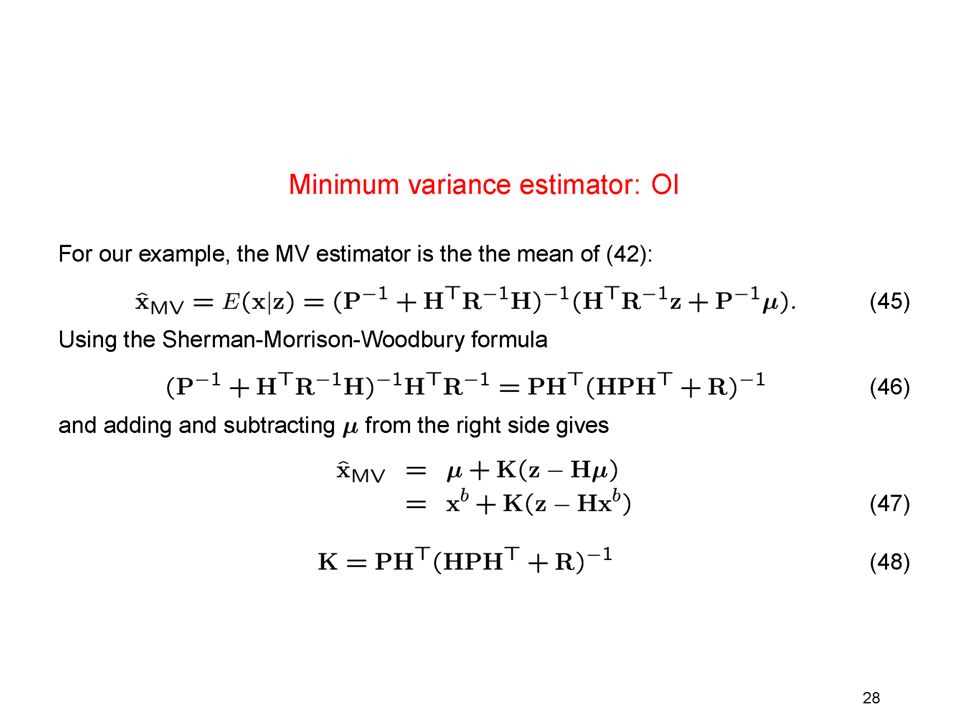
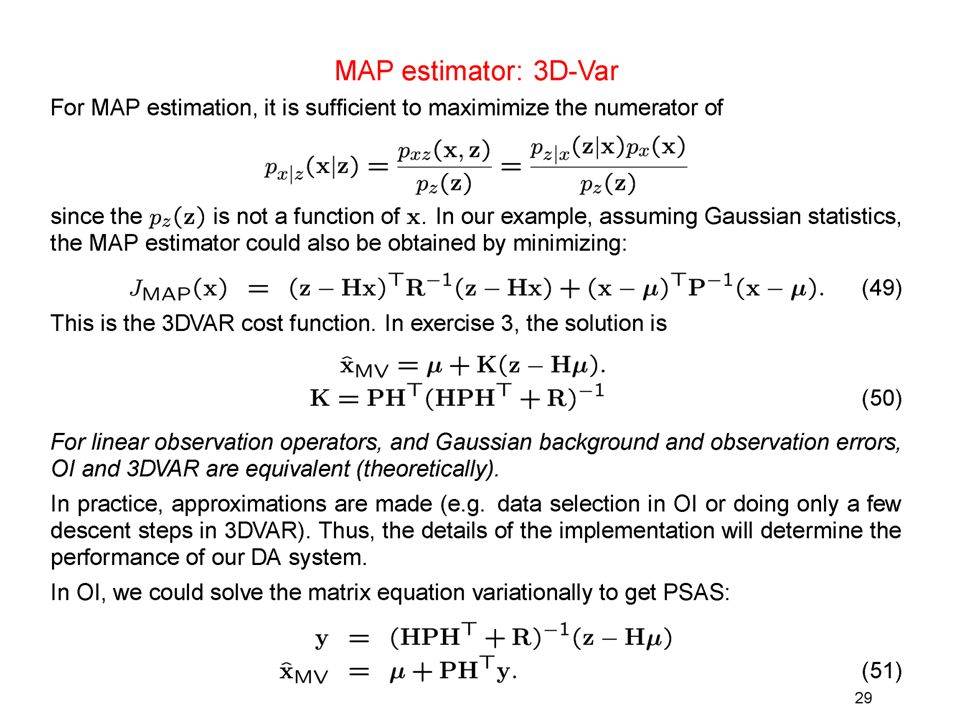
3. A bit of Estimation theory (will lead us to 3D-Var)
")
33
a posteriori p.d.f.

39
Data Selection From: ECMWF training course available at www.ecmwf.int
Bouttier and Courtier (2002)
")
40
The effect of data selection
PSAS OI Cohn et al. (1998)
")
41
The effect of data selection Cohn et al. (1998)
")
42
Advantages of 3D-var Obs and model variables can be nonlinearly related. H(X), H, HT need to be calculated for each obs type No separate inversion of data needed – can directly assimilate radiances Flexible choice of model variables, e.g. spectral coefficents No data selection is needed.

43
3D-Var Preconditioning
(1) Hessian of cost function is B-1 + HTR-1H To avoid computing B-1 in (1), change control variable to dx=Lc so first term in (1) becomes ½ ccT and we minimize w.r.t. c. Here dx=x-xb After change of variable, Hessian is I + term If no obs, preconditioner is great, but with more obs, or more accurate obs, it loses its advantage
 Hessian of cost function is B-1 + HTR-1H. To avoid computing B-1 in (1), change control variable to dx=Lc so first term in (1) becomes ½ ccT and we minimize w.r.t. c. Here dx=x-xb. After change of variable, Hessian is I + term. If no obs, preconditioner is great, but with more obs, or more accurate obs, it loses its advantage.")
44
With covariances in spectral space,
longer correlation lengths scales are permitted in the stratosphere With flexibility of choice of obs, can assimilate many new types of obs such as scatterometer Andersson et al. (1998) Andersson et al. (1998)
 Andersson et al. (1998)")
45
To assimilate radiances directly, H includes an instrument-specific radiative transfer model
14 13 12 11 10 9 8 7 6 5 Normalized AMSU weighting functions

46
Impact of Direct Assimilation of Radiances
Anomaly = difference between forecast and climatolgy Anomaly correlation = pattern correlation between forecast anomalies and verifying analyses 1974 – improved NESDIS VTPR Retrievals 1978 – TOVS retrievals Kalnay et al. (1998)
")
47
Operational weather centers used 3D-Var from1990’s Center Region
*Later replaced by 4D-Var Center Region Operational Ref. NCEP U.S.A. June 1991 Parrish& Derber (1991) ECMWF* Europe Jan. 1996 Courtier et al. (1997) CMC* Canada June 1997 Gauthier et al. (1998) Met Office* U.K. Mar. 1999 Lorenc et al. (2000) DAO NASA 1997 Cohn et al. (1997) NRL US Navy 2000? Daley& Barker (2001) JMA* Japan Sept. 2001 Takeuchi et al. (2004) SPIE proceedings,5234,
 ECMWF* Europe. Jan Courtier et al. (1997) CMC* Canada. June Gauthier et al. (1998) Met Office* U.K. Mar Lorenc et al. (2000) DAO. NASA Cohn et al. (1997) NRL. US Navy Daley& Barker (2001) JMA* Japan. Sept Takeuchi et al. (2004) SPIE proceedings,5234,")
48
Summary (Lecture 2) Estimation theory provides mathematical basis for DA. Optimality principles presume knowledge of error statistics. For Gaussian errors, 3D-var and OI are equivalent in theory, but different in practice 3D-var allows easy extension for nonlinearly related obs and model variables. Also allows more flexibility in choice of analysis variables. 3D-var does not require data selection so analyses are in better balance. Improvement of 3D-var over OI is not statistically significant for same obs. Systematic improvement of 3DVAR over OI in stratosphere and S. Hemisphere. Scores continue to improve as more obs types are added.

Similar presentations


 University.>")


 Ronald Errico Goddard Earth Sciences Technology and Research Center at Morgan.>")


 Shu-Chih Yang (with EK)>")

 using observations:>")


