Download presentation
Presentation is loading. Please wait.

1
Structural Transformation Ricardo Hausmann Kennedy School of Government and Center for International Development Harvard University

2
Development seems to be more than producing more of the same Increasing diversity Changing what you produce Self-discovery externalities Coordination failures Progress when progress is easy: quality improvements Growth collapses

3
Development entails diversification, not specialization Source: Imbs and Wacziarg (2003)
")
4
Rich countries produce rich-country goods…

5
Background: Hausmann, Hwang & Rodrik Measuring the revealed ‘sophistication’ of exports How sophisticated is a particular product? Using this measure, how sophisticated is a country’s export basket?

6
You become what you export: initial level of sophistication and subsequent growth

7
What you produce is determined by a lot more than “fundamentals” (I) Partial associations between EXPY and human capital (left panel) and institutional quality (right panel)
 Partial associations between EXPY and human capital (left panel) and institutional quality (right panel)")
8
Problems with structural transformation Information Externalities: Self-discovery spillovers Coordination Externalities Public inputs and training externalities

9
Coordination externalities and the evolution of comparative advantage

10
Hausmann and Klinger (2007) Every product requires a number of factors of production that are relatively specific E.g. producing asparagus requires a certain type of soil, mechanized farming equipment, agribusinesses firms that know the market, but also such “public goods” such as port infrastructure, road system, cold-storage facilities, phytosanitary regulations, market access agreements, etc.

11
Implication The distance from the products in which a country has accumulated its specific human capital to alternative products may affect the speed of its structural transformation But what do we mean by “distance” and how would we measure it empirically?

12
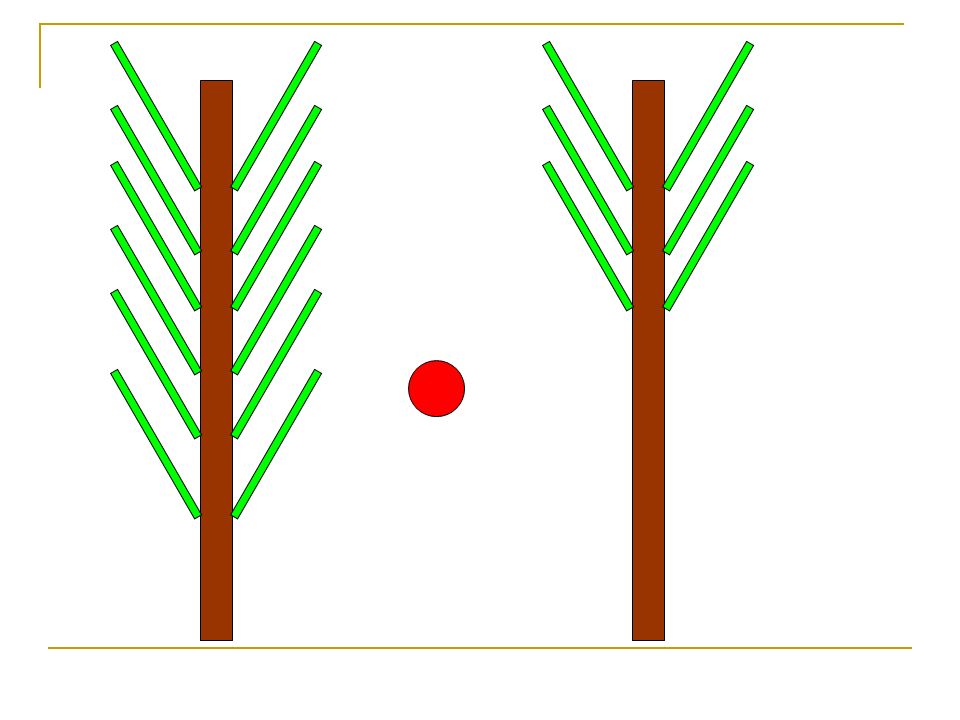
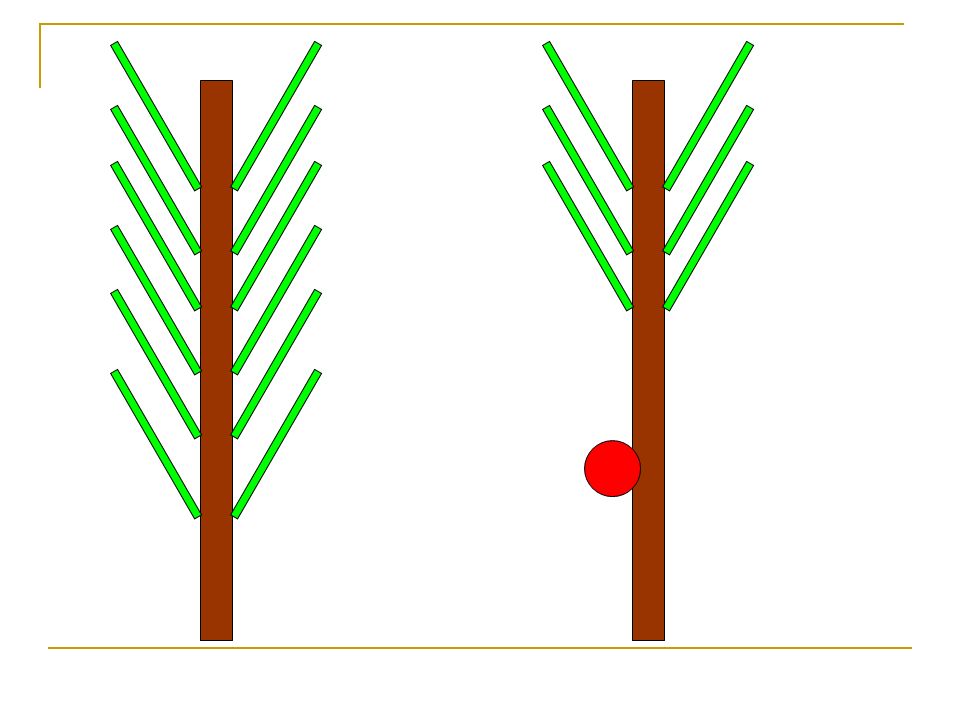
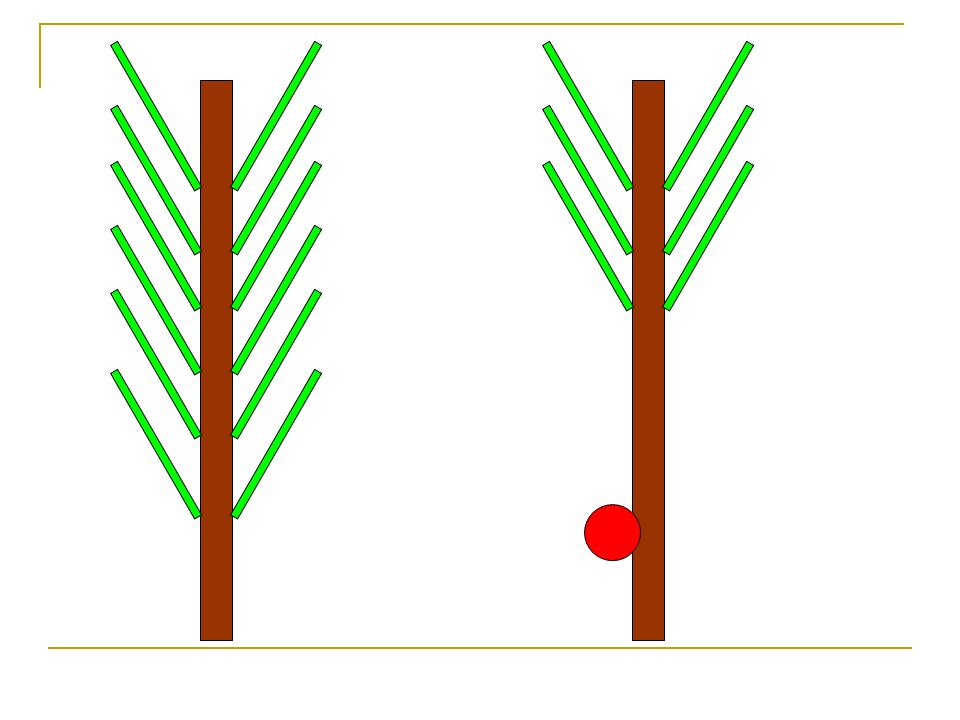
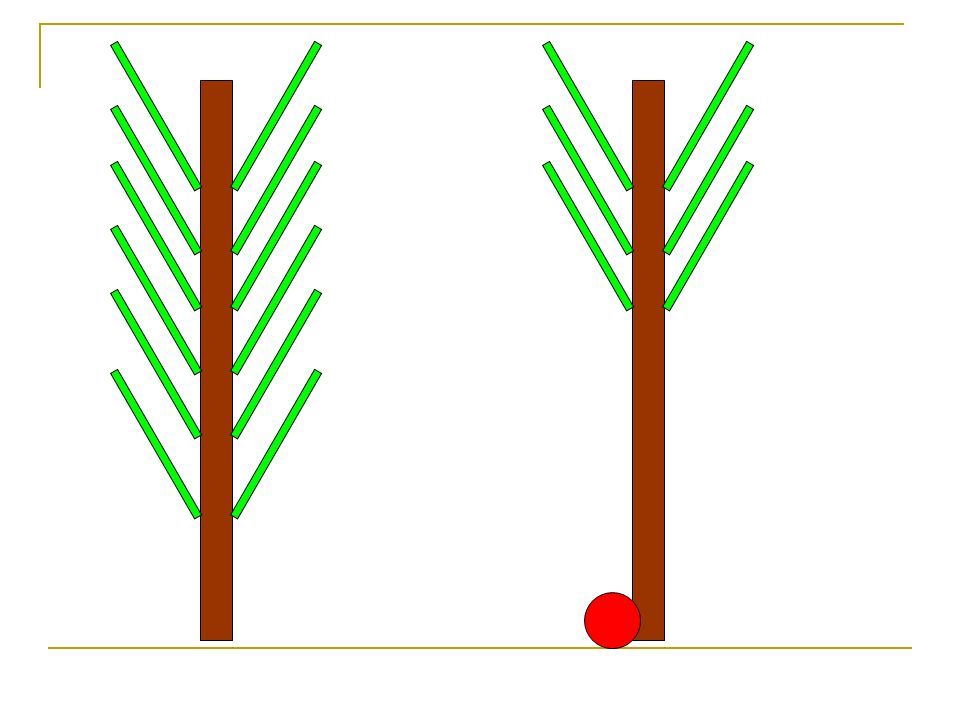
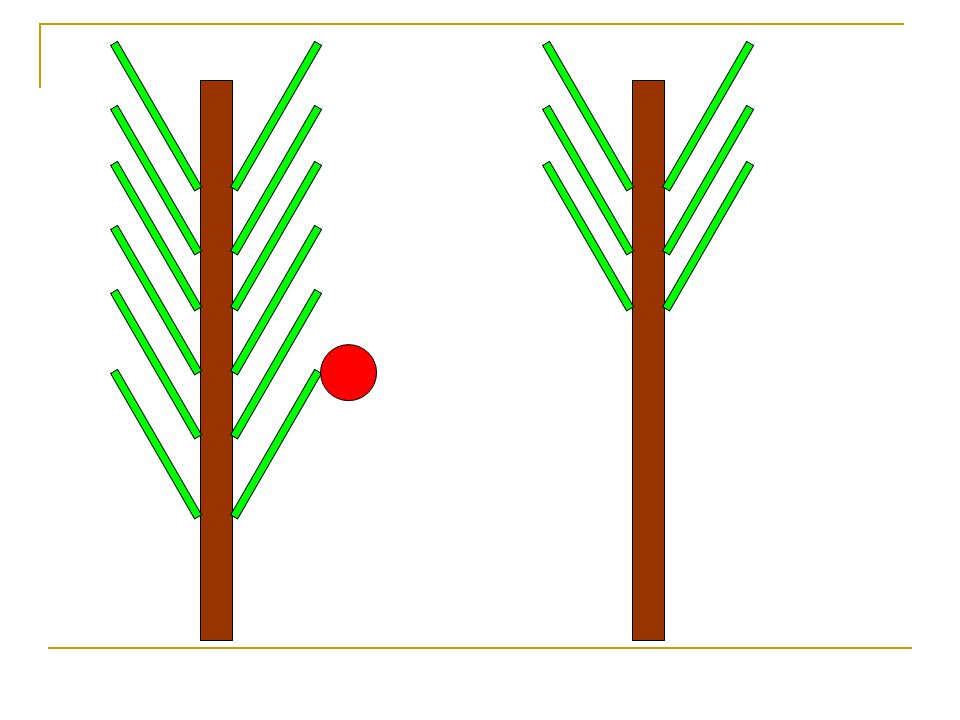
Monkeys & the Product Space Our metaphor: Products are like trees Firms are like monkeys Growth can happen by: Having more monkeys in the same trees: more of the same Improved quality in the same trees: move up the tree Hwang 2006 finds rapid and unconditional convergence within trees Or structural transformation: jumping to more valuable trees HHR (2006) show that this last step drives growth in a significant fashion
 show that this last step drives growth in a significant fashion")
13
Empirical implementation Monkeys tend to jump short distances Control for any time-varying national characteristic Human capital, rule of law, financial conditions Control for any time-varying product characteristic Price, PRODY

14
Implementing the model The ‘proximity’ (φ ) of two products captures how easily the capabilities to produce one can be used to produce the other: measure of the cost of jumping. φ AB = min {P(RCA A | RCA B),P(RCA B | RCA A)} Proximity of Cotton Undergarments to: Synthetic undergarments: 0.78 Overcoats: 0.51 Centrifuges 0.02 Proximity of CPUs to: Digital central storage units: 0.56 Epoxide resins: 0.50 Unmilled rye: 0
,P(RCA B | RCA A)} Proximity of Cotton Undergarments to: Synthetic undergarments: 0.78 Overcoats: 0.51 Centrifuges 0.02 Proximity of CPUs to: Digital central storage units: 0.56 Epoxide resins: 0.50 Unmilled rye: 0.")
15
Visual Representation of the Product Space

16
New Work “The Product Space and its Consequences for Economic Growth” with Hidalgo, Klinger & Lazlo- Barabasi How can we map this product space visually? Could the topography of the export space help explain bimodal income distribution and the lack of convergence?

17
Step 1: Maximum Spanning Tree

18
Step 2: Overlay Strong Links 0.4 > 0.4 – 0.55 0.55 – 0.65 0.65 <

19
Nodes sized according to World Exports, darker links are stronger (red is strongest) Step 3: Add Products
 Step 3: Add Products")
20
Nodes sized according to World Exports, darker links are stronger (red is strongest)
")
21
Step 3: Add Products

22
Regions Produce in Different Areas of the Space

23
Malaysia: 1975-2000

24
Malaysia 1975

25
Malaysia 1980

26
Malaysia 1985

27
Malaysia 1990

28
Malaysia 1995

29
Malaysia 2000

30
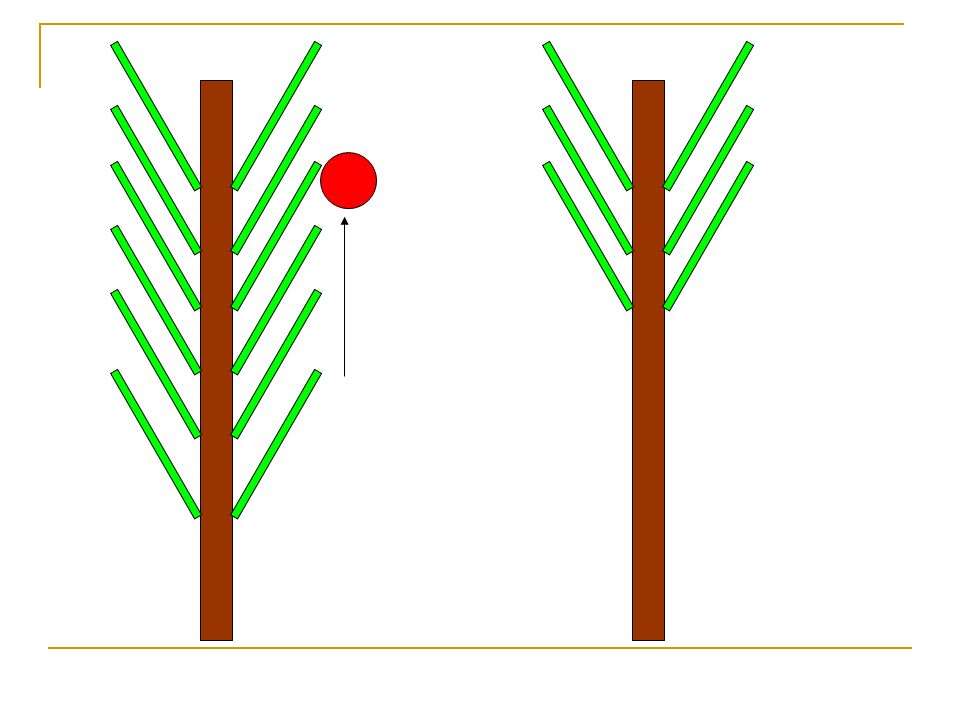
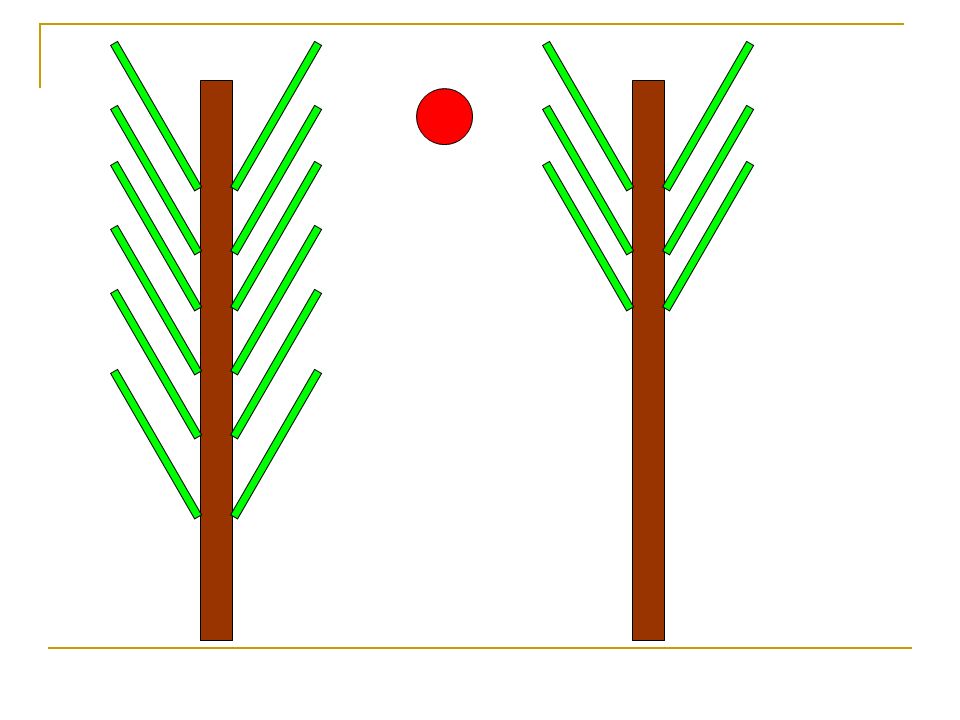
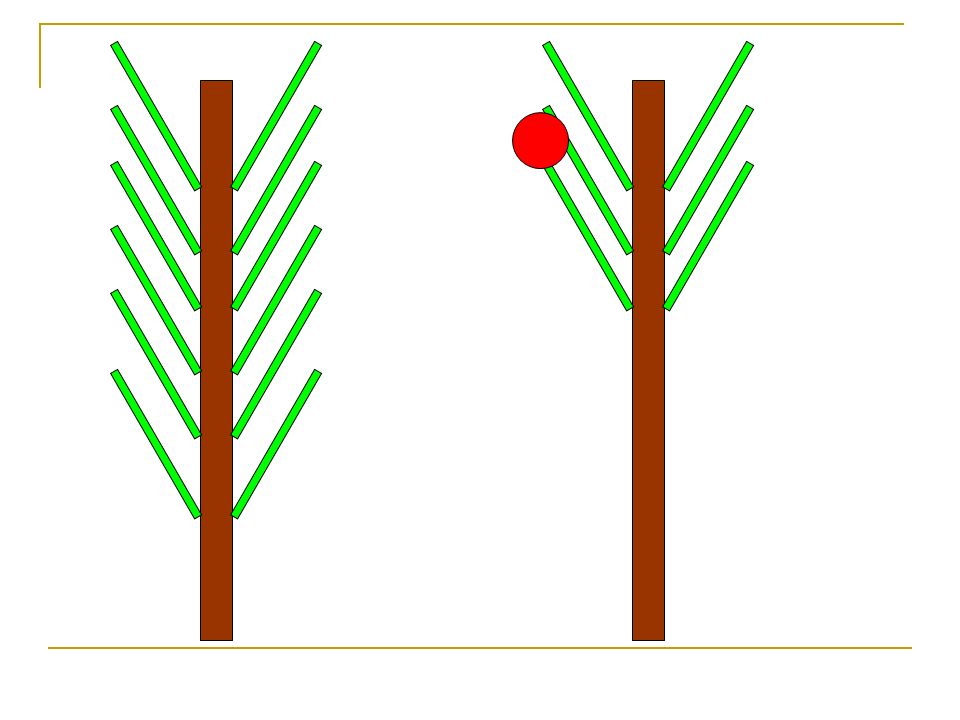
Monkeys jump to nearby trees

32
Measuring density around a tree 0.5.6.4 For all the surrounding trees you occupy, add their “proximity” (conditional probability) to the new tree, 0 This is a measure of the ‘density’ around a particular good ’.5.3.5 divided by the total number of ‘roads leading to Rome We use these pairwise distances to measure how close a country’s entire export basket is to an unoccupied tree: Density
 to the new tree, 0 This is a measure of the ‘density’ around a particular good ’ divided by the total number of ‘roads leading to Rome We use these pairwise distances to measure how close a country’s entire export basket is to an unoccupied tree: Density")
33
Density for jumps (green) versus non- jumps (brown)
 versus non- jumps (brown)")
34
Does the product space matter? More formally, we estimate: where X is a vector of country+year and product+year dummies, controlling for all time-varying country and product-level characteristics. Standard errors clustered at the country level, density normalized into units of standard deviation

35
1 standard deviation increase in density associated with 6.2 percentage point increase in the probability of having RCA in that good in the next period The unconditional probability is 1.27%: almost 5-fold increase This effect dominates the influence of having RCA in the Leamer or Lall category

36
The model at the country level How green is your valley?

37
Proposition It is easier for a country to move to a higher EXPY if the unoccupied trees are near and fruity We need an equivalent measure of “density” at the country level We call it “open forest”

38
Open_forest Open forest measures the value of the option to move to a higher EXPY It calculates the value of the unoccupied trees, by weighing their proximity and their PRODY Take the scaled distance from the tree you occupy to trees you don’t.6 0.3 Multiplied by the ‘fruitiness’ of the potential tree 1,000 x 2,000 x 1,600 x And add that together for the whole export basket

39
open_forest vs. GDP p.c. (logs), 2000
, 2000")
40
Open Forest & EXPY Growth 1-standard deviation in open forest is associated with higher EXPY growth of 1.6 percentage points per year.

41
Quality improvements and convergence What happens when countries can upgrade within the same products? Based on Hwang (2007)
.")
42
There is no unconditional convergence of GDP per capita

43
But there is unconditional convergence given the within-product quality distance to the frontier (Hwang 2006)
")
44
The evolution of within-product quality (Hwang 2006) Quality in any particular product converges to the frontier at a rate of 5-6% per year This happens unconditionally Countries that are further away from the quality frontier grow faster When a country develops a new product, it tends to enter at a lower quality Therefore, the development of new products creates more room for within-product quality upgrading, and subsequently faster growth
 Quality in any particular product converges to the frontier at a rate of 5-6% per year This happens unconditionally Countries that are further away from the quality frontier grow faster When a country develops a new product, it tends to enter at a lower quality Therefore, the development of new products creates more room for within-product quality upgrading, and subsequently faster growth")
45
Africa and LAC have the lowest gaps in the products they are in

46
Recent work by Kugler, Stein and Wagner Does quality matter for jumping to new trees?

53
R I P Not really a good project !

54
But height will help you !

59
Safe landing !

60
Growth collapses Based on Hausmann, Rodriguez and Wagner (2006)
")
61
Question: How many industrial countries had their highest GDP per capita before 2000

62
None

63
Out of 112 developing countries with data since 1980, how many had their maximum GDP per capita before 2000?

64
67 (58 percent) had their peak before 2000
 had their peak before 2000")
65
How deep have recessions been?

66
Developing countries: peak to trough fall in GDP per capita in long recessions 52 countries in excess of 20 percent 21 countries in excess of 40 percent

67
Implication Many countries have seen negative per capita growth for a very long time This has happened in spite of improvements in schooling attainment, life expectancy and global technological possibilities In fact, most developing countries have seen declines in GDP per capita lasting more than 10 years

68
Question #1: Why do countries fall into crises? Probit analysis: We study the determinants of the probability of countries falling into crises. Usual suspects: Wars Natural disasters Export collapses Sudden Stops Unusual suspect: Open Forests

69
Most growth collapses coincide with export collapses Date of export collapse Date of growth collapse

70
Collapses in exports were typically larger than those in output Fall of exports Fall of output

71
The growth collapse in Zambia Log of real exports per capita Log of real GDP per capita

72
Growth collapse in Bolivia

73
Baseline results: Random Effects Probit

74
Question 2: What determines how long a country stays in a crisis? None of the usual suspects Wars Natural disasters Export collapses Sudden Stops …but the impact of open forest is very robust

75
Duration analysis Two types of specifications. Parametric with frailty (Weibull + others). Cox with corrected variance (models for multiple spells). Parametric may be more adequate to precisely estimate the hazard function.
. Parametric may be more adequate to precisely estimate the hazard function..")
77
Conclusion: a common cause of protracted growth collapses Adverse shock to the earning capacity of exports …in a country with low open forest (connectedness)
")
Similar presentations


>")


 should be more prevalent in poorer countries, with less developed financial markets, with less well->")
; Kaminsky,>")


? How is GDP calculated? What is the difference between nominal and.>")


