Download presentation
Presentation is loading. Please wait.

1
Waveburst DSO: current state, testing on S2 hardware burst injections Sergei Klimenko Igor Yakushin LSC meeting, March 2003 LIGO-G030101-00-Z

2
Data flow

3
Data flow: event types In a single run waveburst DSO is producing 3 kind of events: gw candidate events, offtime events (pixel swapping), random events (pixel mixing).
, random events (pixel mixing).")
4
Data flow: pixel swapping

5
Data flow: pixel mixing

6
Data flow ● Percentile transform: Select N% pixels with the biggest wavelet amplitude, zero out the rest and replace the original amplitude of the remaining pixels with a percentile amplitude. ● Coincidence: Select only pixels present in both channels within some time-frequency window, currently we use 0 time window (our time resolution is comparable to 10ms) and 0 frequency window. We are going to change that. ● Clustering: joining together pixels close in time and frequency and consider them to be a single event. ● Pixel swap: Estimating background event rate by exchanging in time two halves of data in each frequency layer. ● Pixel mixing: Estimating false alarm rate. Randomly change pixel positions in each channel for each frequency layer ● Waveburst can also work in a single IFO mode as all the other burst DSOs.
 and 0 frequency window. We are going to change that. ● Clustering: joining together pixels close in time and frequency and consider them to be a single event. ● Pixel swap: Estimating background event rate by exchanging in time two halves of data in each frequency layer. ● Pixel mixing: Estimating false alarm rate. Randomly change pixel positions in each channel for each frequency layer ● Waveburst can also work in a single IFO mode as all the other burst DSOs..")
7
Input, performance ● LSC-AS_Q channel from a pair of interferometers. ● Currently use 120 seconds ● We used the same dewhitening filters for S1 as slope and tfclusters. No dewhitening filters are used for S2 so far. ● With the typical set of parameters waveburst runs about twice the real time for a pair of ifos on the existing hardware on one node. ● Typical total number of events found in 120 second interval is around 40.

8
Filter parameters: main

9
Filter parameters: wavelet

10
Filter parameters: event selection These parameters are used to reduce the output from DSO to the database. The most useful ones are minClusterSize and minLikelihood. They are chosen in advance independent of data depending on what kind of events we are looking for and what false alarm rate we can tolerate.

11
Filter parameters: blob output These parameters control the output of BLOBs to the database: for each event found we can record in the database the amplitudes (percentile or original) of the pixels in the smallest rectangle containing the cluster. This can be used, for example, to reconstruct the waveform of the signal later.

12
Filter parameters: debugging info

13
Filter parameters: simulation The idea is to enumerate various simulation types and record their parameters to the database to be able to crossreference simulation type and parameters in waveburst (or any other DSO) tables.
 tables.")
14
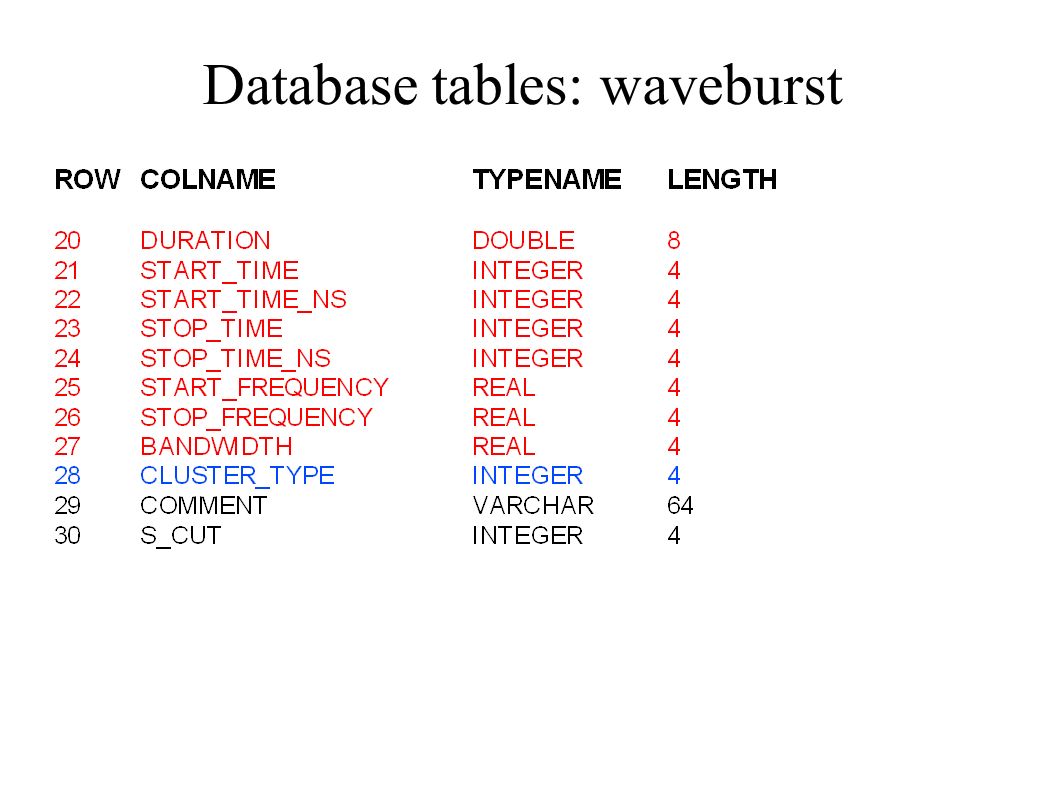
Database tables: waveburst

16
Database tables ● waveburst_mime is used to record BLOBs of clusters amplitudes. ● sim_type, sim_type_params, sim_inst, sim_inst_params are intended to be used to enumerate the simulations so that it can be crossreferenced in the waveburst table. We are not doing it yet. For now simulations are done the same way as for slope and tfclusters. These tables are quite general purpose and can be used by any other DSO.

17
Detecting hardware injections. H1-H2 02/13/03 ● Signal was injected to ETMX and ETMY simultaneously into H1 and H2. ● 8 frequencies: 100, 153, 235, 361, 554, 850, 1304, 2000 Hz. ● 24 strains for each frequency. ● Waveburst found on the time interval 729231185- 729236099 334 events in each ifo. After the power cut (ln(power)>=2.5), 98 events survived in H1 and 95 events survived in H2.
>=2.5), 98 events survived in H1 and 95 events survived in H2..")
18
Detecting hardware injections. H1-H2 02/13/03 ● No whitening filter was used. Whitening filter used by slope and tfcluster in S2 produced worse results. Might have something to do with different delays introduced by filters in different channels. To test, we need less strict coincidence. ● Approximately half of injections for each frequency was detected both in H1 and H2.

19
Detecting hardware injections: power in H1

20
Detecting hardware injections: power in H2

21
Detecting hardware injections: central frequency for all clusters

22
Detecting hardware injections: central frequency for loudest clusters

23
Detecting hardware injections: central time of loudest clusters

24
Future plans ● Loose coincidence using time and frequency windows. ● Process more than 2 ifos in a single job. ● Actually use the simulation tables in the database. Currently simulations are done the same way as is done for slope or tfclusters. ● After gw candidate events are found with the above procedure, apply correlation to further select only those events that have correlated counterparts in the other ifos. ● Analyze S2.

25
Future plans: correlation

Similar presentations
 for the Virgo Collaboration.>")

, A. Weinstein (CIT) for the Burst group Hannover LSC meeting,>")
 Data conditioning and veto for TAMA burst analysis Masaki Ando and Koji Ishidoshiro.>")


 -Velocity (m/s) -Chirp Duration (s) -Sampling Info (Sampling Frequency, Window Size) -Original Signal.>")


, L. Corpuz (ERAU), and the cWB Team LSC Burst Face to Face – Krakow, Poland 2010.>")


