Download presentation
Presentation is loading. Please wait.

1
Price Volatility: Protecting Farmers and Consumers Antony Chapoto, Steven Haggblade and Thomas Jayne Michigan State University COMESA AAMP Journalists Training Workshop Dar es Salaam June 30, 2010

2
Maize price volatility

3
Outline 1.Impact on consumers and farmers 2. Causes of price volatility 3. Policy options 4. Conclusions

4
1. Impact on farmers Do farmers benefit from high maize prices?

5
Smallholder Households’ Position in the Maize Market percent

6
Smallholder Households’ Position in the Maize Market percent

7
Characteristics of smallholder farmers, Zambia 2003/04 4159702310.9907,255 (72%) Households not selling maize 634193883161.6328,561 (26%) Rest of maize sellers 2,93211637201,1324.331,328 (2%) Top 50% of maize sales Total hh income (US$) Gr. Rev., crop sales (US$) Gr. Rev., maize sales (US$) Asset values (US$) Farm size (ha) N=
 Gr. Rev., maize sales (US$) Asset values (US$) Farm size (ha) N=.")
8
Characteristics of smallholder farmers, Zambia 2003/04 4159702310.9907,255 (72%) Households not selling maize 634193883161.6328,561 (26%) Rest of maize sellers 2,93211637201,1324.331,328 (2%) Top 50% of maize sales Total hh income (US$) Gr. Rev., crop sales (US$) Gr. Rev., maize sales (US$) Asset values (US$) Farm size (ha) N=
 Gr. Rev., maize sales (US$) Asset values (US$) Farm size (ha) N=.")
9
Characteristics of smallholder farmers, Zambia 2003/04 4159702310.9907,255 (72%) Households not selling maize 634193883161.6328,561 (26%) Rest of maize sellers 2,93211637201,1324.331,328 (2%) Top 50% of maize sales Total hh income (US$) Gr. Rev., crop sales (US$) Gr. Rev., maize sales (US$) Asset values (US$) Farm size (ha) N=
 Gr. Rev., maize sales (US$) Asset values (US$) Farm size (ha) N=.")
10
1. Impact on farmers Do farmers benefit from high maize prices?

11
1. Impact on farmers Do farmers benefit from high maize prices? A small minority do. The majority, who are net buyers, don’t!

12
1. Impact on consumers Do consumers suffer from high maize prizes?

13
Food staple consumption, Malawi

14
Food staple consumption, Uganda Commodity Quantity consumed Daily caloric intake Calorie share (kg/capita) (kcal/day)(percent) Plantains 172 41918% Cassava 101 30013% Maize 31 26611% Sweet potatoes 82 2159% Beans 16 1486% Wheat 7 422% Rice 4 532% Other113348% Total2360100%
 (kcal/day)(percent) Plantains % Cassava % Maize % Sweet potatoes % Beans % Wheat 7 422% Rice 4 532% Other113348% Total %")
15
1. Extreme price volatility hurts poor urban households (net buyers) deficit farm households (the majority) Maize consumers planning for all farmers
 deficit farm households (the majority) Maize consumers planning for all farmers.")
16
Outline 1.Impact on consumers and farmers 2. Causes of price volatility 3. Policy options 4. Conclusions

17
2. Causes of food price variation Weather production volatility World price transmission Private trader hoarding & collusion

18
2. Causes of food price variation Weather production volatility World price transmission Private trader hoarding High transport and marketing costs Trade barriers Demand substitutes Unpredictable government policies (trade bans, pricing, public imports, tariffs)
.")
19
Weather production volatility maize cassava Zambia: staple food production

20
World price transmission?

21
2. Causes of food price variation Weather production volatility World price transmission Private trader hoarding High transport and marketing costs Trade barriers Demand substitutes Unpredictable government policies (trade bans, pricing, public imports, tariffs)
.")
22
2. Causes of food price variation CauseImportance Weather*** ? ? ? ? ? World prices*

23
Outline 1.Impact on consumers and farmers 2. Causes of price volatility 3. Policy options 4. Conclusions

24
3. Policy Options Policy RegimesInstrumentsCountries A. Free market open borders, public goods Mozambique, Uganda, South Africa B. State dominated buffer stocks, trade controls Malawi, Zambia, Tanzania

25
A. Free trade regime: South Africa, domestic and border prices for white maize, 1992-2006

26
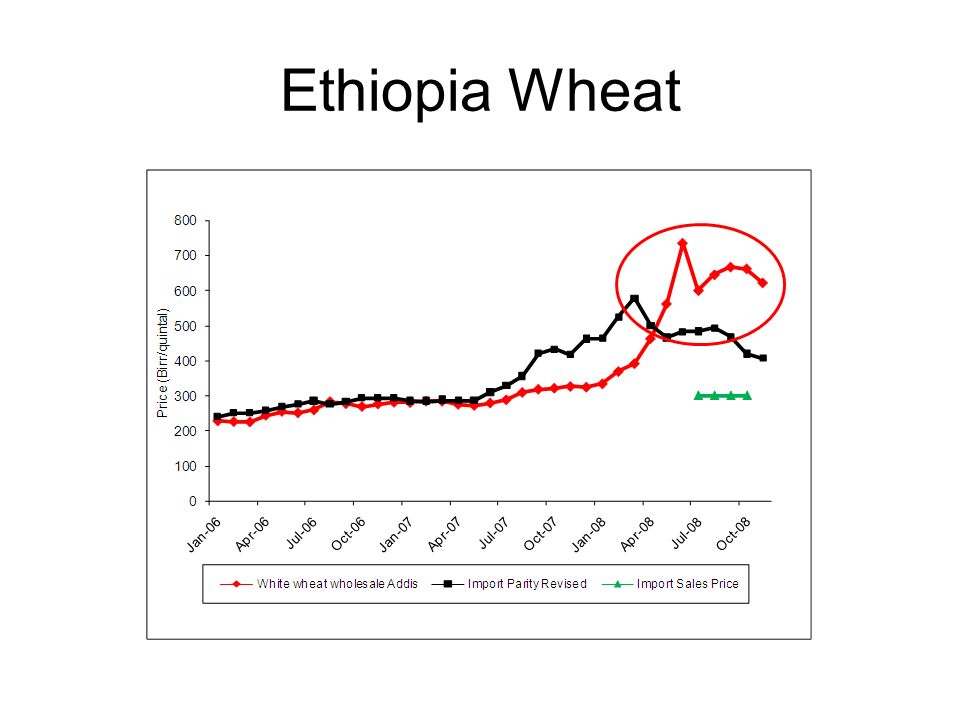
Ethiopia Wheat

28
Foreign exchange constraints Import is highly profitable Traders refuse to import because they cannot convert burr into dollars

29
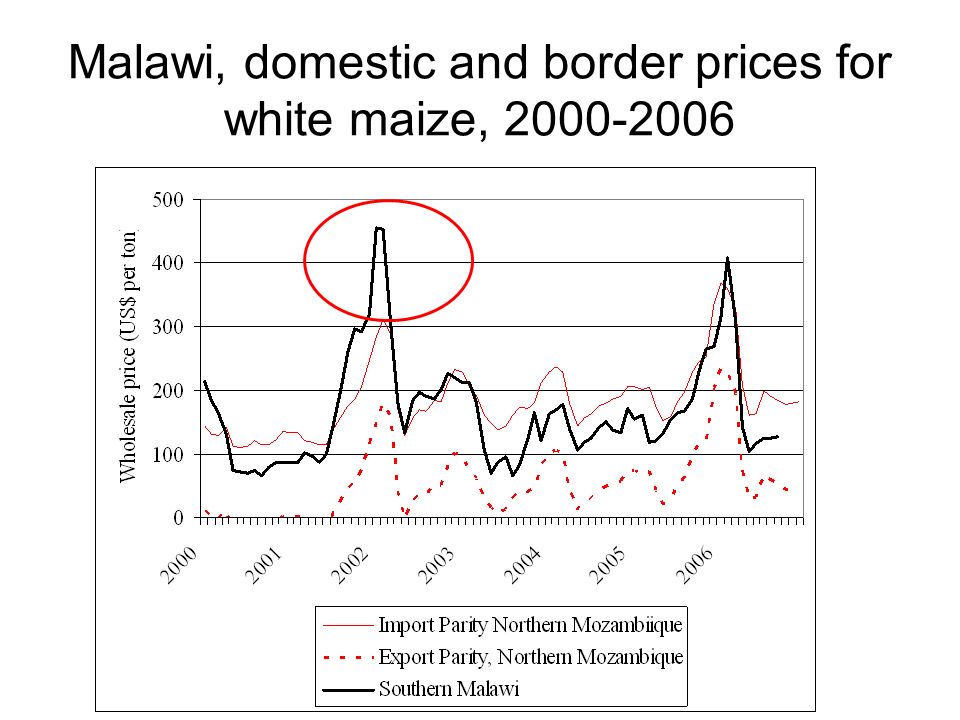
Malawi, domestic and border prices for white maize, 2000-2006

31
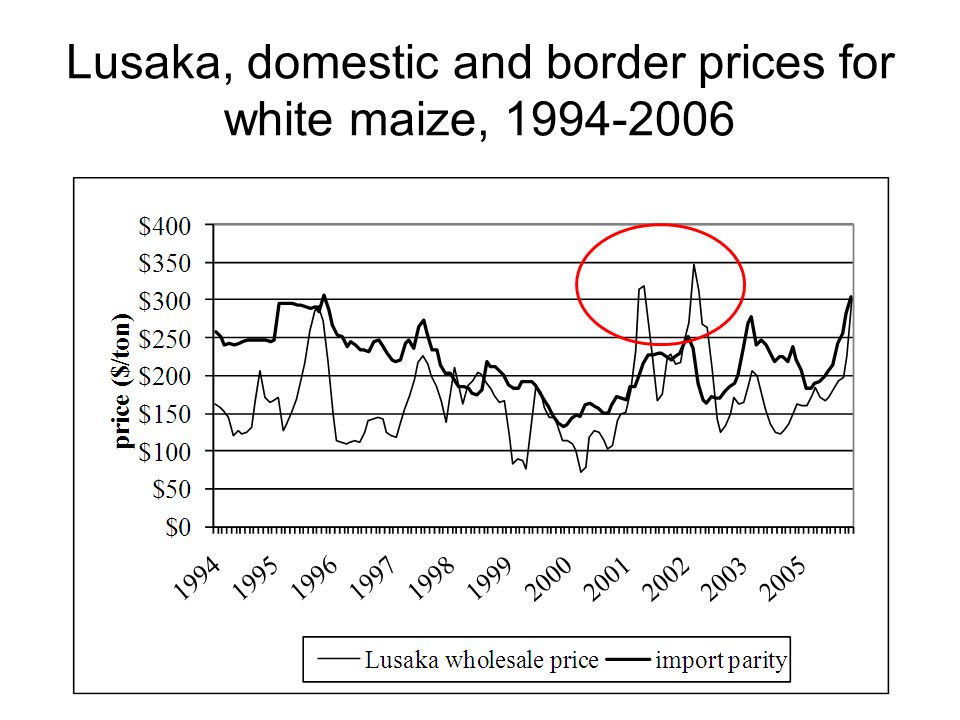
Lusaka, domestic and border prices for white maize, 1994-2006

33
National food production shortfall anticipated Who’s going to import? And how much? State announces plan to import X tons Private traders sit on sidelines State incurs delays in contracting for imports Supplies dwindle; prices skyrocket “EVIDENCE THAT MARKETS FAIL!” Policy uncertainty price spikes Examples: a) Zambia- 2001/02, 2002/03, b) Malawi: 2001/02, 2005/06
 Zambia- 2001/02, 2002/03, b) Malawi: 2001/02, 2005/06.")
34
When does import parity fail to cap price rises? When import and export bans prevent trade Foreign exchange unavailable Late decision making and import authorization Uncertainty over government action When traders fear subsidized government sales and so fail to import

35
Import parity caps price rises When borders remain open Foreign exchange is available Under stable, predictable government policies

36
Trade bans Drive trade into informal channels Raise transaction costs Increase bands between import and export parity Discourage investment in staple food production and trade

37
Trade bans high-cost, informal trade

38
3. Comparing Policy Regimes Policy RegimesInstrumentsCountries A. Free market open borders, public goods Mozambique, Uganda, South Africa B. State dominated buffer stocks, trade controls Malawi, Zambia, Tanzania

39
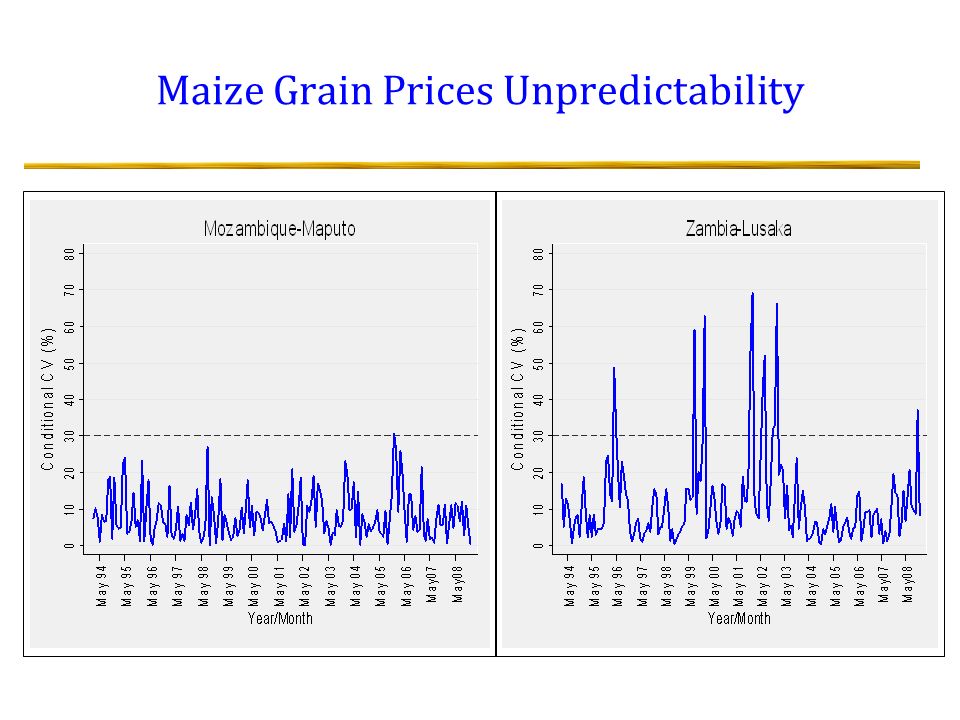
Finding 1 Maize grain prices are generally more volatile and less predictable in Group B, the state dominated market systems Malawi and Zambia have the highest degree of price volatility and uncertainty

40
Maize Grain Prices Unpredictability

42
Comparison of Unconditional Coefficient of Variation for Capital City Markets/major Consumption Centers

43
Finding 2 With the exception of Malawi, Group B, state- dominated marketing systems have failed to match maize production growth for SSA By contrast, Mozambique and Uganda, countries with relatively open marketing and trade policies have experienced more than a 100% increase in maize production over the past two decades.

44
Figure 5. Maize Production Index for Sub-Saharan Africa, Zambia, Malawi, Tanzania, Kenya, Mozambique, and Uganda, 1985 to 2008 Source: Data from FAOStat

45
Maize Production Growth, 1985 -2008 Source: Data from FAOStat

46
Outline 1.Impact on consumers and farmers 2. Causes of price volatility 3. Policy options 4. Conclusions

47
Food price variation: causes and cures CauseImportanceCure Weather*** diversification, irrigation, forecasting Unpredictable policies***transparency Transport costs**infrastructure Trade barriers**open borders Demand substitution**diversification World prices*options contracts Hoarding*competition

48
Conclusions on Price Volatility Problem for maize, (wheat, rice) Problem for poor consumers (including deficit farm households) and for surplus farmer incentives Cure problem at source (diversification, irrigation, forecasting, infrastructure, policy risk) Open borders limit price volatility Private sector requires predictability Government price interventions (buffer stocks, trade bans) costly, ineffective, often unpredictable & counterproductive
 Problem for poor consumers (including deficit farm households) and for surplus farmer incentives Cure problem at source (diversification, irrigation, forecasting, infrastructure, policy risk) Open borders limit price volatility Private sector requires predictability Government price interventions (buffer stocks, trade bans) costly, ineffective, often unpredictable & counterproductive")
Similar presentations


 Food and Agriculture Organization of the United Nations National rice policies in Asia David Dawe Agricultural.>")


 Spatial and Local Development Team World Bank February 2008.>")


