Download presentation
Presentation is loading. Please wait.

2
Alexandria University Faculty Of Science Practical Training Course In Applications Of Plant Physiology Prepared By Dr. Mohamed Mohamed Ibrahim Lecturer Of Plant Physiology Faculty Of Science, Botany Dept. Alexandria University E.Mail: m_ibramim 2004@yahoo.com2004@yahoo.com

3
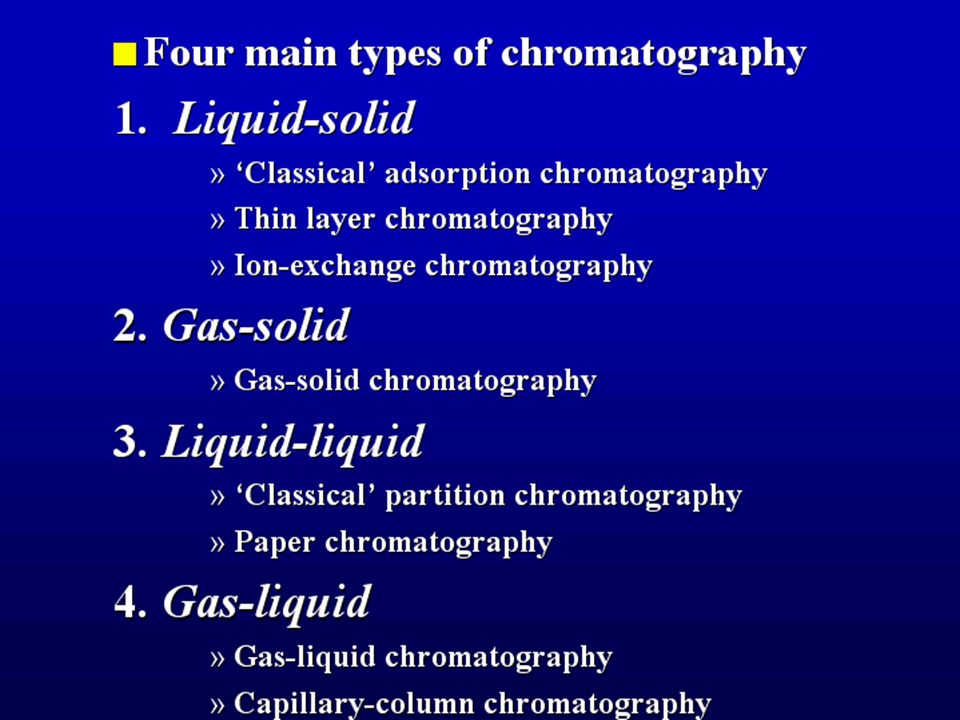
separation & identification of multiple components in a complex mixture. chromatographic methods for the

13
Thin-Layer Chromatography (TLC) Separation of Food Dyes by Thin Layer Chromatography (TLC )
 Separation of Food Dyes by Thin Layer Chromatography (TLC )")
14
Thin-Layer Chromatography

15
Chromatography Stationary Phase Mobile Phase What does it do? stays put! flows around SP What is it? fine solid with fluid (liquid or gas) (physical form) lots of surface How does it effect retains sample by moves sample along sample movement? surface interaction Analogous to… an obstacle course “motivating force” Specifically for thin layer (250 m) 98% ethyl acetate TLC Lab #5 of silica gel (SiO 2 ) x + 2% acetic acid
 (physical form) lots of surface How does it effect retains sample by moves sample along sample movement. surface interaction Analogous to… an obstacle course motivating force Specifically for thin layer (250 m) 98% ethyl acetate TLC Lab #5 of silica gel (SiO 2 ) x + 2% acetic acid.")
16
Thin Layer Chromatography TLC plate silica gel - silicon dioxide (SiO 2 ) x (a common, inexpensive stationary phase) bulk (SiO 2 ) x These exposed OH units give silica gel a relatively polar surface. surface 5 x 10 cm. TLC slide 250 m silica gel layer impregnated with a fluorescent indicator, on a plastic backing

17
Thin Layer Chromatography Four Stages in TLC 1. Sample Application Capillary used to spot solution of each sample. 2. Development This is when the separation actually occurs. 3. Visualization Our results will be viewed under UV light. 4. Interpretation of Results Comparison of retention factors.

18
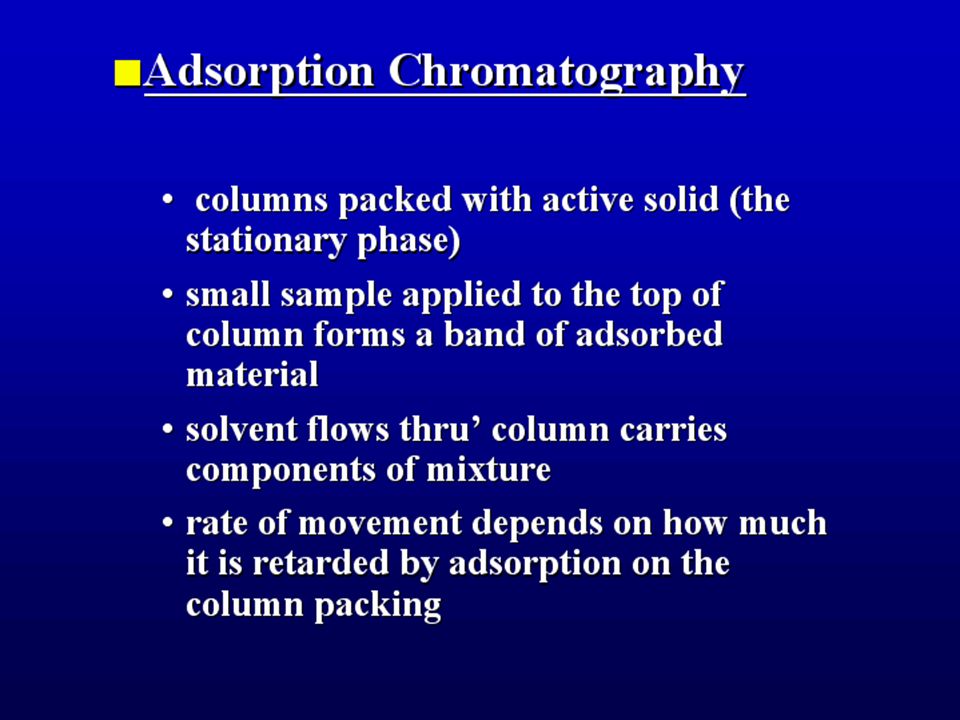
TLC involves spotting a dilute solution (1%) of sample on one end of a small sheet that has been coated with silica gel (SiO 2 ) or alumina (Al 2 O 3 ), known as the stationary adsorbent phase. TLC involves spotting a dilute solution (1%) of sample on one end of a small sheet that has been coated with silica gel (SiO 2 ) or alumina (Al 2 O 3 ), known as the stationary adsorbent phase. The sheet is placed upright inside a jar in a small pool of solvent. As the solvent rises up the sheet by capillary action, the components travel at different rates based on competing interactions with the mobile (solvent) and adsorbent phases. The sheet is placed upright inside a jar in a small pool of solvent. As the solvent rises up the sheet by capillary action, the components travel at different rates based on competing interactions with the mobile (solvent) and adsorbent phases. SiO 2 is used for separation of more polar compounds while Al 2 O 3 is used in the separation of non-polar compounds. SiO 2 is used for separation of more polar compounds while Al 2 O 3 is used in the separation of non-polar compounds.
 of sample on one end of a small sheet that has been coated with silica gel (SiO 2 ) or alumina (Al 2 O 3 ), known as the stationary adsorbent phase. The sheet is placed upright inside a jar in a small pool of solvent. As the solvent rises up the sheet by capillary action, the components travel at different rates based on competing interactions with the mobile (solvent) and adsorbent phases. The sheet is placed upright inside a jar in a small pool of solvent. As the solvent rises up the sheet by capillary action, the components travel at different rates based on competing interactions with the mobile (solvent) and adsorbent phases. SiO 2 is used for separation of more polar compounds while Al 2 O 3 is used in the separation of non-polar compounds. SiO 2 is used for separation of more polar compounds while Al 2 O 3 is used in the separation of non-polar compounds..")
19
TLC plate “finishing line” 1 cm. A. Draw “guide lines” lightly with pencil “starting line” 1 cm. B. Dissolve solid sample in MeOH C. Use TLC capillary to transfer and spot dissolved sample ACE ASP CAF #5 #5 #5 Ref. Ref. Ref. 1. Sample Application (spotting)
.")
20
2. Development of TLC Plate TLC plate TLC Developing Chamber (just a glass jar with solvent in it!) A. Place spotted TLC plate in developing chamber B. Developing solution is drawn up the plate by capillary action C. Remove TLC plate when solvent reaches top line Developing solution (mobile phase) } {keep capped} NOTE: During this ~20 min. developing stage, compounds in the original spots are being pulled through the silica gel.
 A. Place spotted TLC plate in developing chamber B. Developing solution is drawn up the plate by capillary action C. Remove TLC plate when solvent reaches top line Developing solution (mobile phase) } {keep capped} NOTE: During this ~20 min. developing stage, compounds in the original spots are being pulled through the silica gel..")
21
3. Visualization of TLC Results A. Allow solvent to evaporate from surface of TLC plate. C. Mark spots with a pencil while viewing under UV. UV B. View results under UV light. look for grayish spots on the fluorescent green background

22
4. Interpretation of TLC Results A. Determine retention factors (R f ) for each spot detected. B. Use R f ’s of reference spots to identify the other components. ACE ASP CAF #5 #5 #5 Ref. Ref. Ref. distance spot has moved distance solvent has moved _______________________ R f = = XYXY Y - - - - - - - - - - - - - - - - - - - - - - - X3X3 - - - - - - - - - - - - - - - - - - - - - - - - - - - - - - - - - - - - - - - - - - - - - - - - - - - - - - - - - - X1X1 X2X2 How do you interpret any other spots? 4 1 3 2 ? ? How do you identify the unknown tablets? Finally:

23
Comments Do not let the plate sit in the solvent chamber after the solvent front reaches the top of the plate. Why? Do not let the plate sit in the solvent chamber after the solvent front reaches the top of the plate. Why? When spotting, the solution typically adsorbs very quickly and the spot can easily get larger than desired (1 mm diameter). When spotting, the solution typically adsorbs very quickly and the spot can easily get larger than desired (1 mm diameter). Make 3-4 lanes on each plate, marked with pencil and ruler and experiment with large and small spots to find which works best. Make 3-4 lanes on each plate, marked with pencil and ruler and experiment with large and small spots to find which works best. Record the Rf values for each substance. Record the Rf values for each substance.
. When spotting, the solution typically adsorbs very quickly and the spot can easily get larger than desired (1 mm diameter). Make 3-4 lanes on each plate, marked with pencil and ruler and experiment with large and small spots to find which works best. Make 3-4 lanes on each plate, marked with pencil and ruler and experiment with large and small spots to find which works best. Record the Rf values for each substance. Record the Rf values for each substance..")
24
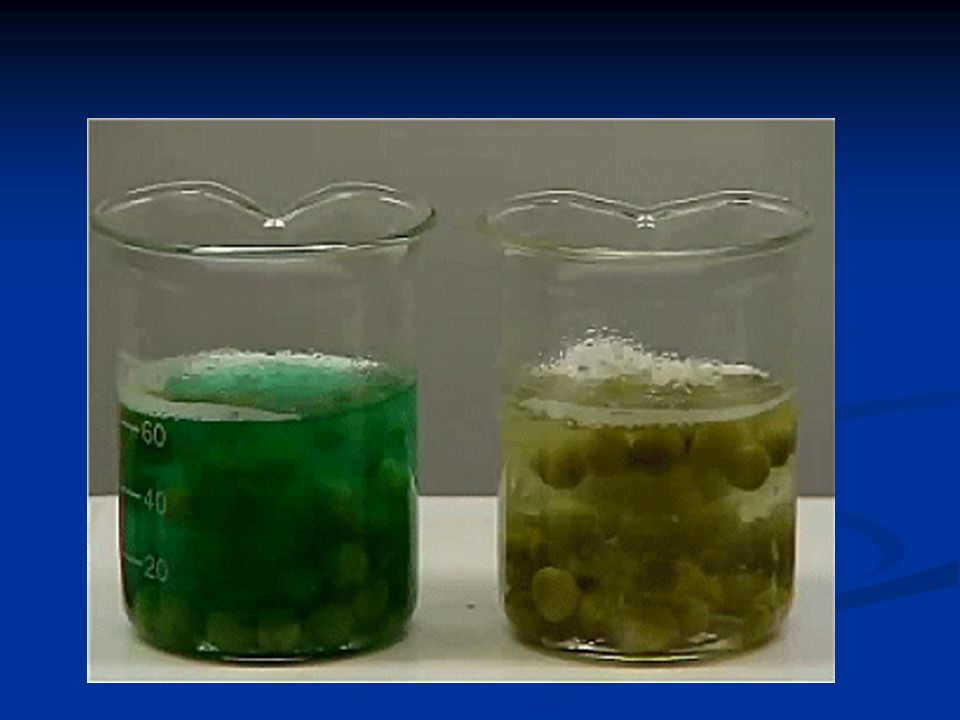
Follow lab handout for all experimental procedures. Follow lab handout for all experimental procedures. Keep the layer of liquid with the most color. Keep the layer of liquid with the most color. Do not evaporate the dichloromethane solution Do not evaporate the dichloromethane solution Solvents used are flammable, use caution Solvents used are flammable, use caution Separation of components should be easy to distinguish. Separation of components should be easy to distinguish.

27
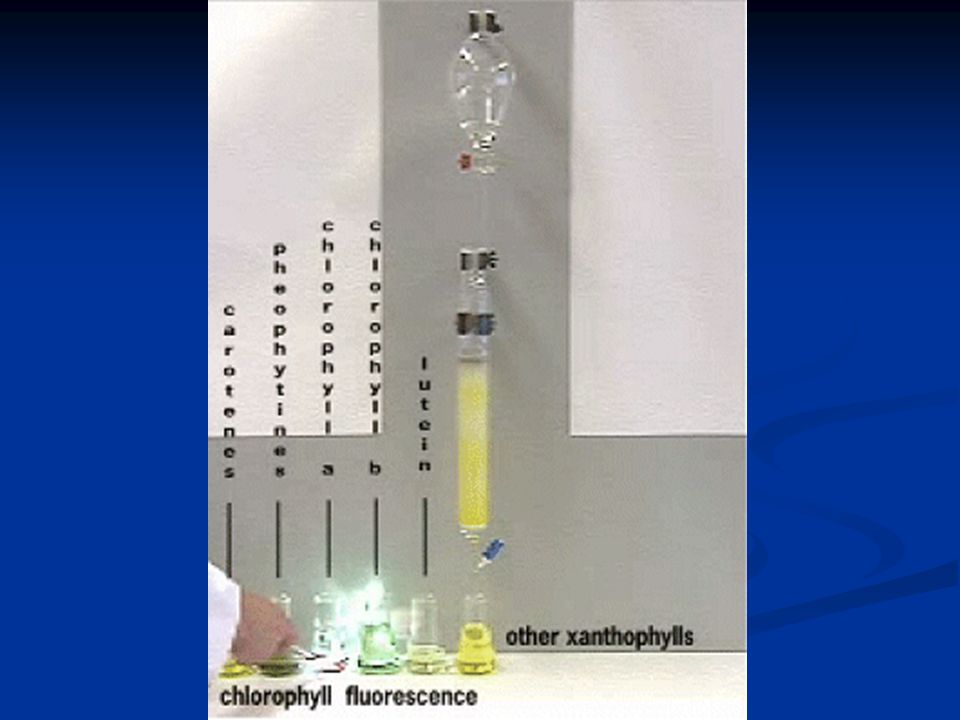
leaf pigments color carotenesgolden pheophytin olive green chlorophyll a blue green chlorophyll b yellow green luteinyellow violaxanthinyellow neoxanthinyellow

28
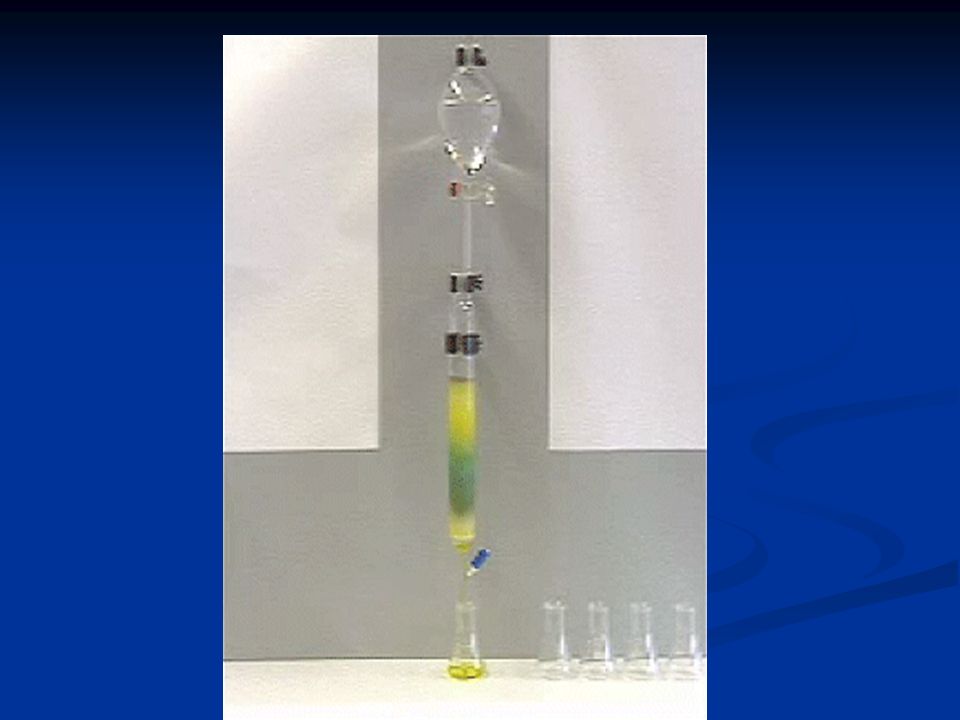
Separation of Plant Pigments by Column Chromatography (CC)
")
Similar presentations


 Organic Chemistry Lab I Fall 2008 Dr. Milkevitch Oct 12 & 14, 2009.>")


>")


