Download presentation
Presentation is loading. Please wait.

1
1.PATIENTS’ CHARACTERISTICS Table 1.1: Age distributions

2
Figure 1.1: Age Distributions % Age group, years 0 10 20 30 40 percent <1 1-14 15-24 25-34 35-44 45-54 55-64 65-74 75-84 >=85

3
Table 1.2: Gender distributions

4
Table 1.3: Number (%) of surgery done by month
 of surgery done by month")
5
Figure 1.3: Number (%) of surgery No. of surgeries Month 0 500 1000 1500 number January February March April May June July August September October November December

6
Table 1.4: Number of surgery done by centre

7
Figure 1.4: Number of surgery done by centre No. of surgeries Centre 0 500 1000 1500 number A B C D E F G H I J K L M N O P Q R S T U V W X Y

8
Table 1.5: Distribution of care setting by centre

9
Figure 1.5: Distribution of day care and in patient by centre Average day care (all patients)=38% % Centre 0 38 50 100 Day care In-patient C Y M A Q U I D T V P N K 0 X B S L F R J G H E W
=38% % Centre Day care In-patient C Y M A Q U I D T V P N K 0 X B S L F R J G H E W")
10
Table 1.6: Number of patients with first eye and second eye surgery

11
Table 1.7: Number of patients with ocular co-morbidity

12
Table 1.8: Number of patients with systemic co-morbidity

13
Table 1.9: Pre-operative visual acuity measurement

14
Figure 1.9: Pre-operative visual acuity measurement % Visual acuity 0 10 20 30 Unaided Refracted 6/5 6/6 6/9 6/12 6/18 6/24 6/36 6/60 5/60 4/60 3/60 2/60 1/60 CF HM PL NPL

15
Table 1.10: Causes of cataract

16
2. CATARACT SURGICAL PRACTICES Table 2.1: Distribution of types of cataract surgery by centre

17
Figure 2.1: Distribution of types of cataract surgery by centre % Centre 0 50 100 ECCE Lens aspirations PE PE to ECCE ICCE Secondary IOL Implant G K H S N R I E J F Y T P A 0 V B L W X U D C M Q

18
Table 2.2: Distribution of combined surgery by centre Table 2.2: Distribution of combined surgery by centre

19
Table 2.3: Proportion of nature of cataract surgery

20
Table 2.4: Type of anaesthesia

21
Figure 2.4: Type of anaesthesia Average of local anesthesia =94% % Centre 0 94 50 100 Local General F U T M C S N J P E R K 0 Q Y A B L H G V X D I W

22
Table 2.5: Type of local anaesthesia

23
Table 2.6: Distribution of single and multiple local anaesthesia

24
Table 2.7: Type of sedation given to patient who had local anaesthesia

25
Table 2.8: Distribution of IOL placement

26
Table 2.9: Distribution of cataract surgery without IOL

27
Table 2.10: Distribution of IOL- materials and types

28
3. CATARACT SURGERY OUTCOMES 3.1 Cataract Surgery Complications - Intra-Operative Table 3.1.1: Distribution of intra-operative complications by type of cataract surgery

29
Figure 3.1.1.1: Distribution of intra-operative complication % Intra-operative complication 0 5 10 All surgeries Any 1 2 3 4 5 6 7 8

30
Figure 3.1.1.2: Distribution of intra-operative complication by posterior capsule rupture with vitreous loss and posterior capsule rupture without vitreous loss % Type of cataract surgery 0 5 10 15 20 PCR with vitreous loss PCR without vitreous loss LAECCEPEPE to ECCICCE2 IOL Imp

31
Figure 3.1.1.3: Distribution of intra-operative complication by zonular dialysis with vitreous loss and zonular dialysis without vitreous loss % Type of cataract surgery 0 5 10 15 20 ZD with vitreous loss ZD without vitreous loss LAECCEPEPE to ECCICCE2 IOL Imp

32
Table 3.1.2: Distribution of intra-operative complications by combined surgery Number in each column might add up to be more than that recorded at row with ‘ Any intra-operative complication’ as one patient might have more than one type of intra-operative complications

33
Table 3.1.3: Distribution of intra-operative complications by nature of cataract surgery

34
Figure 3.1.3: Distribution of intra-operative complications by nature of cataract surgery % Intra-operative complication 0 5 10 15 20 Emergency Elective Any 1 2 3 4 5 6 7 8

35
Table 3.1.4: Distribution of intra-operative complications by type of anaesthesia

36
Figure 3.1.4: Distribution of intra-operative complications by type of anaesthesia % Intra-operative complication 0 5 10 General Local Any 1 2 3 4 5 6 7 8

37
Table 3.1.5: Distribution of intra-operative complications by type of local anaesthesia

38
Table 3.1.6: Distribution of intra-operative complications by single or multiple local anaesthesia

39
Figure 3.1.6: Distribution of intra-operative complications by single or multiple local anaesthesia % Intra-operative complication 0 5 10 Single anaesthesia Multiple anaesthesia Any 1 2 3 4 5 6 7 8

40
Table 3.1.7: Distribution of intra-operative complications by type of sedation

41
Figure 3.1.7: Distribution of intra-operative complications by type of sedation % Intra-operative complication 0 5 10 15 No sedation Oral Intravenous Intravenous plus oral Intramuscular Any 1 2 3 4 5 6 7 8

42
Table 3.1.8: Distribution of intra-operative complications by sedation

43
Figure 3.1.8: Distribution of intra-operative complications by sedation % Intra-operative complication 0 5 10 No Sedation Single Sedation Multiple Sedation Any 1 2 3 4 5 6 7 8

44
Table 3.1.9: Distribution of intra-operative complications by cataract surgery with IOL Table 3.1.9: Distribution of intra-operative complications by cataract surgery with IOL

45
Figure 3.1.9: Distribution of intra-operative complications by cataract surgery with IOL % Intra-operative complication 0 20 40 60 80 Posterior Anterior Scleral Any 1 2 3 4 5 6 7 8

46
Table 3.1.10: Distribution of intra-operative complications by cataract surgery without IOL

47
Figure 3.1.10: Distribution of intra-operative complications by cataract surgery without IOL % Intra-operative complication 0 20 40 60 80 IOL Planned No IOL was planned Any 1 2 3 4 5 6 7 8

48
3.2 Cataract Surgery Complications - Post-Operative Table 3.2.1: Distribution of post-operative complications

49
Table 3.2.2: Distribution of post-operative complications by IOL types

50
Table 3.2.3: Distribution of post-operative complication by material

51
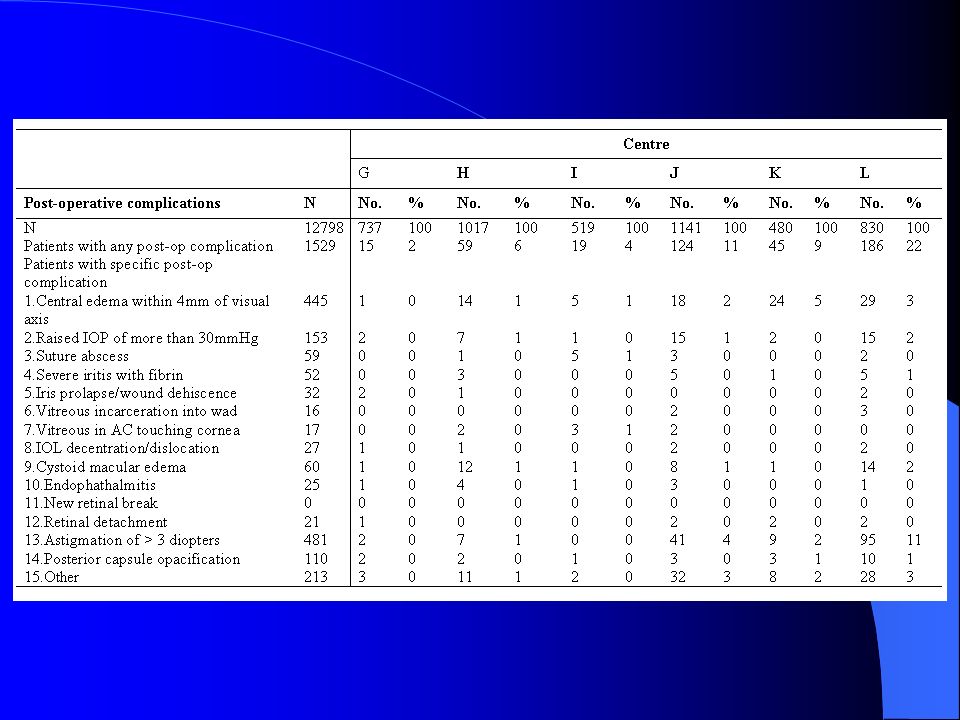
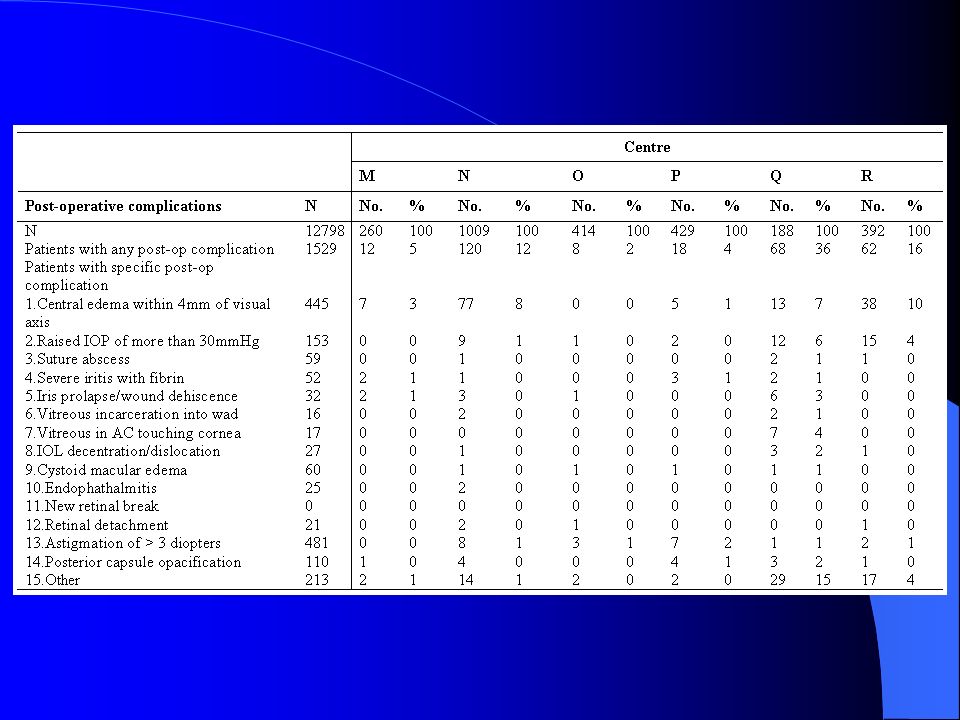
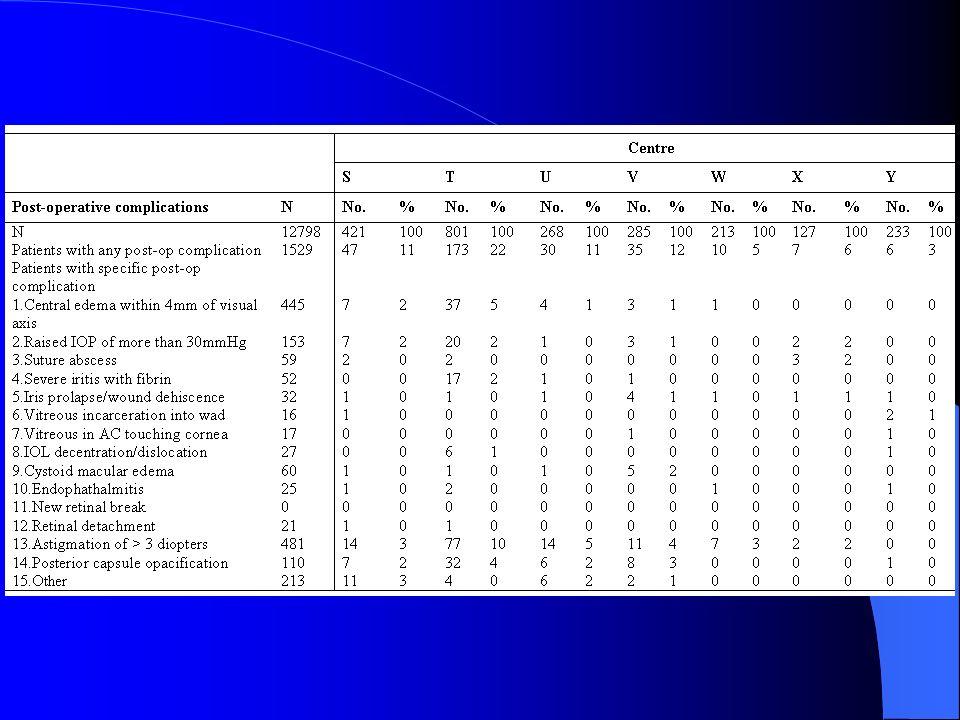
Table 3.2.4: Post-operative complication by centre

55
3.3 Analysis On Cataract Surgery Visual Outcome Table 3.3.1: Median follow-up period in weeks (Patients with only unaided vision, refraction was not performed)
")
56
Table 3.3.2: Median follow-up period in weeks (Patients with refracted vision)
")
57
3.4 Post-Operative Visual Acuity Table 3.4.1: Distribution of post-operative VA

58
Figure 3.4.1.1: Distribution of post-operative VA % Visual acuity 0 10 20 30 40 Unaided Refracted 6/5 6/6 6/9 6/12 6/18 6/24 6/36 6/60 5/60 4/60 3/60 2/60 1/60 CF HM PL NPL

59
Figure 3.4.1.2: Cumulative distribution of visual acuity by pre- and post-operative unaided VA Cumulative distribution Visual acuity Pre-operative Post-operative 6/56/66/96/126/186/246/366/605/604/603/602/601/60CFHMPLNPL 0.25.5.75 1

60
Figure 3.4.1.3: Cumulative distribution of visual acuity by pre- and post-operative refracted VA Cumulative distribution Visual acuity Pre-operative Post-operative 6/56/66/96/126/186/246/366/605/604/603/602/601/60CFHMPLNPL 0.25.5.75 1

61
Table 3.4.2: Distribution of post-operative refracted VA 6/12 or better at the last follow up, by surgery

62
Figure 3.4.2: Percent of patients with refracted VA 6/12 or better at the last follow up, by surgery % VA 6/12 or better Type of surgery 0 50 100 Unaided Refracted LAECCEPEPE to ECCEICCE2 IOL Implant

63
Table 3.4.3:Distribution of post-operative refracted VA 6/12 or better in relation to age and type of surgery

64
Table 3.4.4: Distribution of post-operative refracted VA 6/12 or better in relation to gender and type of surgery

65
Table 3.4.5: Distribution of post-operative refracted VA 6/12 or better in relation to co- morbidity and type of surgery

66
Table 3.4.6: Distribution of post-operative refracted VA 6/12 or better in relation to complication and type of surgery

67
Table 3.4.7: Distribution of post-operative refracted VA 6/12 or better in relation to nature of surgery and type of surgery

68
Table 3.4.8: Distribution of post-operative refracted VA 6/12 or better in relation to anaesthesia and type of surgery

69
Table 3.4.9: Distribution of post-operative refracted VA 6/12 or better in relation to combined surgery and type of surgery

70
Table 3.4.10: Distribution of post-operative refracted VA 6/12 or better in relation to IOL and type of surgery

71
Table 3.4.11: Distribution of post-operative refracted VA 6/12 or better in relation to surgeon status and type of surgery without ocular co-morbidity

72
Table 3.4.12: Distribution of post-operative refracted VA 6/12 or better in relation to centre and type of surgery

73
3.5 Post-Operative Refracted VA Improved by One or More Line of Snellen Chart Table 3.5.1: Distribution of post-operative refracted VA improved by one or more line of Snellen chart, at the last follow up

74
Table 3.5.2: Distribution of post- operative refracted VA improved by one or more line of Snellen chart, with and without ocular co-morbidity at the last follow up

75
Table 3.5.3: Distribution of post- operative refracted VA improved by one or more line of Snellen chart with intra-op complication and without intra-op complication, at the last follow up

76
Table 3.5.4: Distribution of post -operative refracted VA improved by one or more line of Snellen chart with systemic co-morbidity and without systemic co-morbidity, at the last follow up

77
Table 3.5.5: Distribution of post -operative refracted VA improved by one or more line of Snellen chart at the last follow up in relation to surgeon status and type of surgery without ocular comorbidity

78
3.6 Factors Contributing to Post-Operative Refracted Visual Acuity of Worse than 6/12 Table 3.6.1: Distribution of factors contributing to post- operative refracted VA of worse than 6/12

Similar presentations


 Dislocation M.R. Akhlaghi MD.>")


