Download presentation
Presentation is loading. Please wait.

1
Strong and weak ties as predictors of occupational position Dave Griffiths and Paul Lambert University of Stirling 18 th March 2012 Sunbelt Conference, Redondo Beach CA. Work for this paper is supported by the ESRC as part of the project ‘Social Networks and Occupational Structure’, see http://www.camsis.stir.ac.uk/sonocs/ http://www.camsis.stir.ac.uk/sonocs/

2
Theories Social interaction: stratification effects can be demonstrated (Chan, 2010; Laumann & Guttman, 1966; Prandy, 1990; Stewart, Prandy & Blackburn, 1973; Stewart, Prandy, & Blackburn, 1980) Strong and weak ties: Strong ties provide support, weak ties provide substance (Grannovetter 1973, 1983) Social capital: access to beneficial resources is beneficial in itself (c.f. Lin & Erickson 2008) Occupational differentiation: more detail occupational distinctions provide more robust measures (Jonsson et al. 2009)
 Occupational differentiation: more detail occupational distinctions provide more robust measures (Jonsson et al. 2009).")
3
Aims Do more advantaged occupations have increased access to more beneficial resources? Do Position Generators accurately measure accesses to resources Does composition of strong and weak ties matter?

4
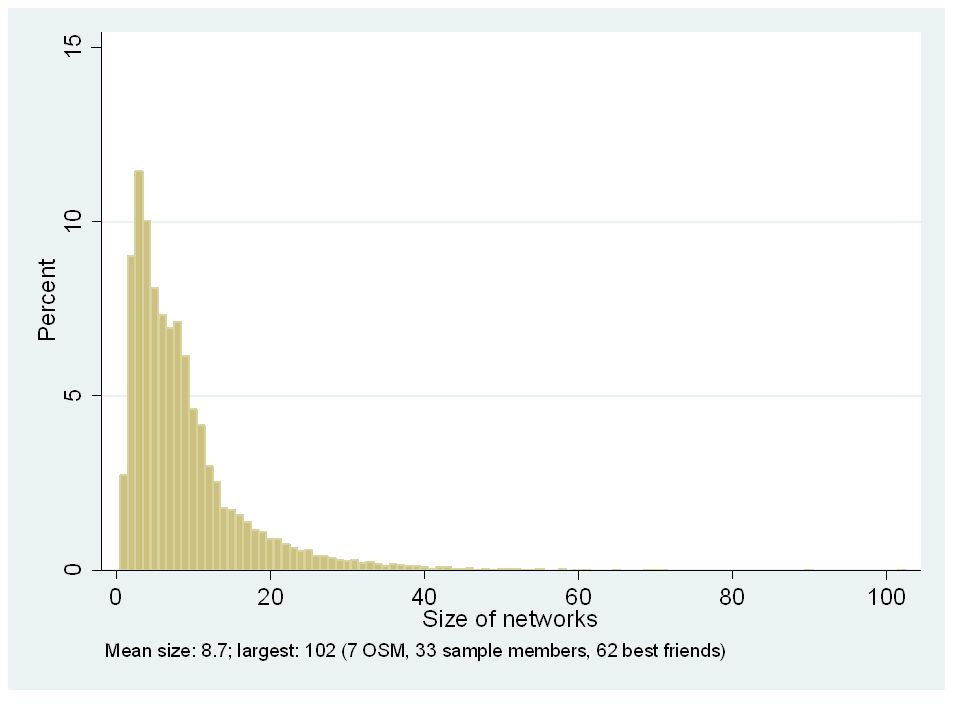
Methodology BHPS 1991-2008 Individuals linked to all they are related to, named as a friend or lived with. Individuals placed within networks of all the alters of their alters, snowballed to include all possible friends of friends of friends of friends 30k individuals grouped into 9k networks

5
Wave 1: Ego (1) lives with parents (2 & 3) and sibling (4) Wave 3: Ego lives with three friends (5, 6 & 7) Wave 5: Ego lives with partner (8) Wave 7: Ego and partner move in with partner’s parents (9 & 10) Wave 15: Ego shares house with three others (11, 12 & 13) Ego Lives with parents in 1991 Lives with friends in 1993 Lives with partner in 1995 (away from hometown) They move into partner’s parents in 1997 (returning to hometown) They split up and ego lives in shared house in 2005 This produces a network of 13 individuals in the survey who have lived with the same ego. There would be 18 opportunities for people to name a best friend, possibly creating a network of 31 individuals. If the sibling has a similar pattern, we could have 22 individuals linkable to the Wave 1 household, and 32 friends. With parent’s (10) friends, this is a network of 64 people.
 friends, this is a network of 64 people..")
8
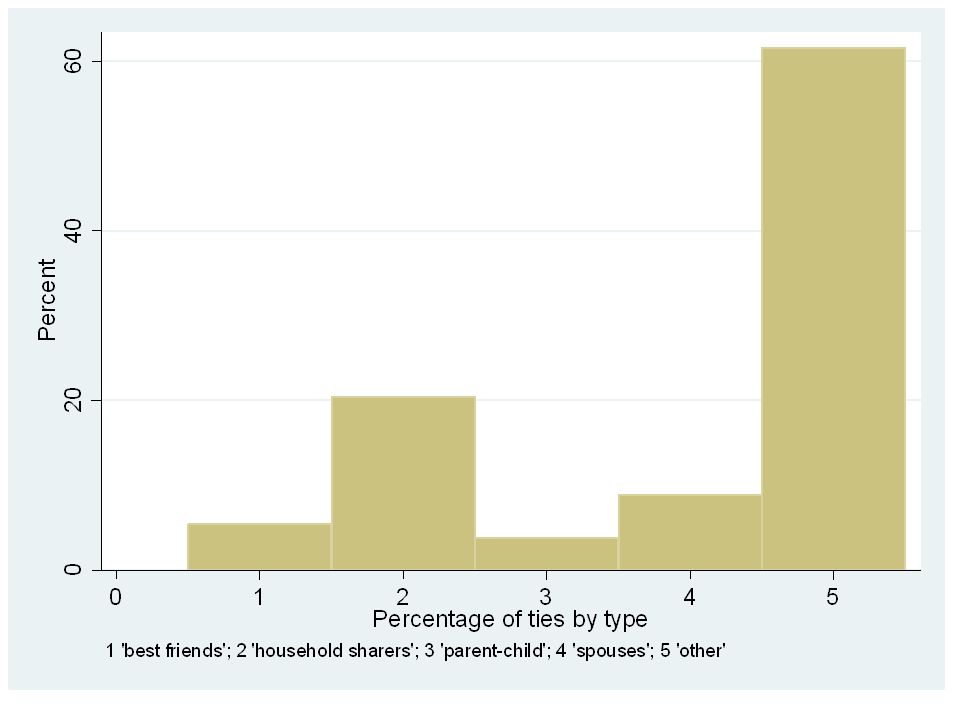
Strong ties Parent - child Grandparent - grandchild Sibling - sibling Spouse - spouse Weak ties include ego to: Best friends and housemates Spouse’s friends and family Former housemates Spouse’s former housemates Son’s spouses former housemates Friends of son’s spouses former housemates

9
Jobs held Most recent job CAMSISGuveli% male University teaching professionals1,8211,07682.3252.3% Primary and middle school teachers4,1371,03665.5413.0% Other managers and administrators n.e.c.3,8651,56063.5171.3% Other secretaries, personal assistants6,3001,88062.353.2% Managers and proprietors in service industries7,6152,63362.3356.3% Accounts and wages clerks, book-keepers8,8722,28359.5535.6% Farm owners and managers2,2661,09458.3877.6% Counter clerks and cashiers4,1831,19055.4530.7% Nurses6,8652,07753.9410.2% Clerks (n.e.c.)12,1973,93752.4530.4% Sales assistants19,2005,66351.9529.3% Other childcare and related occupations3,8821,12351.552.0% Care assistants and attendants of older people5,1861,59446.7512.2% Chefs, cooks, hotel supervisors3,7941,21543.5644.5% Carpenters and joiners3,1351,09842.3699.1% Metal working production and maintenance4,2271,69341.5697.5% Storekeepers, warehousemen/women4,54385837.5582.5% Cleaners, domestics12,4683,78436.4719.2% Bar staff3,6811,16136.0541.0% Drivers of road goods vehicles5,7051,99534.5795.8% 20 most common occupations Source: BHPS 1991-2007
12,1973, % Sales assistants19,2005, % Other childcare and related occupations3,8821, % Care assistants and attendants of older people5,1861, % Chefs, cooks, hotel supervisors3,7941, % Carpenters and joiners3,1351, % Metal working production and maintenance4,2271, % Storekeepers, warehousemen/women4, % Cleaners, domestics12,4683, % Bar staff3,6811, % Drivers of road goods vehicles5,7051, % 20 most common occupations Source: BHPS")
10
% of all BHPS networks with at least one… University teaching professionals13.4% Primary and middle school teachers12.4% Other managers and administrators n.e.c.16.7% Other secretaries, personal assistants21.9% Managers and proprietors in service industries26.0% Accounts and wages clerks, book-keepers22.6% Farm owners and managers8.8% Counter clerks and cashiers13.3% Nurses21.3% Clerks (n.e.c.)32.3% Sales assistants44.8% Other childcare and related occupations13.7% Care assistants and attendants of older people17.3% Chefs, cooks, hotel supervisors13.7% Carpenters and joiners12.2% Metal working production and maintenance16.7% Storekeepers, warehousemen/women11.9% Cleaners, domestics32.4% Bar staff13.7% Drivers of road goods vehicles19.4%
32.3% Sales assistants44.8% Other childcare and related occupations13.7% Care assistants and attendants of older people17.3% Chefs, cooks, hotel supervisors13.7% Carpenters and joiners12.2% Metal working production and maintenance16.7% Storekeepers, warehousemen/women11.9% Cleaners, domestics32.4% Bar staff13.7% Drivers of road goods vehicles19.4%")
11
% of networks linking to % of those with a link to occ. from all who have CAMSIS…..over 65..below 35Diff. University teaching professionals13.4%22.3%7.1%15.2% Primary and middle school teachers12.4%20.3%6.4%13.9% Other managers and administrators n.e.c.16.7%17.6%9.8%7.8% Other secretaries, personal assistants21.9%21.5%14.2%7.3% Managers and proprietors in service industries26.0%23.7%18.4%5.3% Accounts and wages clerks, book-keepers22.6%21.5%14.7%6.8% Farm owners and managers8.8%9.0%7.0%2.0% Counter clerks and cashiers13.3%11.9%9.0%2.9% Nurses21.3%20.0%14.9%5.1% Clerks (n.e.c.)32.3%28.2%22.9%5.3% Sales assistants44.8%36.5%36.8%-0.3% Other childcare and related occupations13.7%10.5%11.0%-0.5% Care assistants and attendants of older people17.3%11.4%16.2%-4.8% Chefs, cooks, hotel supervisors13.7%9.9%11.6%-1.7% Carpenters and joiners12.2%8.6%10.0%-1.4% Metal working production and maintenance16.7%12.5%13.5%-1.0% Storekeepers, warehousemen/women11.9%8.3%10.5%-2.2% Cleaners, domestics32.4%22.8%33.4%-10.6% Bar staff13.7%11.7%10.3%1.4% Drivers of road goods vehicles19.4%12.2%23.5%-11.3%
32.3%28.2%22.9%5.3% Sales assistants44.8%36.5%36.8%-0.3% Other childcare and related occupations13.7%10.5%11.0%-0.5% Care assistants and attendants of older people17.3%11.4%16.2%-4.8% Chefs, cooks, hotel supervisors13.7%9.9%11.6%-1.7% Carpenters and joiners12.2%8.6%10.0%-1.4% Metal working production and maintenance16.7%12.5%13.5%-1.0% Storekeepers, warehousemen/women11.9%8.3%10.5%-2.2% Cleaners, domestics32.4%22.8%33.4%-10.6% Bar staff13.7%11.7%10.3%1.4% Drivers of road goods vehicles19.4%12.2%23.5%-11.3%.")
13
Public private divide Secretaries IT/software/ computer experts educationalists Laboratory worker Healthcare workers Managers PR/ advertising artists Farm workers No strong patterns – plenty of dyads with an obvious working relationship, but linking together unrelated areas (i.e., clothes makers and coal miners linking together) All ties Social workers
 All ties Social workers")
14
Weak ties (mostly friendship or distant hhld connections)
")
15
Strong ties (mostly close family/ household sharers)
")
16
mean CAMSIS most recent job Ever held job % of people with any link to category Education71.64.2%4.7%31.0% Healthcare56.34.7%5.6%42.6% Law77.40.6%0.7%8.1% Financial services71.31.3%1.9%20.3% Builders42.25.7%7.2%52.9% Car mechanics43.30.9%1.4%17.0%

19
Weak tieStrong tie Same occupation86.7%13.3% Different occupation84.0%16.0% CAMSISWeak ties Strong ties.38.58 Weak ties.46 Correlation between most recent CAMSIS score and the mean of strong and weak ties Source: BHPS 1991-2008 Percentage of within occupation connections attributable to strong and weak ties. Source: BHPS 1991-2008

20
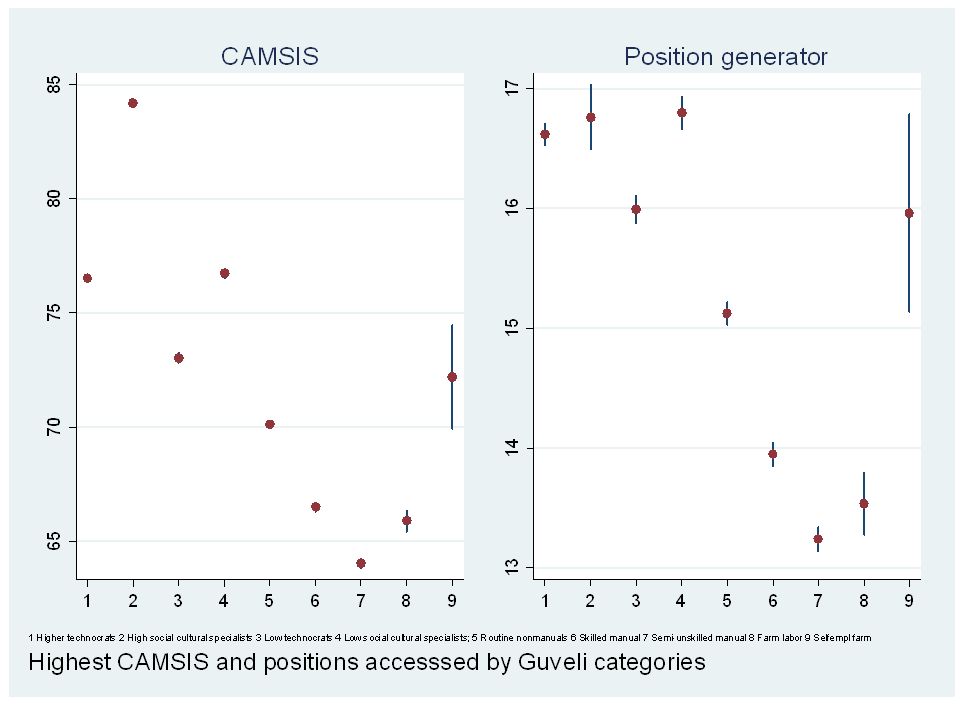
Conclusions Position Generators tend to lead to grouping together of occupations with similar stratification positions, but: – Can elide nuanced differences between some occupations – Possibly due to the need to focus on selected common occupations – Other forms of network summary may better reflect social distances than PG approach Differences between strong and weak ties can be observed in patterns of common connections between occupations, with weaker ties dispersed more widely and structurally less shaped by stratification position Little difference between strong and weak ties in strength of relation between own and alter occupation: both reflect the same overall trend for homophily

21
Bibliography Chan, T. W. (2010). The social status scale: Its construction and properties. In T. W. Chan (Ed.), Social Status and Cultural Consumption (pp. 28-56). Cambridge: Cambridge University Press. Granovetter, M. (1973) The Strength of Weak Ties. American Journal of Sociology, 78(6), 1360-1380. Granovetter, M. (1983) The Strength of Weak Ties: A Network Theory Revisited. Sociological Theory, 1, 201-233. Jonsson, J.O., Grusky, D.B., Di Carlo, M., Pollak, R., & Brinton, M.C. (2009) Microclass Mobility: Social Reproduction in Four Countries. American Journal of Sociology, 114(4), 977-1036. Laumann, E. O., & Guttman, L. (1966). The relative associational contiguity of occupations in an urban setting. American Sociological Review, 31, 169-178. Lin, N., & Erickson, B. (2008) Social Capital: An International Research Program. Oxford: Oxford University Press. Prandy, K. (1990). The Revised Cambridge Scale of Occupations. Sociology-the Journal of the British Sociological Association, 24(4), 629-655. Stewart, A., Prandy, K., & Blackburn, R. M. (1973). Measuring the Class Structure. Nature. Stewart, A., Prandy, K., & Blackburn, R. M. (1980). Social Stratification and Occupations. London: MacMillan.
, Social Status and Cultural Consumption (pp ). Cambridge: Cambridge University Press. Granovetter, M. (1973) The Strength of Weak Ties. American Journal of Sociology, 78(6), Granovetter, M. (1983) The Strength of Weak Ties: A Network Theory Revisited. Sociological Theory, 1, Jonsson, J.O., Grusky, D.B., Di Carlo, M., Pollak, R., & Brinton, M.C. (2009) Microclass Mobility: Social Reproduction in Four Countries. American Journal of Sociology, 114(4), Laumann, E. O., & Guttman, L. (1966). The relative associational contiguity of occupations in an urban setting. American Sociological Review, 31, Lin, N., & Erickson, B. (2008) Social Capital: An International Research Program. Oxford: Oxford University Press. Prandy, K. (1990). The Revised Cambridge Scale of Occupations. Sociology-the Journal of the British Sociological Association, 24(4), Stewart, A., Prandy, K., & Blackburn, R. M. (1973). Measuring the Class Structure. Nature. Stewart, A., Prandy, K., & Blackburn, R. M. (1980). Social Stratification and Occupations. London: MacMillan..")
Similar presentations


. Average sample wage = £1163 per month (in real.>")

 2010 7.5%9.5% 20097.8%9.6% Rochester MSA U.S.>")


 Paul Gregg (University of Bristol) Lindsey Macmillan (Kennedy School of Government, Harvard)>")


