Download presentation
Presentation is loading. Please wait.

1
Session C-5: ARIA Prize Paper CAS Spring Meeting May 2006 The Use of DFA to Determine Whether an Optimal Growth Rate Exists for a Property-Liability Insurer by Stephen P. D’Arcy and Richard W. Gorvett University of Illinois Published in the Journal of Risk and Insurance, December, 2004

2
Overview Introduction Dynamic Financial Analysis Aging Phenomenon Market Value of P-L Insurance Company Optimal Growth Rate Analysis of Results

3
Dynamic Financial Analysis An approach to modeling insurance companies Solvency testing Ratings DFA models also allow managers to test various operational strategies

4
Utilize a DFA model to determine the optimal growth rate based on - mean-variance efficiency - stochastic dominance - constraints of leverage Based on the latest version of a public access DFA model (DynaMo3) http://www.pinnacleactuaries.com/ Objective of Paper
 Objective of Paper")
5
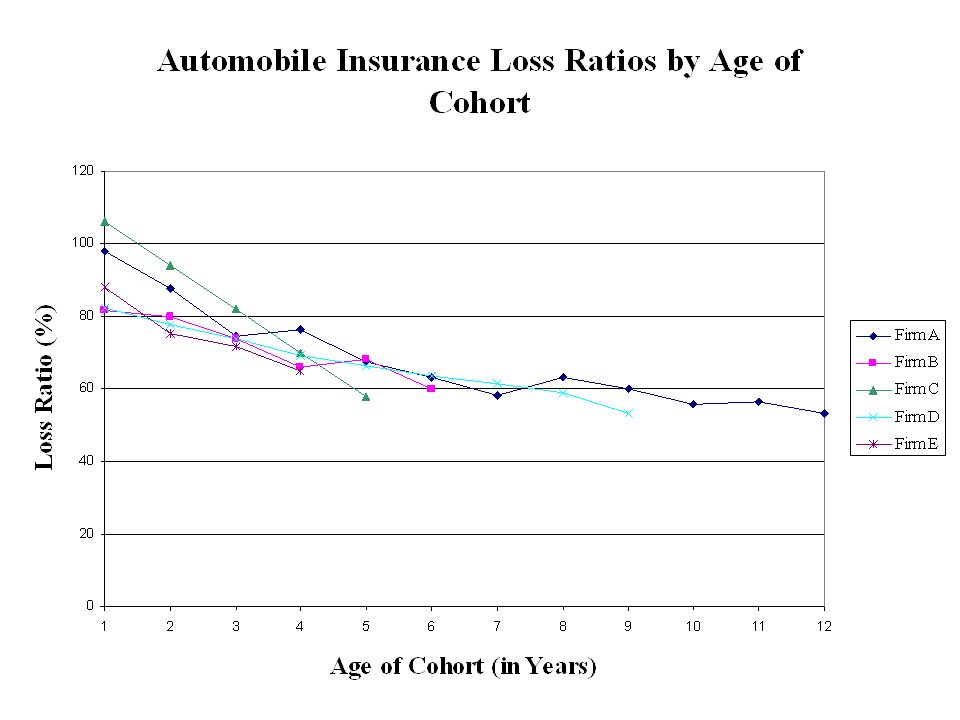
Aging Phenomenon New business has a very high loss ratio, often in excess of the initial premium The loss ratio then declines with each renewal cycle to the profitable point Longer-term business has an even lower loss ratio, making it very profitable A P-L insurer’s growth rate has a significant effect on profitability

7
Market Value of P-L Insurance Company Determining the market value of a hypothetical property-liability insurer is not a simple task. Only a few P-L insurers are stand-alone companies that are publicly traded, allowing the market value of the firm to be observed

8
Approaches to Determine Company Value Fama-French model (three factor model) r - R f = beta x ( K m - R f ) + b s x SMB + b v x HML + alpha SMB - small [cap] minus big HML - high [book/price] minus low CAPM Multiple Regression (our method)
![Approaches to Determine Company Value Fama-French model (three factor model) r - R f = beta x ( K m - R f ) + b s x SMB + b v x HML + alpha SMB - small [cap] minus big HML - high [book/price] minus low CAPM Multiple Regression (our method)](http://images.slideplayer.com/24/6962355/slides/slide_8.jpg "Approaches to Determine Company Value Fama-French model (three factor model) r - R f = beta x ( K m - R f ) + b s x SMB + b v x HML + alpha SMB - small [cap] minus big HML - high [book/price] minus low CAPM Multiple Regression (our method)")
9
The market value of an insurer is measured by - Policyholders’ Surplus - Net Written Premium (the size of the book of business) - Combined Ratio and Operating Ratio (profitability) Multiple Regression Approach
 - Combined Ratio and Operating Ratio (profitability) Multiple Regression Approach")
10
Companies in Sample

11
Regression Analysis

12
Results of regression for each company separately

13
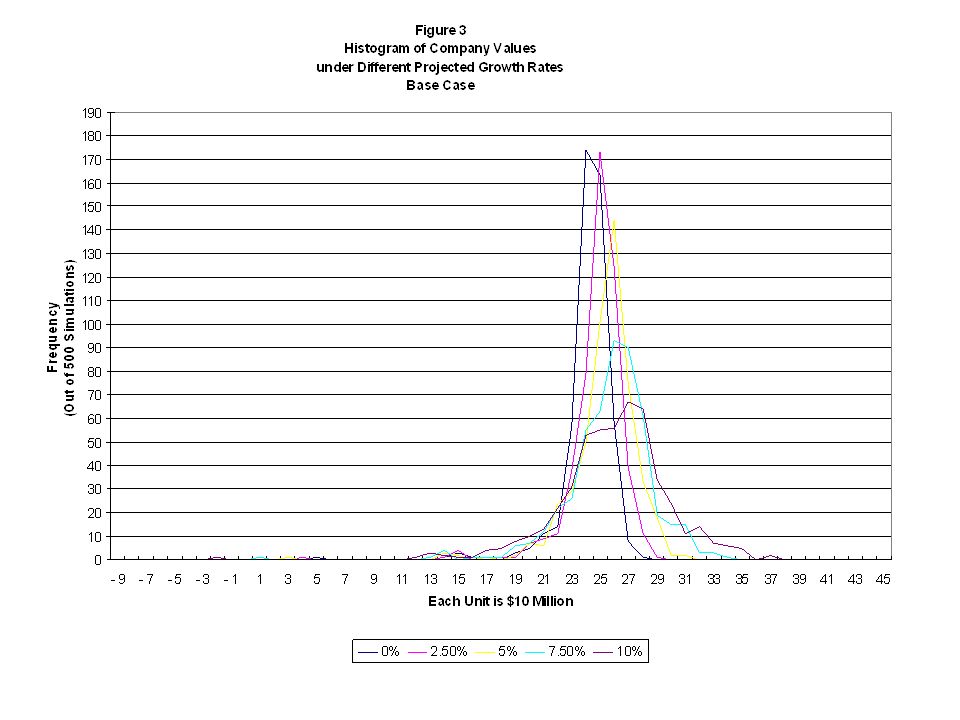
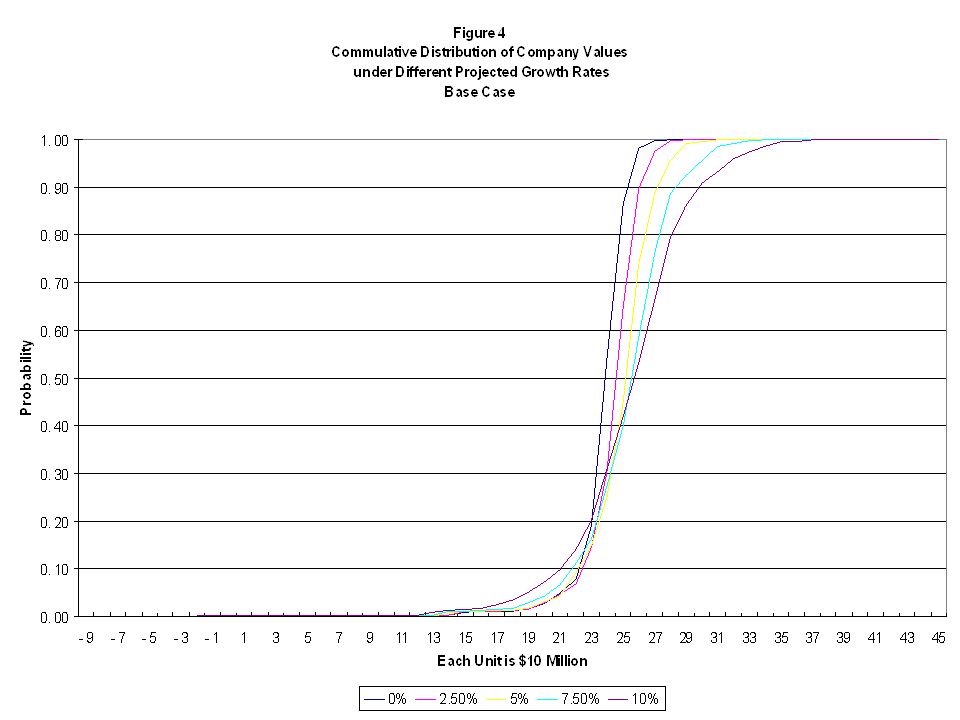
Optimal Growth Rate Target Metric Net income over the projection period plus the terminal value of the company at the end of the five-year period

14
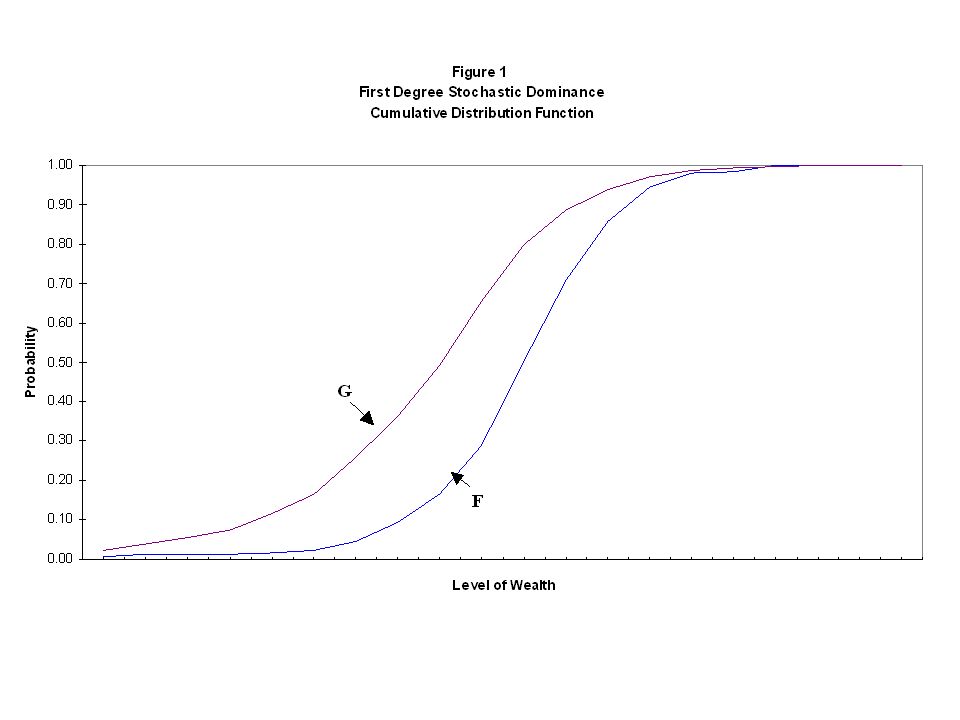
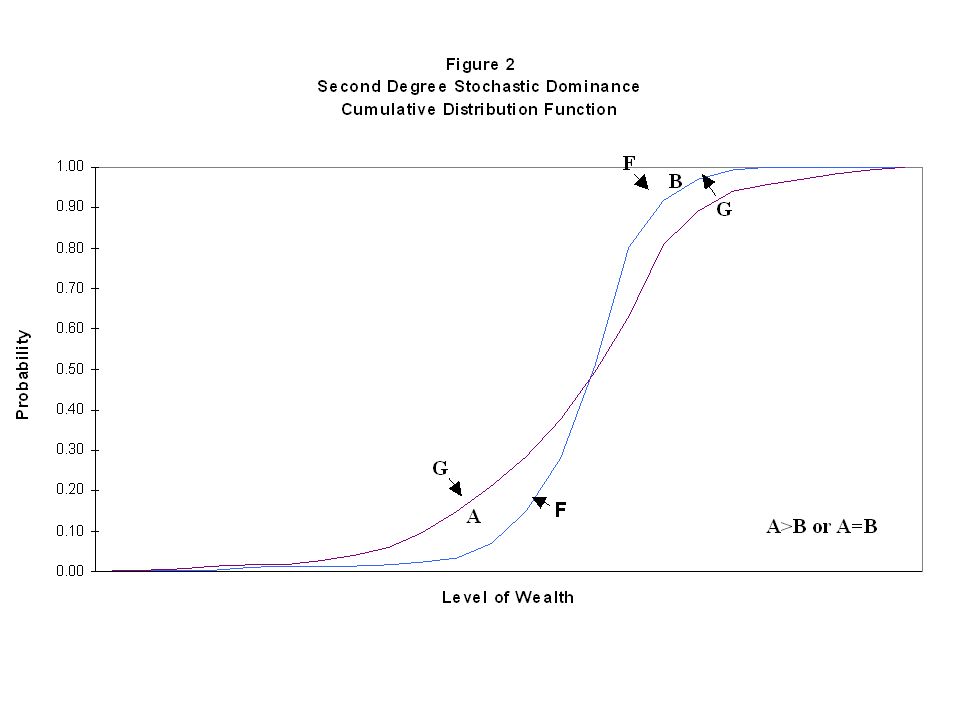
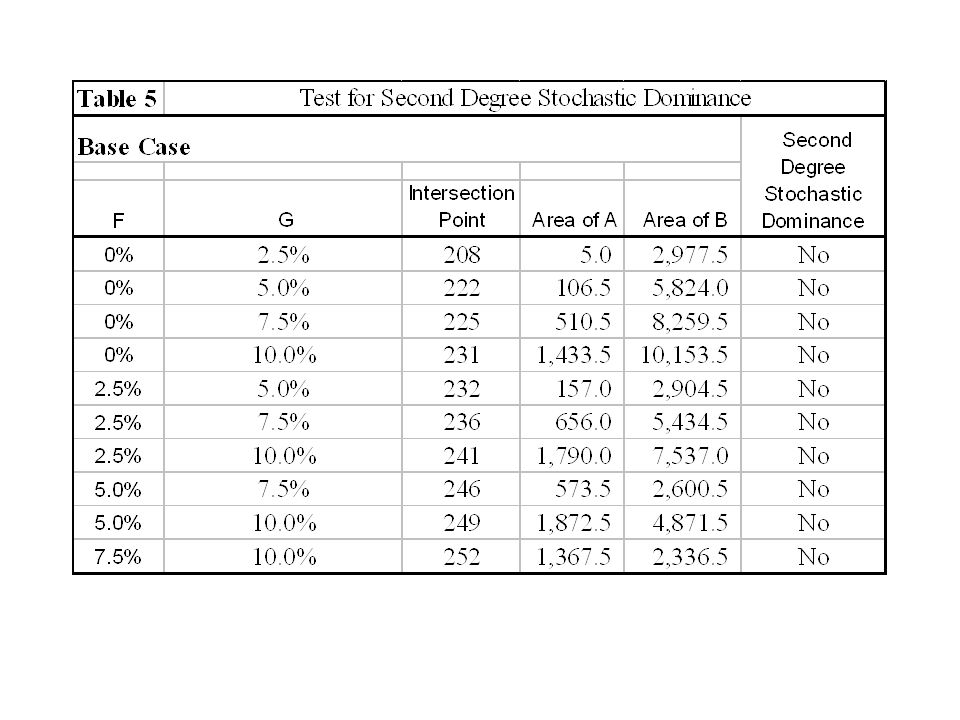
Sensitivity Test Assume several different growth rates within the range of reasonable values Mean-Variance analysis First-degree stochastic dominance Second -degree stochastic dominance

15
Mean-Variance illustration

21
Operating Constraints The optimal growth rate cannot be determined based on –mean-variance analysis –first- or second-degree stochastic dominance Impact of adding constraints

22
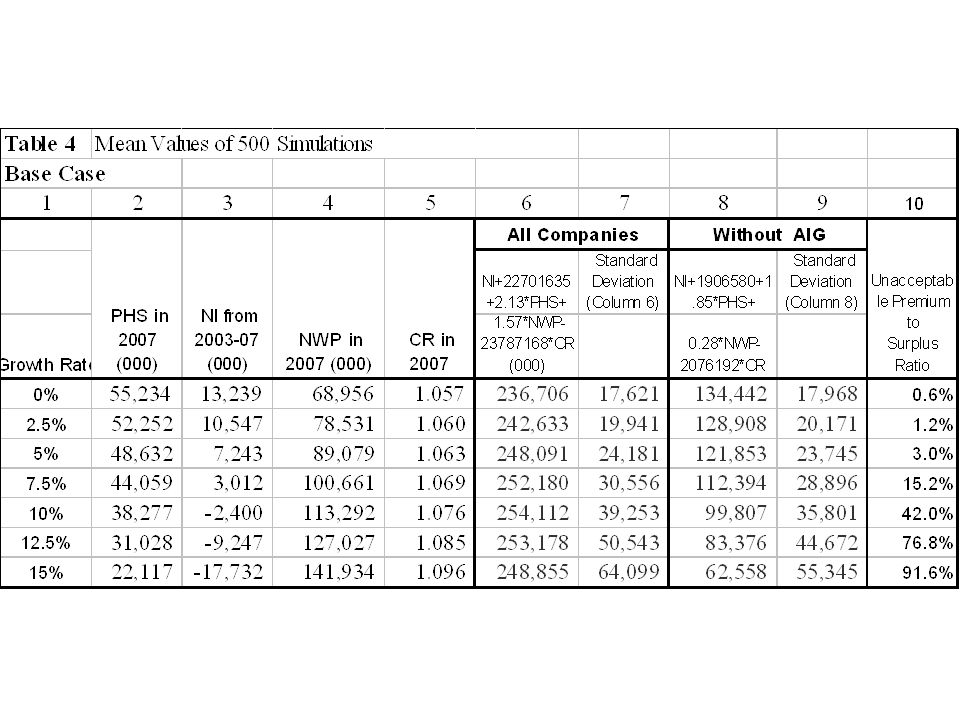
Constraining Premium-to-Surplus Ratios The proportion of outcomes that lead to unacceptable premium-to-surplus levels can be added as a constraint in the maximization process.

24
Comparative Statics Initial state of the insurance market Acuity of the aging phenomenon Renewal rate Starting interest rates

25
Initial state of the insurance market

26
Acuity of the aging phenomenon

27
Renewal rate

28
Starting interest rates

29
DFA Model Characteristics Implied rate change variable depends on - current market condition (mature hard, immature soft, mature soft and immature hard) - targeted growth rate - rate change impacts profitability Potential impact on persistency (renewal rate) - rate changes could impact persistency - effect could vary by age of business Managing growth rates - DFA program uses constant growth rate - managers likely to vary growth target based on market conditions - need to modify DFA program
 - targeted growth rate - rate change impacts profitability Potential impact on persistency (renewal rate) - rate changes could impact persistency - effect could vary by age of business Managing growth rates - DFA program uses constant growth rate - managers likely to vary growth target based on market conditions - need to modify DFA program")
30
Caveats Models are simplified versions of reality This DFA model deals with quantifiable risk only Excludes the following risks - A line of business being socialized - Management fraud - Catastrophic risks other than historical patterns

31
Conclusions Increasing the growth rate reduced statutory policyholders’ surplus and current net income, but increased both the future market value of the insurer and the volatility of results The optimal growth rate for the modeled insurer varied from zero to 7.5 percent Growth rates of 10 percent or higher generated unacceptable premium to surplus ratios too frequently Low initial interest rates increased the incentive for growth High initial interest rates lowered the optimal growth rate Varying the other key parameters did not affect the optimal growth rate significantly

Similar presentations


 2.1. Case study 1 : buy side & sell side.>")


 Efficient frontier Capital.>")


