Download presentation
Presentation is loading. Please wait.

1
Structure and processes within hydrosphere
WATER…. Structure and processes within hydrosphere

2
Water Earth is ¾ water Water breakdown Oceans -97.3% Frozen - 2.1%
Underground (aquifers) – 0.6% Lakes and rivers – 0.01% Atmosphere – 0.001%
 – 0.6% Lakes and rivers – 0.01% Atmosphere – 0.001%")
3
Distribution of Water on Earth

4
Properties of Water Cohesive – sticks to itself
Adhesive – sticks to other materials High specific heat – takes lots of energy to increase/decrease temperature

5
Properties of Water Water is polar Polar likes polar
Oil is not polar – oil does not mix

6
Properties of Water Density = 1 g/mL
Mass/volume (room temp) Density is effected by temperature and salinity Most dense at 4⁰C Least dense - solid Only substance to EXPAND when solid Why is this a good thing?
 Density is effected by temperature and salinity. Most dense at 4⁰C. Least dense - solid. Only substance to EXPAND when solid. Why is this a good thing")
7
Properties of Water Density influences ocean currents
Warm water flows from equator to poles Cold water flows from poles to equator

9
Water Cycle Movement of water in, on, and above earth’s surface
Constantly changing forms; ice, water, vapor

10
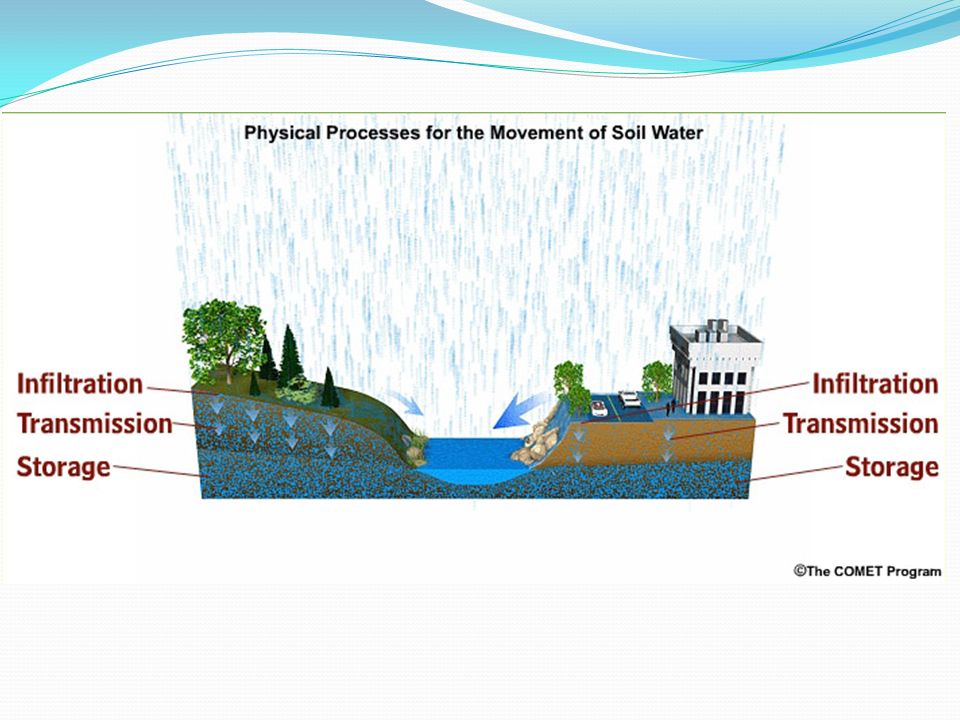
Water Cycle Flows over the land Runs off Infiltrates Evaporates

12
Water Cycle Evaporates –moisture in atmosphere; forms clouds
Rain to Run off – streams, rivers, lakes, oceans, etc Rain to infiltration – absorbed by vegetation, fills gaps in earth, becomes ground water

13
Water cycle Which would allow water to flow through more easily?
Notice the gaps!!!! Easiest Most Difficult 2nd Easiest

14
Water Cycle Create mural of water cycle Include the following:
Run off, precipitation, evaporation, infiltration, condensation, and transpiration Define each term on the back of your mural Can be found on page in blue Earth Science Book

15
River Basins An entire geographical area drained by a river and its tributaries Characterized by all runoff being taken to same outlet

16
Watersheds Smaller area of land that drains to a smaller stream, lake or wetland Many smaller watersheds within a river basin.

17
Ground Water Ground Water: the water that lies beneath the ground surface filling cracks and pores in all types of rock Source rain and snow that falls to the ground, some percolates down into the ground

18
Porosity and Permeability
Porous: a rock that holds much water Permeable: a rock that allows water to flow easily through it Impermeable: a rock that does not allow water to flow through it easily

19
The Water Table water table: the upper surface of the zone of saturation

20
Aquifers Aquifer: a body of saturated rock or sediment through which water can move easily sandstone, conglomerate, limestone, bodies of sand and gravel

21
Movement of Groundwater
Percolates into ground (downward) May travel down slope Moves easily through porous rock and not through compacted rock or rocks w/o pores
 May travel down slope. Moves easily through porous rock and not through compacted rock or rocks w/o pores.")
22
Ground Water and Flooding
Ground becomes too saturated – leads to flooding saturated zone: the subsurface zone in which all rock openings are filled with water

23
Ground Water and Flooding

24
http://video. nationalgeographic

25
Human Use of Water

26
Wells Well: cylindrical hole dug to penetrate aquifer within saturated zone Recharge: addition of new water to aquifer

27
Balancing Withdrawal and Recharge
Not balancing can result in: a regional water table dropping the ground surface settling because the water no longer supports the rock and sediment Subsidence of the land surface caused by the extraction of ground water, near Mendota, San Joaquin Valley, CA. Signs on the pole indicate the positions of the land surface in 1925, 1955, and 1977. The land sank 30 feet in 52 years.

29
Balancing Withdrawal and Recharge
Towns may use artificial recharge to increase recharge Water is stored in infiltration ponds = increase the rate of water percolation into the ground

30
Groundwater Pollution
chemicals used for agriculture can find their way into groundwater rain can also leach pollutants from city dumps into ground-water supplies

31
Groundwater Pollution
May affect water years from now May take a long time to reach water

32
Groundwater Pollution
Saltwater Intrusion Movement of saline water into freshwater aquifers Contamination of drinking water Salt water is denser, as freshwater is leached, salt water can take its place

33
Surface water Pollution
Non-point pollution – pollution from many sources Sedimentation, stormwater runoff, etc Not easily traced Point-pollution – pollution from one source Easily traced and easily taken care of

34
Water Treatment Most water that goes down drains in urbanized areas are treated Removal of sludge from water Very toxic waste that we must dispose of

35
Water Treatment Drinking water from salt water
Desalination – removal of salt from saltwater Takes lots of energy

36
Conservation Measures
1972 – Clean Water Act “restore and maintain the chemical, physical, and biological integrity of the nation’s waters.” 1972 – Marine Protection, Research, and Sanctuaries Act 1975 – Safe Drinking Water Act (groundwater and surface water) 1987 – Water Quality Act
 1987 – Water Quality Act.")
37
Conservation Measures
Need to protect water sources for our future Increase population = increase need for water Increase population = increase pollution Must take care of our water for our survival!

38
Hydroelectric Dams Build barrier in valley to retain freshwater
Water rises to the same level as top of barrier Uses water flow to also generate clean electricity.

40
Hydroelectric Dams Positive effects
Long term large body of freshwater resource Prevents water from reaching ocean quickly Provides large areas with freshwater Clean electricity Recreation Control water flow – less chance of flooding

41
Hydroelectric Dams Negative effects (down stream) Reduces water flow
Less water for down stream individuals Less water for wild life Less nutrients carried Migrating/reproducing organisms cannot pass dam Dam break = massive flooding

42
Hydroelectric Dams Negative effects (upstream)
Displaces wildlife/destroys lower level environments Floods towns/homes below level of dam Stagnant water = decrease in water quality

43
Hydroelectric Dams Much debate over building new power dams
Several dams being destroyed to allow natural flow Energy/water crisis Are dams our answer??

Similar presentations