Download presentation
Presentation is loading. Please wait.

1
Jordan Shockley and Tim Stombaugh

3
Losing Popularity Savings of 2-10% Upgradeability

5
Low-CostSub-MeterDecimeterRTK $50-300$1k – 4k $5k-10k +$1500/yr >$25k 8-25 ft.<3 ft.<1 ft.< 1 in.

7
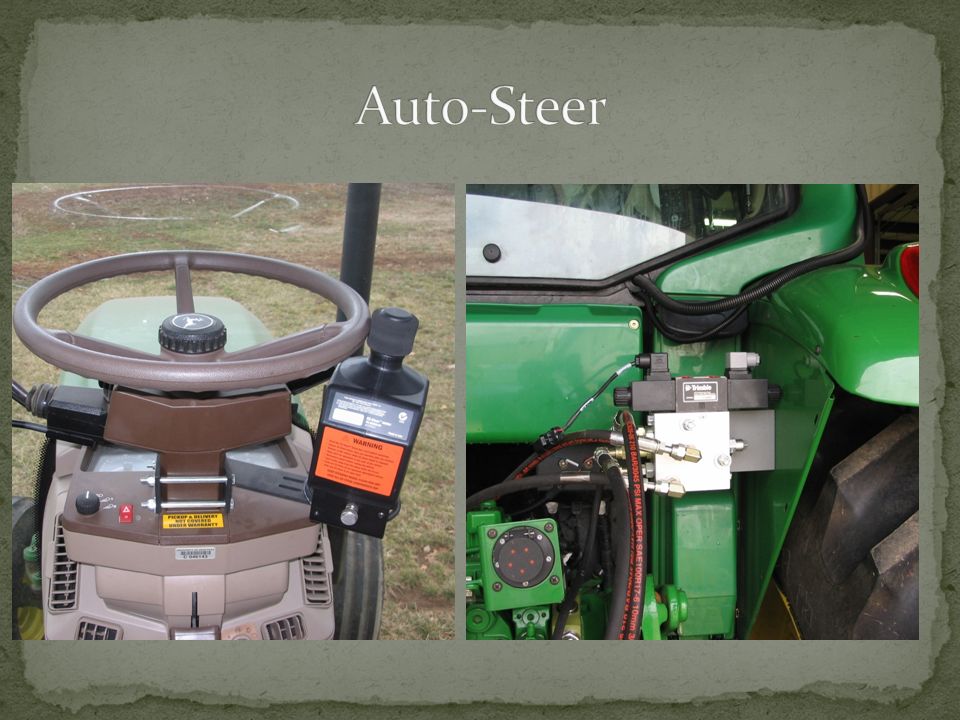
Hardware GPS Machine quality Calibration Implement drift A-B Line

8
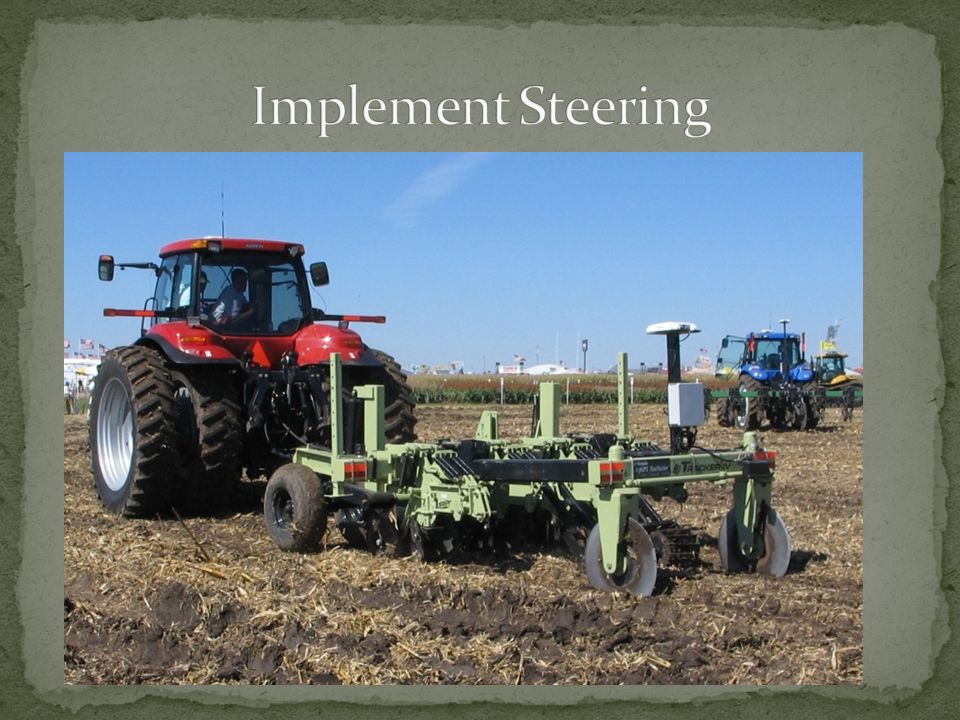
Passive: Over-steer tractor Active: Steer implement

9
Less expensive Tractor running over row Limited response speed Difficult to predict implement performance

11
Reduces skips and overlaps Reduces fatigue Accurate placement of inputs Lengthening of operator’s workday Increase in machinery field capacity Reduced machinery costs Permits more land area to be planted during optimal time Reduce risk Land investment implications

13
Answers “Should I make a change?” Estimate of changes in income, expenses and profits associated with a proposed modification in the whole farm plan Examples of possible changes?

14
Allows managers to make adjustments “Fine-tuning” Consider interactions consciously Focus on marginal - things that actually change from implementing the new plan If it doesn’t change, don’t include it

15
Additional Revenue Reduced Revenue Additional Costs Reduced Costs Additional revenue and reduced costs raise profits Reduced revenue and additional costs lowers profits

16
Simplifies task involving complex decisions Forces consideration of marginal economics Encourages considering change -simple tool

17
Can still be cumbersome with complex changes Economic evaluation not always a physically feasible evaluation Many small changes are possible but not enough time to evaluate them all with partial budgeting

18
Additional Costs (AC): AC – Fixed AC – Variable (per acre)*A Additional Revenue (AR): AR – Fixed AR – Variable (per acre)*A Reduced Revenue (RR): RR – Fixed RR – Variable (per acre)*A Reduced Costs (RC): RC – Fixed RC – Variable (per acre)*A Total 1 = AC F + AC V *A+ RR F + RR V *ATotal 2 = AR F + AR V *A+ RC F + RC V *A Net Change In Profit = Total 2 - Total 1 + or - ??? If +, then implement the change If -, then don’t implement the change

19
The amount of acres required for which you would be indifferent to making the change. (i.e. the net change in profit = 0)
.")
20
Opportunity cost (e.g. learning curve) Risks (up/down) Feasibility (physically possible, resource requirements) Desirability (noneconomic goals)
 Risks (up/down) Feasibility (physically possible, resource requirements) Desirability (noneconomic goals).")
21
800 acres $35,000 investment outlay, $5,000 ownership cost Increase yields from 150 bu/ac to 151 bu/ac Corn price = $4.40/bu Fertilizer = $111 Savings = 3% Seed = $76 Savings = 2% Herbicide = $30 Savings = 7% Fuel = $17 Savings = 10% Labor = $20 Savings = 10%

22
Additional Costs: Auto-steer Ownership $5,000 Additional Revenue: Corn Sales (151-150 bu/ac)*$4.40/bu*800 ac = $3,520 Reduced Revenue:Reduced Costs: Fertilizer $111*800*.03 = $2,664 Seed $76*800*.02 = $1,216 Herbicide $30*800*.07 = $1,680 Fuel $17*800*.10 = $1,360 Labor $20*800*.10 = $1,600 Total: $5,000Total: $12,040 Net Change In Profit: $7,040 Should you purchase auto-steer to increase profits? YES – Profits are expected to increase $7,040 for the farm

Similar presentations


>")


>")


