Download presentation
Presentation is loading. Please wait.

1
Bernard Hosanna Shawana Jackson Brett Kinkopf Jonathan Kocon Chien-Ying Lee

2
Industry Analysis Business Analysis Economic Analysis Financial Analysis Valuation Analysis Recommendation

3
What is the Industrial Sector? Publicly traded companies that are responsible for manufacturing, agriculture, mining, and construction. “Extremely heterogeneous”

4
What is the Industrial Sector? This includes: Aerospace/Defense Residential and Commercial Construction (Including materials and services) Machinery (Farm, Construction, and Industrial) Electrical Equipment Waste Management Wood Production Small and Machine Tools Metal Fabrication
 Machinery (Farm, Construction, and Industrial) Electrical Equipment Waste Management Wood Production Small and Machine Tools Metal Fabrication.")
5
Who Are The Big Players? #10- Raytheon Co. 20.4B #9- Deere & Co. 21.1B #8- Illinois Tool Works Inc. 21.4B #7- General Dynamics Corp. 25.7B #6- Lockheed Martin 28.2B #5- Honeywell International 28.6B #4- Caterpillar 32.3B #3- Emerson Electric Co. 34.0B #2- ABB Ltd. 40.1B #1- Boeing Co. 44.1B

6
How big is this sector? Total Market Cap of $836.0 Billion This is 10.51% of the S&P 500 How do we weigh compared to the S&P 500? S&P 500 = 10.51% SIM = 12.36 Δ = 1.85%

7
Performance Year to date of -1.9% Quarter to date of -1.9% Year to Date

8
Three Months to Date Performance

10
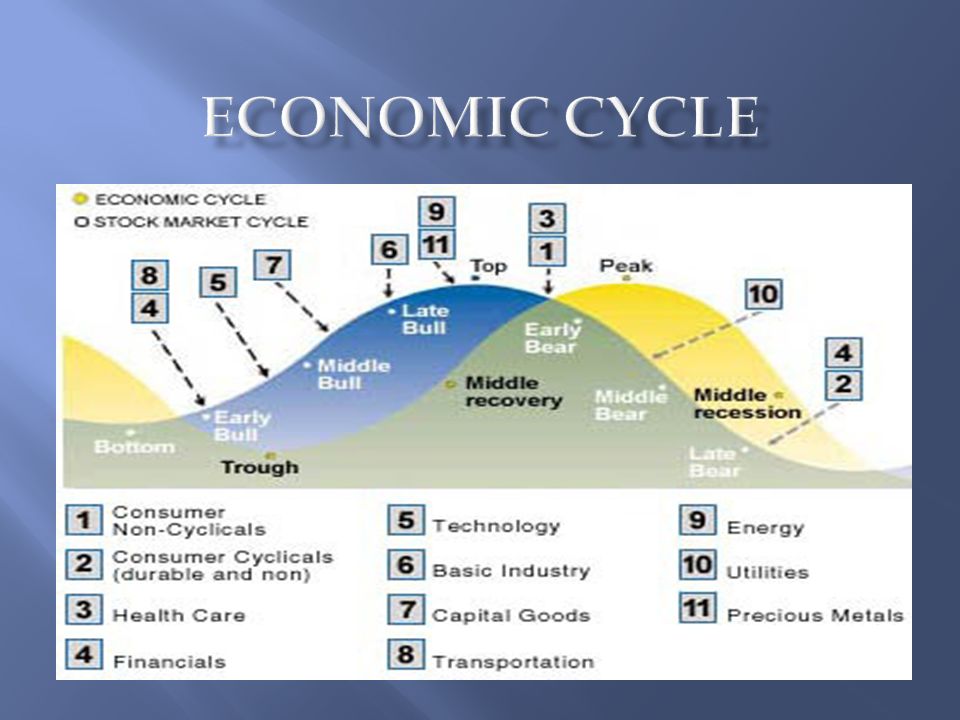
IntroductionGrowthDeclineMaturity Maturity: Sales growth ≈ growth of the economy Earnings growing, but at a slower rate Some expansion from cash cows, late entrants

11
TIME Recession Trough Recovery Peak Recession Trough Expansion? Consumer confidence slightly up Unemployment slightly down Growth in developing economies Output Expansion Contraction

12
LIFE CYCLE: MATURITY INDUSTRY BREAKDOWN Larger, more dominant firms Minimal innovations Business Cycle: Expansion IntroductionGrowthDeclineMaturity Expansion of production capacity Emerging markets a source of competition?

13
FIVE FORCES MODEL Barrier to Entry Buyer Power Degree of Rivalry Threat of Substitutes Supplier Power High initial capital investment Cyclical sector High rivalry Substitution, supplier power nonissue

16
The Industrials sector is strongly correlated with S&P 500 Real GDP Commercial and Industrial loans Durable Goods Orders

17
Correlation= 0.9

18
Correlation= 0.85

19
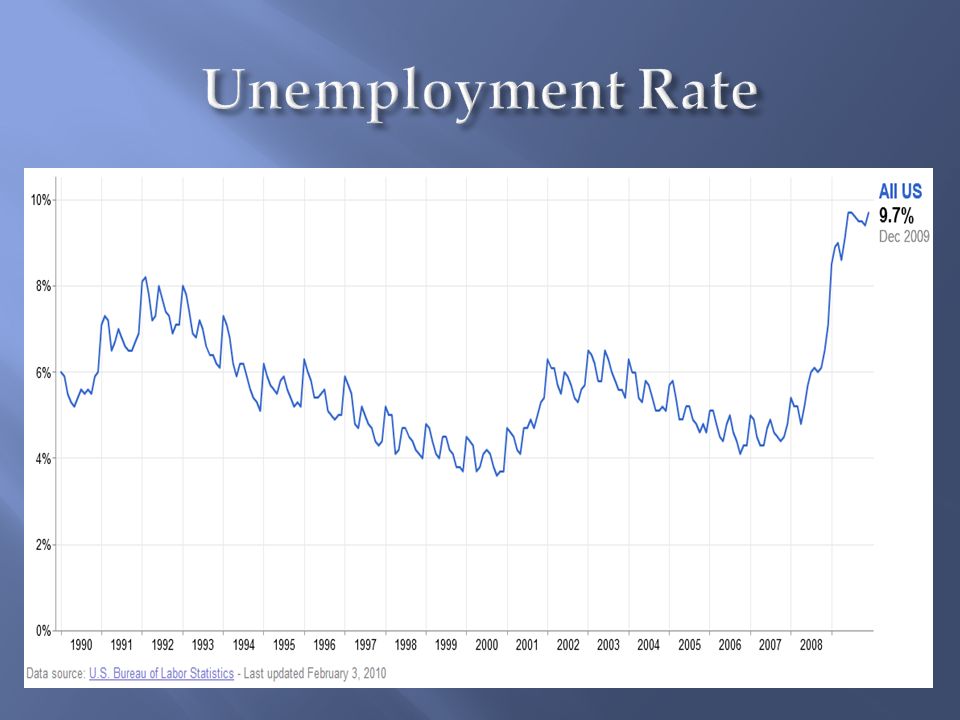
Key drivers for the Industrials sector ISM Manufacturing & Non-Manufacturing data Global Economic Growth Capital spending Unemployment rate Industrial Production

24
Bulls Improved Global Growth Improving Manufacturing Data Better Consumer Confidence GDP Growth Bears High Unemployment Rate Rising Interest Rates Global Political Issues Growing Debt Risk

35
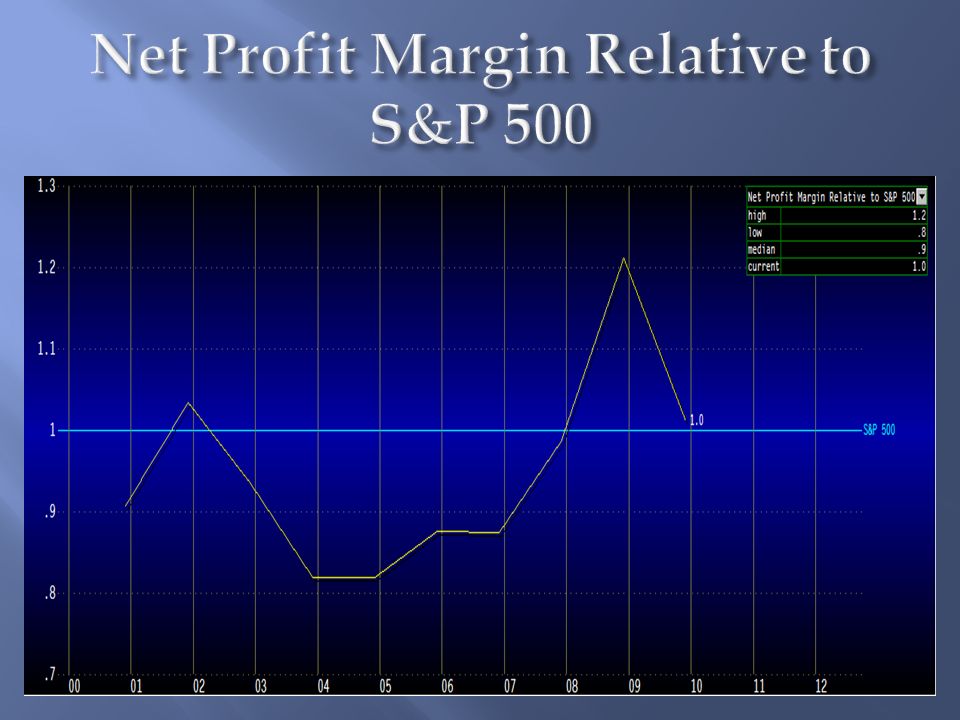
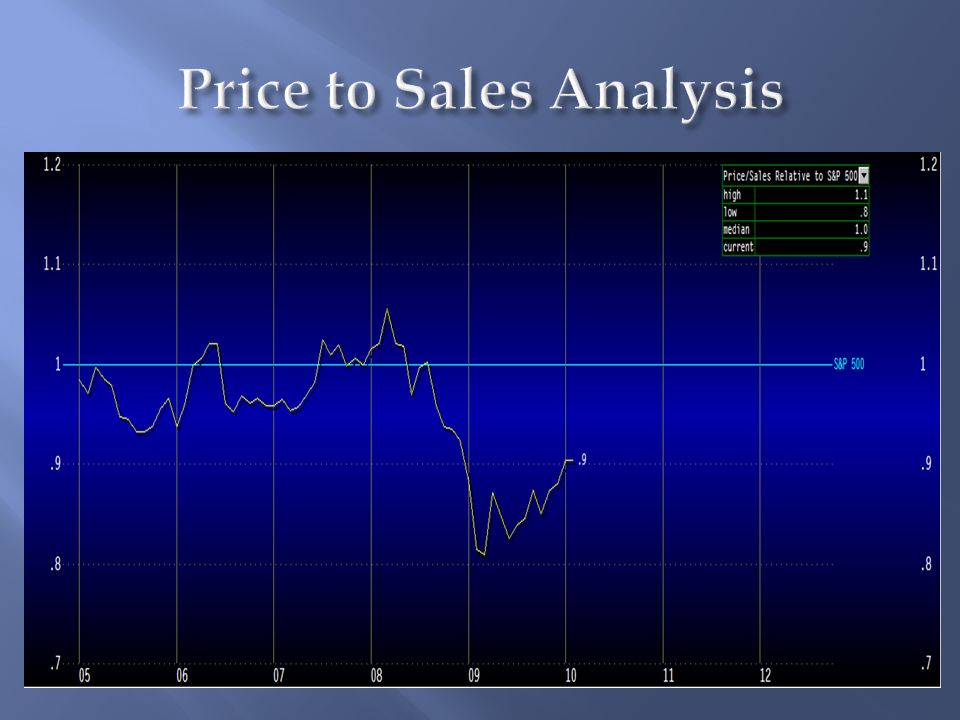
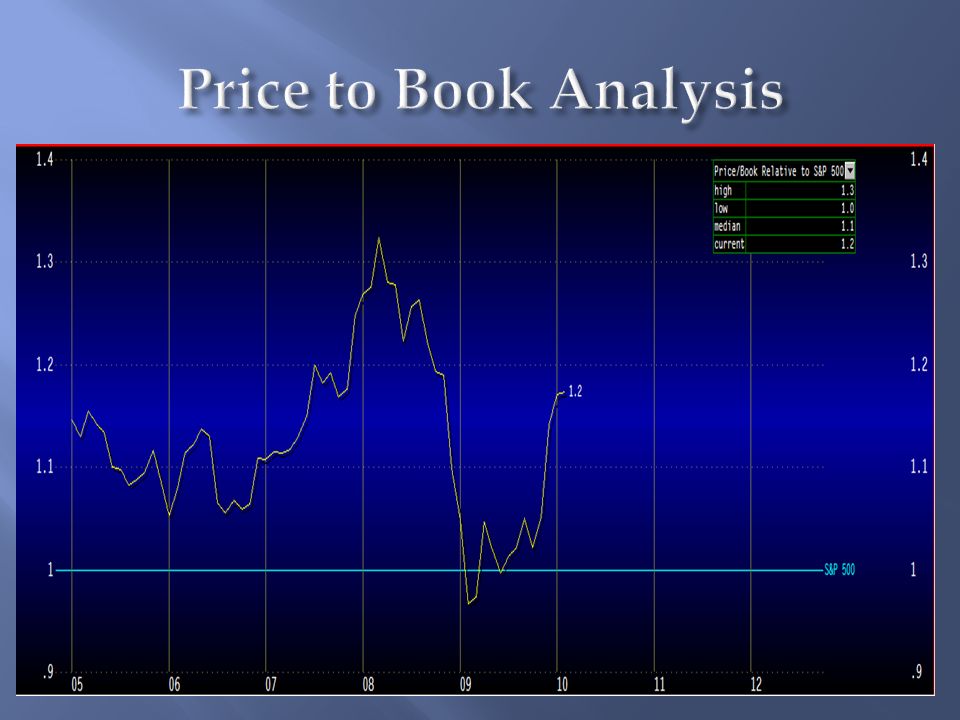
Absolute Basis HighLowMedianCurrent% Current to LT Median P/E 21.57.117.616.0-9.09% P/B 3.61.43.22.5-21.88% P/S 1.60.61.41.0-28.57% P/CF 12.76.011.29.8-12.5% Relative to SP500 HighLowMedianCurrent% Current to LT Median P/E 1.20.661.10.89-19.09% P/B 1.31.01.11.29.1% P/S 1.10.81.00.9-10% P/CF 1.20.81.11.0-9.1%

36
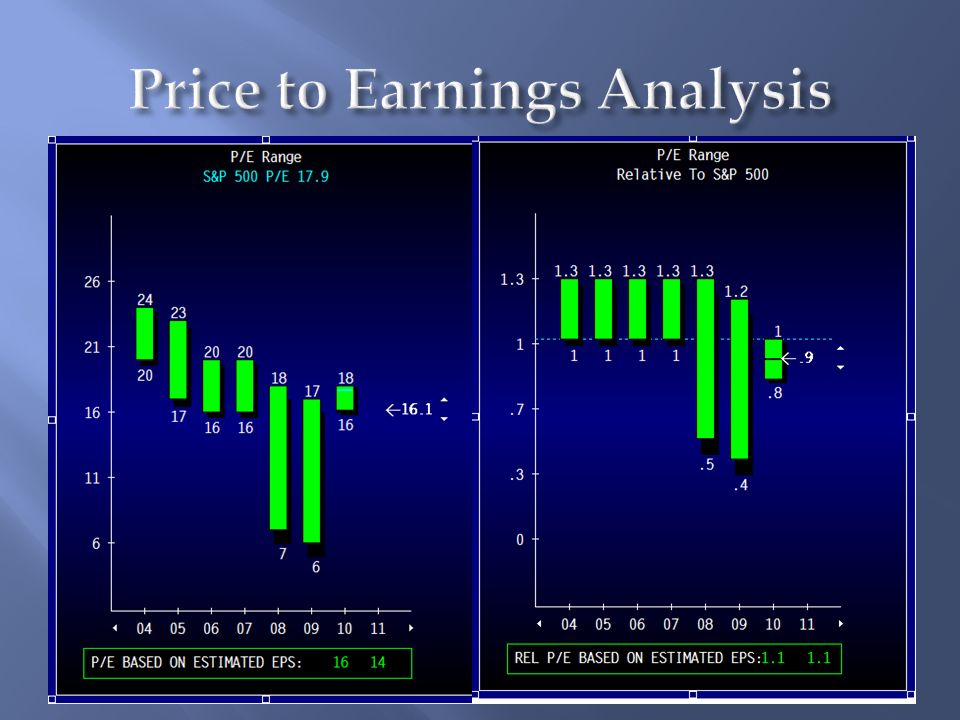
P/E Relative to S&P 500 High1.3 Low0.65 Median1.1 Current0.79

37
P/E Relative to S&P 500 High1.4 Low0.7 Median1.2 Current1.0

40
INDUSTRIALS SECTOR SHOULD ADD 15 BASIS POINTS TO BRING SECTOR TO 200 BASIS POINTS OVERWEIGHT Bears Slower than expected global growth Rising commodity prices Bulls FINANCIALS Sector ratios indicate that the sector is slightly undervalued ECONOMIC Improving global growth Unemployment rate improving Rising GDP data Favorable industrial spending

Similar presentations