Download presentation
Presentation is loading. Please wait.

1
Climate Change: The Move to Action (AOSS 480 // NRE 480) Richard B. Rood 734-647-3530 2525 Space Research Building (North Campus) rbrood@umich.edu http://aoss.engin.umich.edu/people/rbrood Winter 2010 April 13, 2010
 Winter 2010 April 13,")
2
Class News Ctools site: AOSS 480 001 W10AOSS 480 001 W10 On Line: 2008 Class2008 Class –Reference list from courseReference list from course Rood Blog Data Base

3
Projects Final presentation discussion; –April 22, 12:00 – 4:00, Place TBD. After class meetings –4/13: Transportation –4/15: Near-term solutions

4
Events Pollack and Rood, Author’s Forum –A World Without Ice: A Conversation with Henry Pollack & Richard Rood Wednesday, April 14, 2010 5:30PM Library Gallery, room 100, Harlan Hatcher Graduate Library –For more info visit www.lsa.umich.edu/huminwww.lsa.umich.edu/humin

5
Readings Stavins, R.N. A U.S. cap-and trade system to address global climate change. The Hamilton Project, 2007. (http://www.brookings.edu/papers/2007/10climat e_stavins.aspx)http://www.brookings.edu/papers/2007/10climat e_stavins.aspx Metcalf, G.E. A proposal for a U.S. carbon tax swap: an equitable tax reform to address global climate change. The Hamilton Project, 2007. (http://ase.tufts.edu/econ/events/specialEventsD ocs/metcalfCarbonTax.pdf)http://ase.tufts.edu/econ/events/specialEventsD ocs/metcalfCarbonTax.pdf
 e_stavins.aspx Metcalf, G.E. A proposal for a U.S. carbon tax swap: an equitable tax reform to address global climate change. The Hamilton Project, ( ocs/metcalfCarbonTax.pdf) ocs/metcalfCarbonTax.pdf.")
6
Introduced the idea of a market There is some acceptable level of pollution. There will be an “allowance” of the amount of pollution that can be emitted without penalty. Leads to a “cap.” –Auction –Given away If you use less than your allowance, you can trade it to someone who uses more.

7
Basics of the Market The expense of exceeding the cap will motivate reduction of pollution. –How can reduction be achieved? Companies with efficient methods will develop something they can trade. –What is the cost of to compare with?

8
Cap and Trade Mechanism Courtesy Justin Felt, Pointcarbon

9
Carbon Markets California Climate Change Regional Greenhouse Gas Initiative EU ETS (Carbon Market) Chicago Climate Exchange Pointcarbon World Bank State of the Carbon Market
 Chicago Climate Exchange Pointcarbon World Bank State of the Carbon Market")
10
Market-based Solutions Based upon success of the sulfur market. –Provides flexibility in meeting the goal of reduced sulfur emissions For large parts of the world, money and markets constitute the link between different elements of society, nations. –Infrastructure of developed society –Assumption that it is value based

11
Sulfur Market as a paradigm for CO 2 Market How is the same how is it different? This is very important!

12
Cost-effective regulation Context: SO 2 emissions (1980 baseline) –14.92 million tons of SO 2 –primarily from coal-fired electricity generation –acidification of lakes, rivers, and forests Acid Rain Program (1990) –1990 amendments to Clean Air Act –SO 2 allowance market The “Cap” –8.95 million tons per year of SO 2 …therefore, –5.97 million tons per year of SO 2 abatement
 –14.92 million tons of SO 2 –primarily from coal-fired electricity generation –acidification of lakes, rivers, and forests Acid Rain Program (1990) –1990 amendments to Clean Air Act –SO 2 allowance market The Cap –8.95 million tons per year of SO 2 …therefore, –5.97 million tons per year of SO 2 abatement")
13
Cost-effective regulation (cont.) “cost effectiveness”: what is the least-cost way of achieving a specific goal? Goal – “The Cap” – SO 2 emissions of 8.95 million tons per year Cost: SO 2 abatement cost –Aggregate cost: abatement cost summed over all electricity generators Policy tool – “Cap-and-trade” program – Theoretical finding: a market provides the incentive for companies to undertake least-cost abatement in the aggregate.

14
Cost-effective regulation (cont.) Estimates for the SO 2 market: Abatement cost without trading = $1.82 billion/yr Abatement cost with trading = $1.04 billion/yr (least-cost abatement) Cost savings = $0.78 billion/yr
 Estimates for the SO 2 market: Abatement cost without trading = $1.82 billion/yr Abatement cost with trading = $1.04 billion/yr (least-cost abatement) Cost savings = $0.78 billion/yr")
15
Cost-effective regulation (cont.) The “trade” in “cap and trade” is environmentally neutral –The cap remains fixed regardless of trading activity The cap is the intersection of science-based knowledge and the market
 The trade in cap and trade is environmentally neutral –The cap remains fixed regardless of trading activity The cap is the intersection of science-based knowledge and the market")
16
Company compliance decisions Context: SO 2 “allowances” –An allowance = 1 ton of SO 2 emission –Companies (electricity generators) are given a “quota” - - a fixed number of allowances each year Compliance options: –Without trading: Reduce SO 2 emissions to comply with their quota Install new abatement technology (SO 2 “scrubbers”) Use cleaner fuel sources (e.g., switch to low-sulfur coal) Produce less electricity (typically not considered!)
 are given a quota - - a fixed number of allowances each year Compliance options: –Without trading: Reduce SO 2 emissions to comply with their quota Install new abatement technology (SO 2 scrubbers ) Use cleaner fuel sources (e.g., switch to low-sulfur coal) Produce less electricity (typically not considered!)")
17
Marginal cost (MC) of abatement (cont.) (without trading) The area in red is the company’s total cost of abating to E 0. MC E $/E E0E0 MC @ E 0 0

18
Example Monroe Power Plant (Monroe, MI) –Owned by Detroit Edison –4 th largest coal-fired power plant in country 2004 data –95,364 allowances allocated –99,735 tons of emissions –4,371 tons in excess Purchased these on the market Or, banked them from a prior year
 –Owned by Detroit Edison –4 th largest coal-fired power plant in country 2004 data –95,364 allowances allocated –99,735 tons of emissions –4,371 tons in excess Purchased these on the market Or, banked them from a prior year")
19
Company compliance options (with trading as an option) Compliance options: –Without trading: Reduce SO 2 emissions to comply with their quota (scrubbers, low-sulfur coal) –With trading: Same options as above plus Purchase allowances at the market price (P)
 Compliance options: –Without trading: Reduce SO 2 emissions to comply with their quota (scrubbers, low-sulfur coal) –With trading: Same options as above plus Purchase allowances at the market price (P)")
20
Purchasing allowances as a compliance option At price P, the company purchases (E 0 – E * ) The area in red is the cost savings from purchasing allowances rather than undertaking abatement MC E $/E E0E0 P MC @ E 0 E*0
 The area in red is the cost savings from purchasing allowances rather than undertaking abatement MC E $/E E0E0 P E 0 E*0")
21
Cost-effective regulation (repeat) Estimates for the SO 2 market: Abatement cost without trading = $1.82 billion/yr Abatement cost with trading = $1.04 billion/yr (least-cost abatement) Cost savings = $0.78 billion/yr 43% reduction in abatement cost!!!
 Estimates for the SO 2 market: Abatement cost without trading = $1.82 billion/yr Abatement cost with trading = $1.04 billion/yr (least-cost abatement) Cost savings = $0.78 billion/yr 43% reduction in abatement cost!!!")
22
General results P < MC implies a buyer on the market –A buyer saves money by purchasing allowances to cover its emissions. P > MC implies a seller on the market –A seller makes money by undertaking extra abatement and selling its excess allowances. These incentives give rise to least-cost abatement. –We achieve cost-effective regulation The existence of this tension or balance between marginal cost and price of abatement implies that there is a market. There are options. –There is the requirement that The purchased allowance is a real reduction of sulfur That P (Price per share) comparable to Marginal Cost (of abatement).
 comparable to Marginal Cost (of abatement)..")
23
Some Specifics of Acid rain program and evidence on the SO 2 market

24
Phase I: 1995-1999 –110 dirtiest electric power plants –7-8.7 million allowances allocated per year Phase II: 2000-2010 –All fossil-fueled electric power plants –9.2-10 million allowances allocated per year After 2010: 8.95 million allowances/year Banking of allowances permitted The Acid Rain Program

25
Trends in Wet Sulfate Deposition in the Eastern United States (1989-1991 vs. 1995-1998)
")
26
CA Electricity Crisis 9/11/01

27
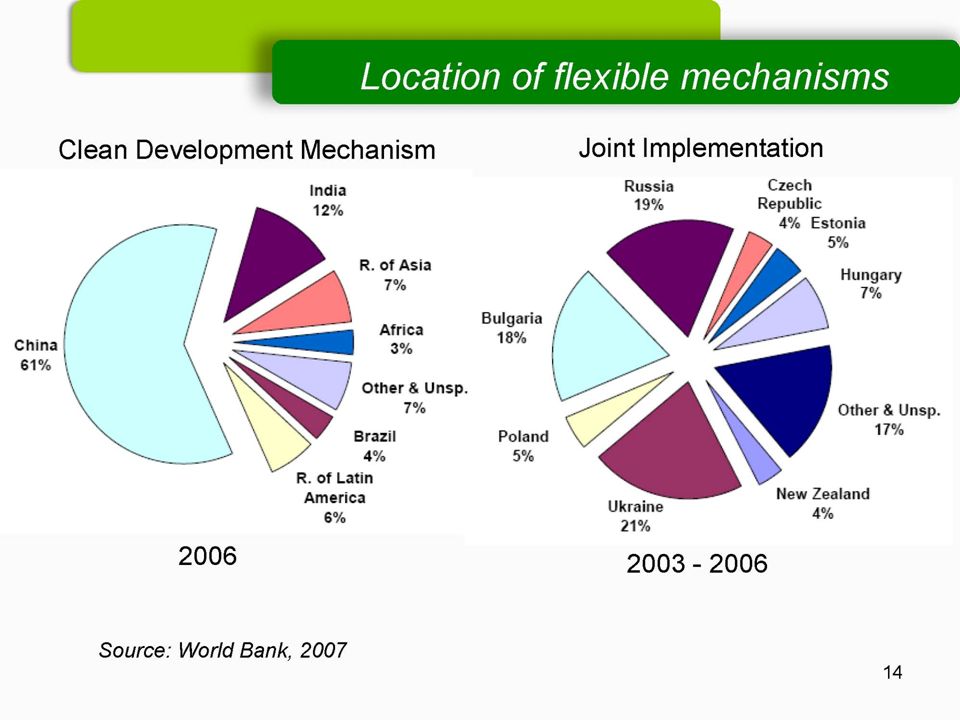
CO 2 markets to implement climate policy Kyoto Protocol (1997) –Participating nations: ~ 7-8% below 1990 emissions –European Union’s CO 2 market most advanced –Expansion to all participating nations Kyoto’s Flexibility Mechanisms –Emissions Trading System (ETS) Can comply by purchasing CO 2 credits from the ETS market –Joint Implementation (JI) Can comply by purchasing CO 2 credits from an entity in an industrialized country –Clean Development Mechanism (CDM) Can comply by purchasing CO 2 credits from an entity in a developing country
 –Participating nations: ~ 7-8% below 1990 emissions –European Union’s CO 2 market most advanced –Expansion to all participating nations Kyoto’s Flexibility Mechanisms –Emissions Trading System (ETS) Can comply by purchasing CO 2 credits from the ETS market –Joint Implementation (JI) Can comply by purchasing CO 2 credits from an entity in an industrialized country –Clean Development Mechanism (CDM) Can comply by purchasing CO 2 credits from an entity in a developing country")
28
EU Market

30
Miscellaneous issue: emission tax vs. cap-and-trade Regulated firms strongly prefer cap-and-trade –quota distributed for free – enormous $$ value! –compare to: tax per unit of emissions Monroe power plant example –95,364 SO 2 allowances allocated for free in 1994 –All allowances were used to cover emissions –What if taxed at $200/ton? 95,365 * 200 = $19,073,000

31
Emission tax vs. cap-and-trade (cont.) The regulator likes the certainty of the cap; tax has an uncertain effect on aggregate emissions –Environmentalists probably like this certainty, too Example: volatile SO 2 prices, yet certain cap.
 The regulator likes the certainty of the cap; tax has an uncertain effect on aggregate emissions –Environmentalists probably like this certainty, too Example: volatile SO 2 prices, yet certain cap..")
32
Emission tax vs. cap-and-trade (cont.) What politician will support a tax program? –Clinton/Gore’s failed BTU tax, early in 1 st term Cap-and-trade has been the “consensus” strategy –But is there any reason to expect it can reduce carbon dioxide? –What is its political viability? –Business support US Climate Action PartnershipClimate Action Partnership

33
Cap and Trade Viability Jim Hansen talk … market and banking too open to gaming and corruption. No value added. –Already past the amount for dangerous climate change. Rood and Thoumi that the carbon market and the science don’t line up.Rood and Thoumi Financial Interests of Advocates.

34
Even newer news Senators Ditching Cap and Trade Senators Propose to Abandon Cap and TradeSenators Propose to Abandon Cap and Trade

35
Conclude: Political economy of cap-and-trade programs Environmentalist perspective –Set the cap as low as politically feasible Business perspective –Maintain flexibility in compliance options –Cap and trade is most flexible Regulator perspective –Buy-in from stakeholders Good for environment and cost effective –Enforceable Many environmental organizations are now advocates for cap-and-trade programs

36
Further Reading Tom Tietenberg, Environmental and Natural Resource Economics, 7 th Edition, 2006. –It includes several chapters on environmental regulation—both principles and applications. Ellerman, Joskow, Schmalensee, Montero, and Bailey, Markets for Clean Air: The U.S. Acid Rain Program, 2000. –An exhaustive evaluation of the acid rain program and SO 2 market by a team of great economists.

37
Some Market Issues How do we make a carbon market? What is the role of allowances? –Savings relative to what baseline? Cost of allowance relative to other choices?

38
Elements of environmental pollutant market ENERGY PRODUCTION FUEL SOURCES ABATEMENT SHARES OF POLLUTANT CREDITS F1cF1c F2cF2c FicFic F1AF1A F2AF2A FiAFiA A1A1 A2A2 AiAi GDP. POLLUTANT efficiency COST GAP Common Unit of Transference Cost $

39
What about the carbon market Basics of a market This is once again a place where the idea that there is a system “in balance.” And that small changes from the balance are important. In the presence of small changes, perhaps the system is self regulating.

40
Elements of environmental pollutant market ENERGY PRODUCTION FUEL SOURCES ABATEMENT SHARES OF POLLUTANT CREDITS F1cF1c F2cF2c FicFic F1AF1A F2AF2A FiAFiA A1A1 A2A2 AiAi GDP. POLLUTANT efficiency COST GAP

41
Let’s Think about the Market First, to be clear, this is another version of the continuity equation. PRODUCTION LOSS

42
PRODUCTION For our problem: –Production comes from burning fossil fuels. –Here are the ways to reduce production Use less energy Consume less stuff Shrink the economy Find fuels that don’t emit carbon dioxide –Don’t increase other greenhouse gases exponentially!

43
Production The real way to address the climate change problem in the short term is to reduce production of carbon dioxide, and the real way to do that is to consume less, –which will shrink the economy.

44
Production To maintain the growth of the economy and to address the climate change problem must de-correlate energy consumption from carbon dioxide emission. –This leads to alternative sources of energy.

45
Alternative energy According the Nathan Lewis, in the long-term there are three known sources of adequate energy for, say, more than a century or two.Nathan Lewis –Nuclear energy with breeder reactors –Solar energy, but requires new technology for efficiency and storage –Coal with sequestration Other alternative energy, while important, do not scale with population and economic growth. Technology, exploration, and discovery and development of new energy sources

46
Current alternative energy With the presumption that cost of alternative energy needs to be comparable with fossil fuel sources there needs to be some way to bridge the cost gap. Personal analysis: fee or tax policy seems reasonable to bridge this gap. –Short term, and would help to develop a market. COST GAP

47
Production In the near term, by far the most effective way we have to reduce production of carbon dioxide is efficiency. –And this makes economic sense.

48
Efficiency But at this moment we have no way to really give valuation to efficiency. –Hence, historically, efficiency is often met with increased consumption. How can this be changed? –Cost of energy is high enough that it demands reduction –Efficiency is given valuation by market or policy (fee and tax?) Scale to help bridge the fuel cost gap? –Other? efficiency United Nations Foundation: Realizing Potential of Energy Efficiency
 Scale to help bridge the fuel cost gap. –Other. efficiency United Nations Foundation: Realizing Potential of Energy Efficiency.")
49
McKinsey 2007: Large

50
Elements of environmental pollutant market ENERGY PRODUCTION FUEL SOURCES ABATEMENT SHARES OF POLLUTANT CREDITS F1cF1c F2cF2c FicFic F1AF1A F2AF2A FiAFiA A1A1 A2A2 AiAi GDP. POLLUTANT efficiency COST GAP

51
Abatement What are the forms of abatement?

52
The abatement that we talk about Terrestrial sink? –This is fragile, limited, and there is growing evidence that it does not “grow” to address the problem. That is “carbon fertilization” is less effective than posed. Oceanic sink? –Evidence of ocean “taking up less.” –Other environmental impacts

53
General form of balanced system GOOD BAD Temperature (other environmental parameter)
")
54
Abatement What are the forms of abatement? Sequestration to keep carbon dioxide out of the atmosphere. Some engineered way to remove carbon dioxide from the atmosphere. –Think about the energy of this requires something “biological” to use the Sun.?

55
Abatement We don’t really have enough abatement options to make a market.

56
Does a market do anything for CO2 Evidence to date –EU: Some accounting of reduction –Motivate interest in mitigation –Is it the way to get us started –Billions of dollars tied up

57
Granularity

58
Energy-Economy-Climate Change ENERGYECONOMY CLIMATE CHANGE THESE THREE ARE BIG WHAT ARE THEIR ATTRIBUTES? ______________________________ HOW ARE THEY RELATED? ______________________________

59
A moment with time scales 25 years 50 years75 years100 years0 years ENERGY ECONOMY CLIMATE CHANGE

60
We keep arriving at levels of granularity TEMPORAL NEAR-TERMLONG-TERM SPATIAL LOCAL GLOBAL WEALTH Small scales inform large scales. Large scales inform small scales.

Similar presentations


 Rationale and Lessons learnt Artur Runge-Metzger Head of International Climate Negotiations, European Commission.>")


, 1967-present, www.edf.org Full-time staff, 1967: 0 2008: 325 Members, 1967: 0 2008: 500,000 Offices, 1967:>")

 NO 2 (nitrogen dioxide) and H 2 O (water)>")
