Download presentation
Presentation is loading. Please wait.

1
Class Project Report Sustainable Air Quality, EECE 449/549, Spring 2008 Washington University, St. Louis, MO The Carbon Footprint of Danforth Campus and its Causality Drivers Instructors: Professor Rudolf B. Husar, Erin M. Robinson See also a 5 min screencast and more details on the class wikiscreencastclass wiki Students: Devki Desai Martin Groenewegen Tyler Nading Kate Nelson Matt Sculnick Alyssa Smith Varun Yadav

2
Main Components of WU Carbon Emissions: On Campus Energy Use in Buildings and Transportation The impact on carbon arises from on-campus energy use and from transportation On Campus Energy Use Carbon Impact Students Heating Cooling Appliances Faculty/Staff Transportation Carbon Impact Commuting Air Travel University Fleet

3
Transportation Devki Desai Tyler Nading Varun Yadav

4
Washington University Transportation Emission Commuter Travel –Faculty/Staff –Students University Fleet Air Travel –Athletic Meets –Study Abroad –Faculty Air Travels

5
Annual Commuter Emission Calculation Factors effecting the emission: –# of people commuting to WashU –miles driven per year –gallons of fuel required –amount of Carbon or Carbon Dioxide produced by the fuel milesgallons 2,421 grams of Carbon/Gallon as given by the Code of Federal Regulations (40 CFR 600.113) 0.99 % fuel oxidized 12 gm C 44 gm CO 2 mileyear Emissions X = XXXX # people
 0.99 % fuel oxidized 12 gm C 44 gm CO 2 mileyear Emissions X = XXXX # people")
6
Data Collected Student Parking Permit Data: Only 2007-08. Student Local Address Data Student Home Address Data Faculty/Staff Parking Permit Data: Only 2007-08. Faculty/Staff Local Address Zip code: Only 2007-08.

7
Issues with Data Some students provide their permanent home address zip code instead of local address zip code Each year over 3000-4000 students do not provide zip code. Historic faculty/staff local zip code not available. Historic parking permit data not available.

8
Distance within 150 miles to WashU considered for analysis. 2007-08 Data on Google Earth

9
Distance Calculation Zip code converted to latitude and longitude based on U.S. Gazetteer and zipinfo.U.S. Gazetteer zipinfo For WashU, coordinates of Brookings Hall (38.648N, 90.305W) considered. Distance from zip code coordinates to WashU coordinates calculated using the reference formula:reference formula –Δx = 69.1*(lat1-lat2); Δy = 53.0*(lon1-lon2), –Distance (in miles) = (Δx 2 +Δy 2 ) 1/2. Calculates straight line distance between WashU and centroid of zip code
 considered. Distance from zip code coordinates to WashU coordinates calculated using the reference formula:reference formula –Δx = 69.1*(lat1-lat2); Δy = 53.0*(lon1-lon2), –Distance (in miles) = (Δx 2 +Δy 2 ) 1/2. Calculates straight line distance between WashU and centroid of zip code.")
10
Fudge factors required for calculated distance –Highways and road directions –Bridges on East and North St. Louis 18% for Students 40% for Faculty/Staff

11
Annual Distance Traveled Assume every person makes 1 round trip (2 trips) to school per working day of the year Faculty/Staff - 225 working days per year Students - 165 working days (excluding vacations)
 to school per working day of the year Faculty/Staff working days per year Students working days (excluding vacations)")
12
Faculty Commuter Contribution

13
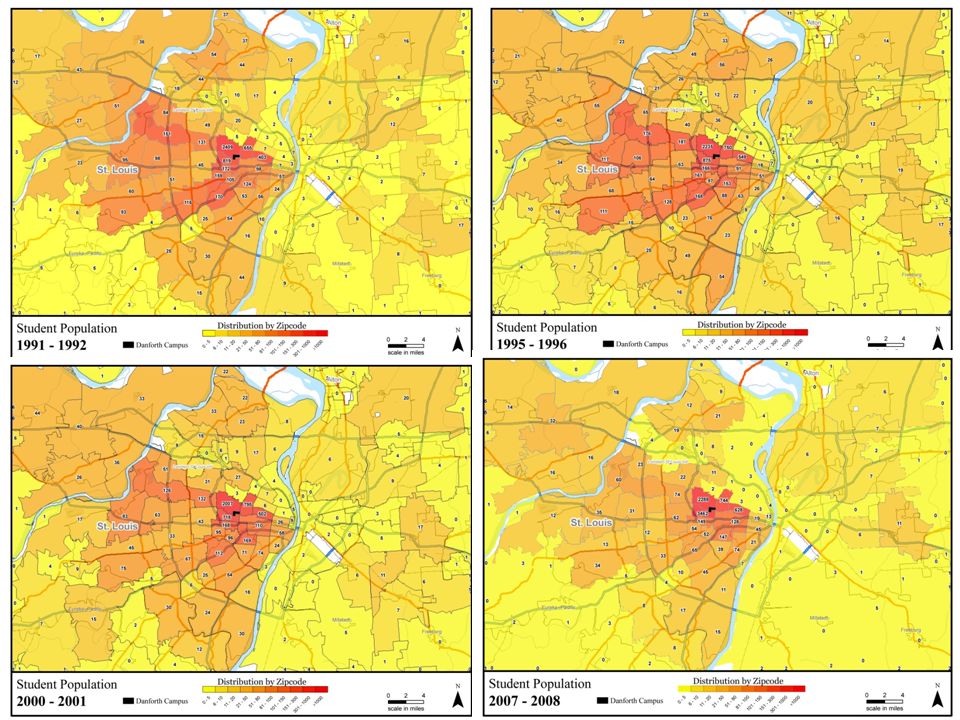
The number of students living within 150 miles of the Danforth Campus have not lead to an increase in the amount of parking permits issued as our data implied. Student Commuters

16
1991-92 1995-96 2000-2001 2007-08 Annual miles driven per student decreased most dramatically from 2002- 2007. This is explained in part by the shift in student residences from 2001- 2007.

17
Student Commuter Carbon Emissions

19
University Fleet Contribution The University fleet grew and contribution steadily increased despite improvements in fuel economy, yet is minimal in comparison to student commuter carbon emissions.

20
Air Travel Emissions General areas of air travel –Faculty –Study abroad –Athletics Methodology –Faculty air travel not considered –Study abroad data was provided for the past 6 years –Athletic air travel data provided for the past 3 years

21
Air travel emissions have increased by 30%

22
Study abroad emissions are the driver in this study

23
Washington University Transportation Emission

24
On Campus Energy Use Kate Nelson Alyssa Smith

25
Building Use by Category Instruction and Departmental Research Organized Research Other

26
1990 vs. 2006 Main Campus Site Map

27
Area Growth through Buildings Instruction and Departmental Research: 1% Organized Research: -40% Other: 43% Total: 35%

28
Monthly Total Electricity Use Monthly data for Danforth campus electricity use Data for 1996-2000 is incomplete and not shown above

29
Seasonal Electricity Use Electricity use peaks in the summer

30
Electricity Yearly Increase Baseline electricity use has increased ~60% since 1990 Cooling electricity use has increased ~40% since 1990 60%40%

31
Electricity Use Compared to Building Area Electricity used per unit area for cooling has not increased significantly Baseline electricity use has increased 15% more than building area Increase in baseline electricity use per unit area due to increased computer and electronics use

32
Electricity Use Distribution Electronic devices account for ~25% of 2007 electricity use Lighting and electronics account for a large portion of electricity use and reductions can easily be made in this area Reductions in cooling are more difficult to implement

33
Monthly Total Fuel Use Monthly natural gas use on Danforth campus from 1997 to 2007

34
Seasonal Fuel Use Fuel use peaks in the winter

35
Fuel Yearly Increase Baseline fuel use has increased ~65% since 1997 Heating fuel use has decreased ~10% since 1997 65% -10%

36
Fuel Use Compared to Building Area Fuel used per unit area for heating has decreased, ~30% less fuel is used per unit area Baseline fuel use has increased 25% more than building area

37
Fuel Use Distribution Residential area built in 2001Hot water heating requirements can easily be reduced Heating needs are major use of fuel and not easily reduced

38
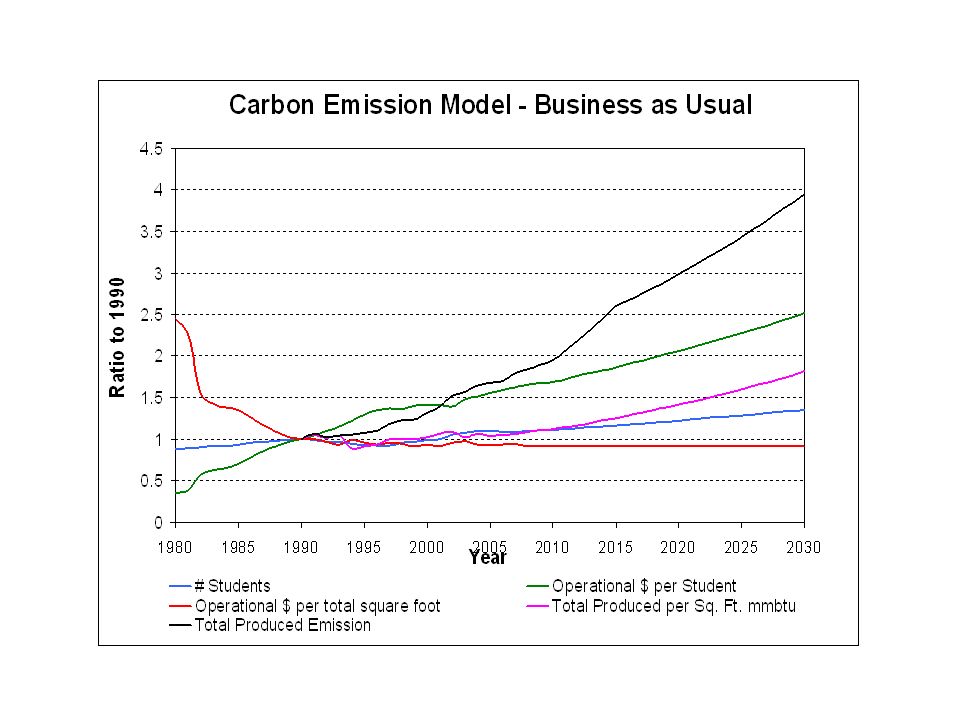
Linear Causality Model for Campus Carbon Emissions The carbon impact of on-campus energy is due to direct fuel consumption and indirectly from electricity use The overall carbon impact for on campus energy consumption has increased 50% from 1990-2007 Electricity use contributed about 80 percent to the on-campus carbon impact Population Students Activities $ Expend./yr Buildings Sq. Ft Fuel Cons. BTU/yr C Emission Ton C/yr Fuel Cons. BTU/yr C Emission Ton C/yr Electr. Cons Kw-Hr/yr $/StudentSq. Ft./$BTU/Sq.Ft. Kw-hr/Sq.Ft. BTU/Kw-hr Carbon/BTU

39
The student population increased only by 10% since 1990 However, the expenditures/student have increased by 60 percent The buildings/expenditure has barely changed and the increased expenditures were matched by 60% growth in campus building area Neither the energy use/sq ft nor the C emission/energy use has changed much Hence, the key driver for the 60% carbon emission growth were the increased expenditures (prosperity) and the associated growth in the physical campus expansion.
 and the associated growth in the physical campus expansion.")
40
WU Comparison with Other Universities Martin Groenewegen Tyler Nading

41
What is in this analysis: Carbon assessments from other schools Use to make sense of WU's report Different data –Purchased electricity –Stationery sources (labs, steam generation, etc) –Transportation (University fleet, Commuting students, Commuting Faculty and Staff) –Ag Wastes –Solid Wastes
 –Transportation (University fleet, Commuting students, Commuting Faculty and Staff) –Ag Wastes –Solid Wastes")
42
Colleges and Universities Carleton College Harvard Tufts University University of New Hampshire Smith College Lewis and Clark Middlebury College University of Central Florida Penn State University Park Tulane University Utah State University Oberlin College Duke University University of Pennsylvania Colby College Wellesley College Rice University University of Illinois at Chicago Penn State College of Charleston Yale University of California, Santa Barbara California State Polytechnic University University of Connecticut University of California, Berkeley Amherst College College of William and Mary UT, Knoxville Connecticut College Occidental College Colorado State University

43
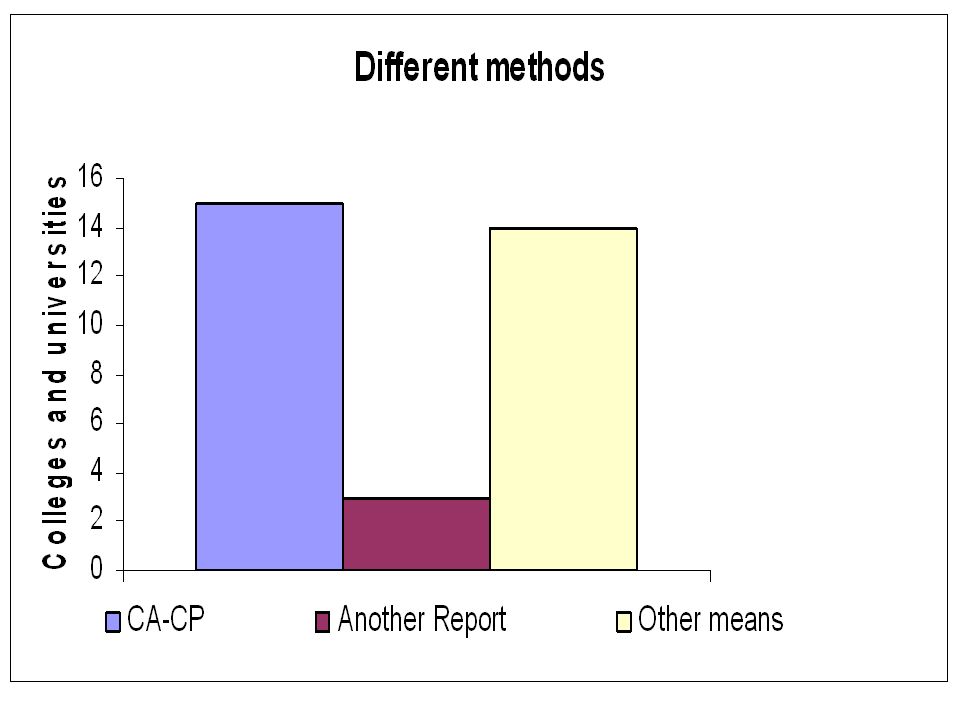
Why analyze the others Determining scope of emission Finding new ways to handle a lack of data/estimations with limited details Method validation Structuring of the Wash U report

45
PE=purchased electricity Tr-UF=Transportation University Fleet Re=Refrigerants ST=Stationery sources Tr-CSF=Transportation Commuting Fac. Staff Tr-CSt=Transportation Commuting Students Tr-A=Transportation Air Ag=Agriculture Wastes SW=Solid Wastes

46
Wash U Duke

47
And the Study Shows: Wash U is average Overall correlation between size and emission Some out liars do exist Improvements Do this study for a longer period of time using interim reports Check the units Comprise more comparisons for the given student body populations

48
Analysis of Transportation Sector From Other Schools’ Inventories Purpose –Examine methodology used by other schools to account for transportation emissions –Determine trends/drivers for transportation emissions –Use findings as measuring stick for WU Methodology observed Error observed

50
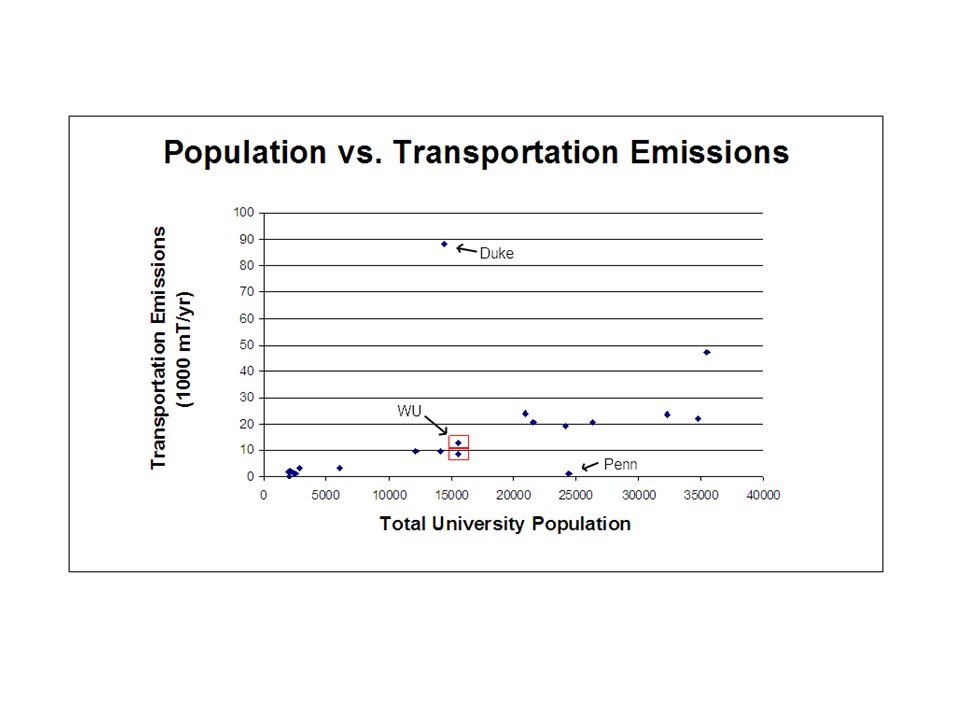
Linear trend observed Variance observed and expected Duke and Penn outliers

51
Population is a definite driver of transportation emissions

52
WU and the Chicago Climate Exchange Matt Sculnick

53
Pollution Prevention There are 2 main types of pollution prevention methods: Cap-and- Trade and BACT The Best Available Technology Method requires certain pollution control methods to be put in place at specific facilities There are different requirements for both new and existing sources; the new generally being stricter Cap-and-Trade systems require that each facility only emit a certain amount a certain pollution (by weight) and if they come in under they are allowed to sell their remaining permits This requires specific monitoring in order to verify the pollution levels
 and if they come in under they are allowed to sell their remaining permits This requires specific monitoring in order to verify the pollution levels")
54
Chicago Climate Exchange The CCX was founded in 2003 and is the only trading platform of its kind in North America All members of the exchange, currently approximately 350, agree to certain CO2 reductions each year The members join voluntarily, but the reductions which they agree to are legally binding The Chicago Climate Exchange (CCX) has three component parts: The CCX Registry, The CCX Trading Platform, and The Clearing Settlement Platform; which provide real-time information to the traders There are two different kinds of members: Phase I and Phase II, which joined the exchange in 2003 and 2007 respectively Both types of members have agreed to overall reductions of 6% of their baseline by 2010
 has three component parts: The CCX Registry, The CCX Trading Platform, and The Clearing Settlement Platform; which provide real-time information to the traders There are two different kinds of members: Phase I and Phase II, which joined the exchange in 2003 and 2007 respectively Both types of members have agreed to overall reductions of 6% of their baseline by 2010")
55
Trading on the Exchange Members on the exchange are trading CCX Carbon Financial Instruments (CFI) Contracts which correspond to 100 metric tons of CO2 emissions The contracts that are being traded also correspond to the specific year in which they were issued and when companies fail to meet their reductions they purchase contracts from that year In addition to companies trading contracts which the receive for any reductions below their specified levels, they also may receive reductions for any offset projects which they are able to complete and have verified by a third party There are standardized rules set out by the exchange which define how CFI contracts are issued for Agricultural methane, Coal mine methane, Landfill methane, Agricultural soil carbon, Rangeland soil carbon management, Forestry, Renewable energy, and depleting substance destruction. These projects must also go through a 4 set verification procedure.

56
University Involvement There are 8 current University members of the Chicago Climate Exchange Tufts has been a member of the exchange since 2003 and the others have subsequently joined later as Phase II members

57
Actual vs. Allowed CO2 Emissions Differential between actual emissions and allowed emissions not only is positive, but is actually increasing every year

58
CCX CFI Contracts Purchased Per Year In each year the number or CCX CFI contracts that would need to be purchased by the University in order to overcome its pollution is increasing

59
Excess Polluting Costs to the University As a Phase I member of the exchange the University would have contracted total costs of $20,816 As a point of reference it would cost $150,000 to buy all of the contracts on the European Climate Exchange

60
Working Toward a Transition to Sustainability Alyssa Smith

61
Working Toward a Sustainable Carbon Footprint What is to be sustained? What is to be developed? The links between the entities to be sustained and the entities to be developed The extent of the future

63
Sustainable Transition Sustained –Energy Development of efficient harnessing of non-polluting energy, reduction in energy loss due to transmission –Water Harvesting rain water, water treatment, recycling –Material Recycling –Construction energy efficient buildings and upgrade of old building –Transportation Development of high performance engines using renewable energy, converting to energy efficient vehicles Developed –Campaigns directed towards reduction of energy demand –Programs for water conservation, reuse, and recycling –Raise awareness of waste reduction and recycling programs –Promote consumption of organic and local food products –Encouraging use of public and non- polluting modes of transportation –Organization of social events to raise environmental awareness

64
Reporting the Transition Transportation Indicators: Building Indicators:

65
Exploring the Future Trial and error process Must consider –scientific credibility –political legitimacy –practical utility –effectiveness of the system on trial Regional Information Systems (RIS) are often used Analysis of the future is a prediction, not factual
 are often used Analysis of the future is a prediction, not factual")
67
Carbon Emission Model: Neutral Case

69
Energy Alternatives Coal: –68,000 metric tons Wind: –56 turbines, diameter 71 m Solar: –PV Panel Area: 556,000 sq m Hydro: –Dam = 64 ft

70
Wash U.'s goals are to address the issues of environment, energy and sustainability through education, research and out reach projects. More over, Wash U. will seek and define its best operation practices, and aspire to be a model of energy conservation for other institutions. - Mark S Wrighton, Chancellor EES, WashU

71
Links to Class Wiki and Documents Class Project: Carbon Footprint of Danforth Campus –On Campus Energy UseOn Campus Energy Use –TransportationTransportation –Other University ComparisonOther University Comparison –Washington University and the Chicago Climate ExchangeWashington University and the Chicago Climate Exchange –Working Toward a Sustainable TransitionWorking Toward a Sustainable Transition Related Links –Clean Air/Cool PlanetClean Air/Cool Planet –Other University InventoriesOther University Inventories –National Academy of Science Report: Our Common JourneyNational Academy of Science Report: Our Common Journey –All class contributed linksAll class contributed links

Similar presentations


>")


