Download presentation
Presentation is loading. Please wait.

1
Dale Jorgenson, Mun Ho, Jon Samuels
Measuring Labor Input Dale Jorgenson, Mun Ho, Jon Samuels Harvard University World KLEMS Conference, Harvard University August 19, 2010

2
Topics Measurement Issues and Methodology Data and Implementation
Results Contribution of labor input to productivity revival Criticisms of this method

3
Information Technology and the American Growth Resurgence
Jorgenson, Ho and Stiroh (2005); Chapter 6 New Data on U.S. Productivity Growth by Industry Jorgenson, Ho and Samuels (2010)
; Chapter 6. New Data on U.S. Productivity Growth by Industry. Jorgenson, Ho and Samuels (2010)")
4
Issues in Measuring Labor Input
Number of workers, or Hours worked, are not suitable units of measure for heterogenous labor Wide range of market wages indicate wide range of productivities A wage-weighted index have been growing faster than simple sum of hours, productivity residual using hours will overstate the growth of TFP. Need tractable method of handling this great heterogeneity

6
Methodology for a tractable measure of labor input
Cross classify workers in each industry by demographic characteristics * In Jorgenson, Gollop & Fraumeni (1987): sex, class, age, education, occupation * Now: sex, class, age, education -Define industry labor input as a Tornqvist index of the demographic components
: sex, class, age, education, occupation. * Now: sex, class, age, education. -Define industry labor input as a Tornqvist index of the demographic components.")
7
Classification of demographic groups for each industry
2x2x7x6 = 168

8
Index of labor input for industry j, Ljt as Tornqvist index of components
scae: sex, class, age, education j: industry j or aggregate economy

9
Index Ljt, cont. Constant Quality Index
Assume labor input is proportional to hours worked: Qscae is the quality of hours of group scae, fixed for all t. Thus input index becomes: Compared to simple hours:

10
Index Ljt, cont. Price of industry labor input is simply value/Lj
after choosing a normalization like: Quality of industry labor input is labor input index divided by hours worked:

11
Decomposing the labor input index
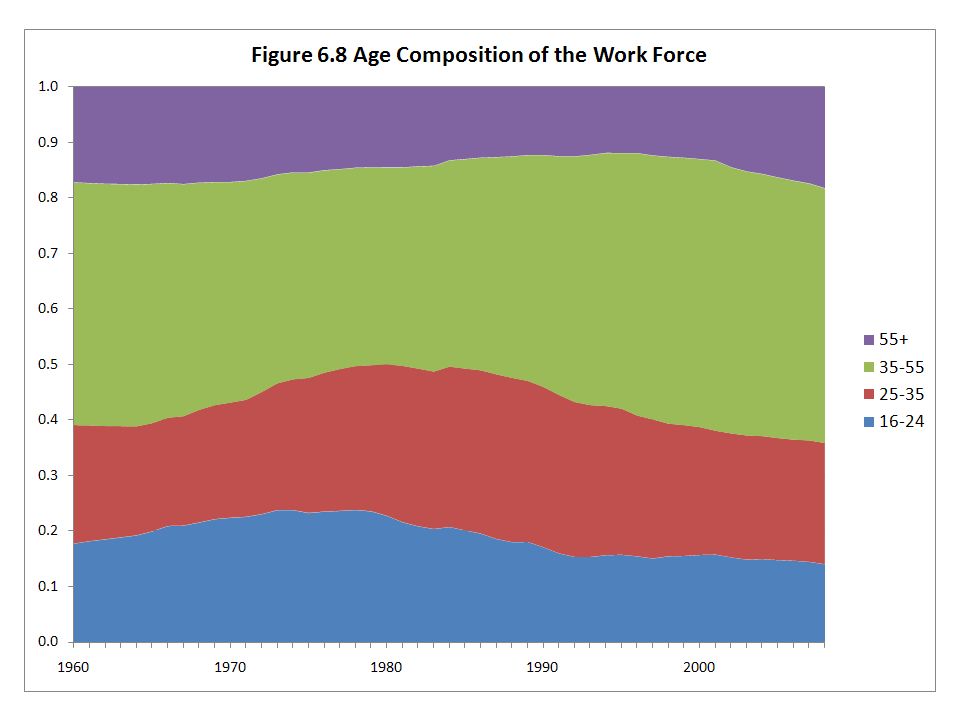
How much of the quality change is due to changes ..in educational attainment? ..in the aging of the labor force? … Partial indices of labor input. E.g. first-order index by age Contribution of age to labor quality

12
Data Need number of workers, hours and compensation to fill matrices of dimension (2sex, 2 class, 7age, 6educ, 70indus). Total of cells. Household survey data (hours/week, weeks/year, wages/year, demographics, industry) Census of Population. - every 10 years - 1% percent sample (1 million workers) Current Population Survey, Annual Supplement (ASEC) - every year, 1964+ - about 100,000 households Establishment survey data Bureau of Economic Analysis tabulations of total employment, total compensation, wages for 72 industries; annual hours for 18 industries
 Census of Population. - every 10 years. - 1% percent sample (1 million workers) Current Population Survey, Annual Supplement (ASEC) - every year, about 100,000 households. Establishment survey data. Bureau of Economic Analysis tabulations of total employment, total compensation, wages for 72 industries; annual hours for 18 industries.")
13
Implementation -Begin with Census microdata (1% sample, ~1 mil. workers) to populate EMP, HOURS, COMP matrices for benchmark years -From CPS annual microdata, construct marginal matrices: EMP, HOURS, COMP matrices of lower dimension (e.g. indus x edu, sex x age x edu, …) -Interpolate between benchmark years using these annual marginal matrices -Scale to industry totals in the National Accounts
 -Interpolate between benchmark years using these annual marginal matrices. -Scale to industry totals in the National Accounts.")
14
Data Issues -Change from SIC to NAICS classification
(CPS and Census 2000 uses NAICS) -Change in education classification in 1992 -Small sample size in CPS (use fewer industries) -Household data is “top-coded” for wages Workers in multiple jobs (multiple industries) Estimating wages for self employed No data on fringe (non-wage) benefits by person
 -Change in education classification in Small sample size in CPS (use fewer industries) -Household data is top-coded for wages. Workers in multiple jobs (multiple industries) Estimating wages for self employed. No data on fringe (non-wage) benefits by person.")
25
December 23, 2000 issue

27
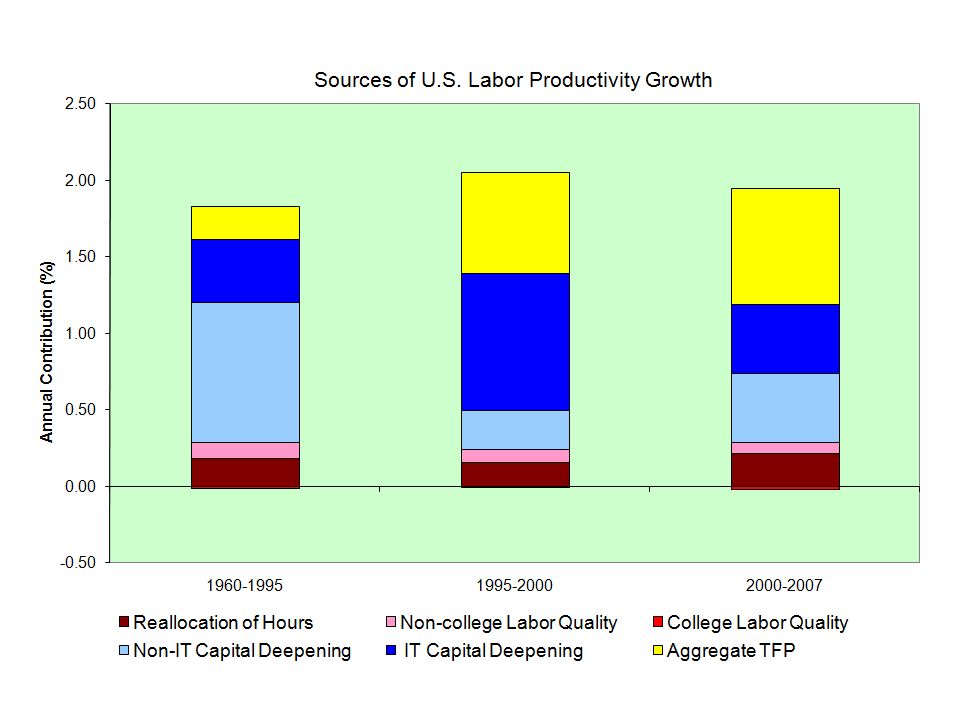
Labor Contributions to Aggregate Growth

31
Criticisms of this methodology
Equation of wages with marginal product is not valid with non-competitive markets and discrimination Small sample sizes for many industries give poor estimates of cell averages Education is not directly productive and merely a “signal” Intensity of work effort is not recognized

32
Summary Simple sum of hours understate labor contribution, overstate TFP growth Our labor input index – an aggregate over hours by demographic groups, weighted by wages – is a tractable measure with the use of U.S. Census microdata. The growth of labor quality was about 0.4% per year, or, ¼ of the labor contribution to GDP growth is due to labor quality and ¾ due to hours growth.

Similar presentations


 Gaaitzen J. de Vries GGDC and Faculty of Economics.>")


