Download presentation
Presentation is loading. Please wait.

1
Hypoxia in Lake Erie’s Central Basin: How Annual Variation In Temperature, Dissolved Oxygen Affect Fishes Paul J Hurtado (MBI; OSU), Yuan Lou (OSU), Elizabeth Marschall (OSU), Kevin Pangle (CMU) & Stuart Ludsin (OSU)
, Yuan Lou (OSU), Elizabeth Marschall (OSU), Kevin Pangle (CMU) & Stuart Ludsin (OSU)")
2
Population Density 2005 Gridded Population of the World, v3 (http://beta.sedac.ciesin.columbia.edu/data/collection/gpw-v3)

3
Based on Hadley Centre HadCM3 climate model http://www.globalwarmingart.com/wiki/File:Global_Warming_Predictions_Map_jpg

4
Diaz and Rosenberg (2008) Science Warming Hypoxia Global phenomenon: 400+ marine systems & large inland lakes Hypoxia
 Science Warming Hypoxia Global phenomenon: 400+ marine systems & large inland lakes Hypoxia")
5
–Direct mortality Higher for sessile benthic organisms than mobile organisms Mobile pelagic species can be susceptible –Sub-lethal effects → more likely for mobile species Caused by reduced access to optimal temperature, prey or refugia Atlantic Menhaden (Narragansett Bay) (www.geo.brown.edu) Gulf Menhaden (N. Gulf of Mexico) (www.leeric.lsu.edu) An “island” of dead menhaden Hypoxia effects on fish?
 ( An island of dead menhaden Hypoxia effects on fish .")
6
Small Volume = 484 km 3 Shallow Depth = 24 - 60m Warm > 200 Frost Free Days Productive All Trophic Levels

7
Lake Erie hypoxia Canada USA Temperature Productivity HighLow Warm epilimnion West Central East Cool Low oxygen Cool hypolimnion (becomes hypoxic)
")
8
Bottom hypoxia is typically also augmented by eutrophication… Nutrients (N, P) Phytoplankton Bacteria Hypoxia Excess Nutrients Hypoxia
 Phytoplankton Bacteria Hypoxia Excess Nutrients Hypoxia")
12
Max. Hypoxic (< 2 mg/l) Area = 10,000 km 2
 Area = 10,000 km 2")
13
Zooplankton Benthic Macroinverts. Walleye (www.buckeyeangler.com) Planktivorous Fish Benthivorous Fish Emerald shiner (www.cnr.vt.edu) Rainbow smelt (nas.er.usgs.gov) Yellow Perch (©Shedd Aquarium) White Perch (www.cnr.vt.edu) Piscivorous Fish Brandt et al. Central Lake Erie Food Web
 Yellow Perch (©Shedd Aquarium) White Perch ( Piscivorous Fish Brandt et al. Central Lake Erie Food Web.")
14
Modeling Approach Simple model: bring together behavior, ecology, physiology/bioenergetics, environmental data. – Physical environment (Temperature, DO, Climate) – Bioenergetics (growth rate, habitat preference) – Mortality & sub-lethal effects (body condition) – General enough to model multiple fish species
 – Bioenergetics (growth rate, habitat preference) – Mortality & sub-lethal effects (body condition) – General enough to model multiple fish species.")
15
Hypoxia negatively affects smelt by modifying habitat Warming + Hypoxia Rainbow Smelt Thermocline Cool Dark Normoxic conditions Hypoxic Warm Hypoxic conditions

16
Hypoxia negatively affects smelt by modifying habitat. Consequences? access to optimal (cool) temperatures access to prey condition (health, weight) Hypoxic Warm Normal Warming + Hypoxia Cool Dark
 temperatures access to prey condition (health, weight) Hypoxic Warm Normal Warming + Hypoxia Cool Dark.")
17
Fish movement, quality & survival affected by: – Temp, DO – Food – Predation risk Goals: – Population impact? – Fish body condition? – Climate variation? – Disease risk? Hypoxic Warm Normal Model Foundations Cool Dark

18
Physical Environment (1987-2005) Temperature Rucinski et al, 2010
 Temperature Rucinski et al, 2010")
19
Physical Environment (1987-2005) Rucinski et al, 2010
 Rucinski et al, 2010")
20
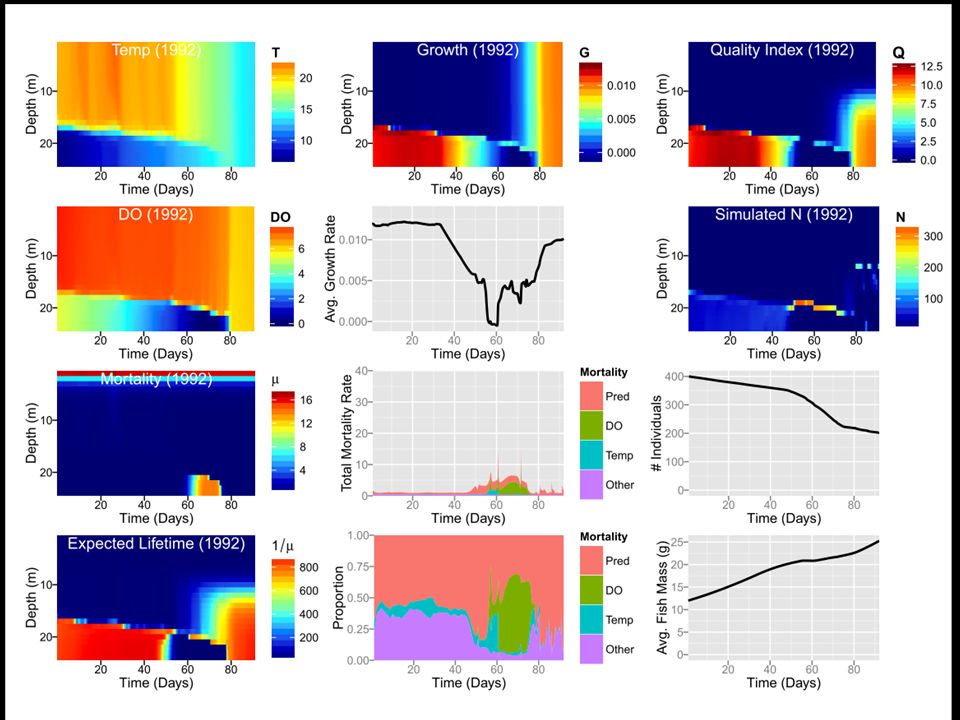
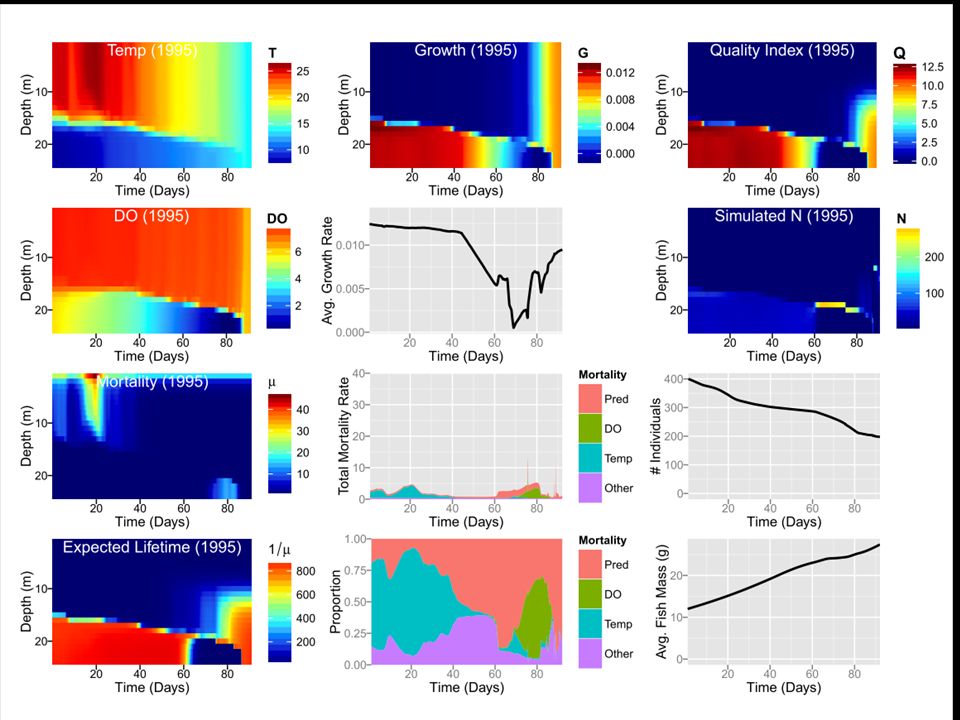
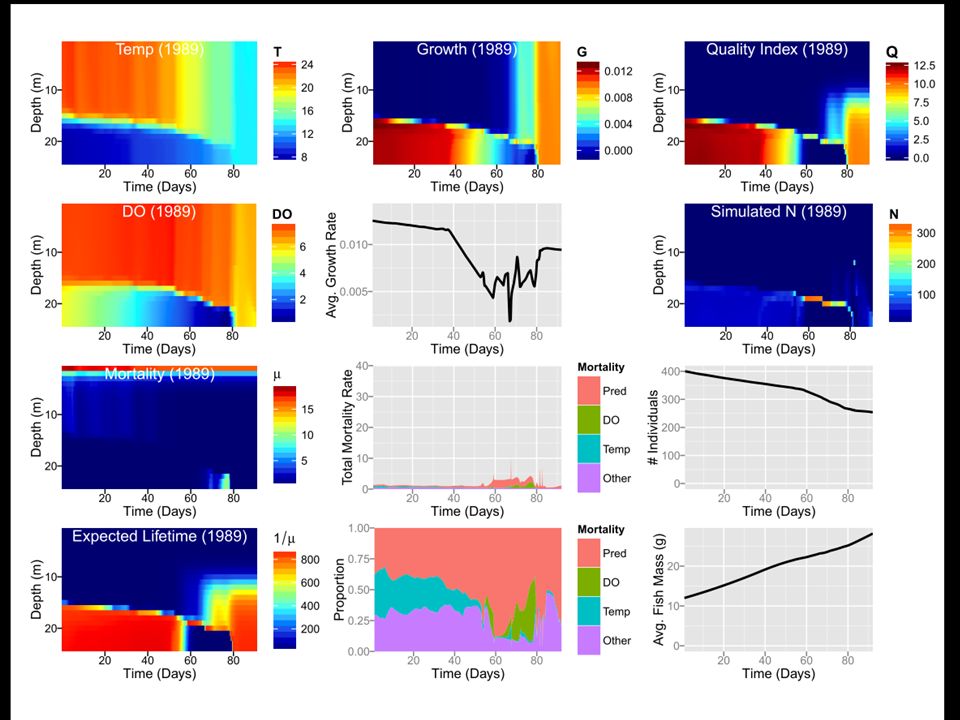
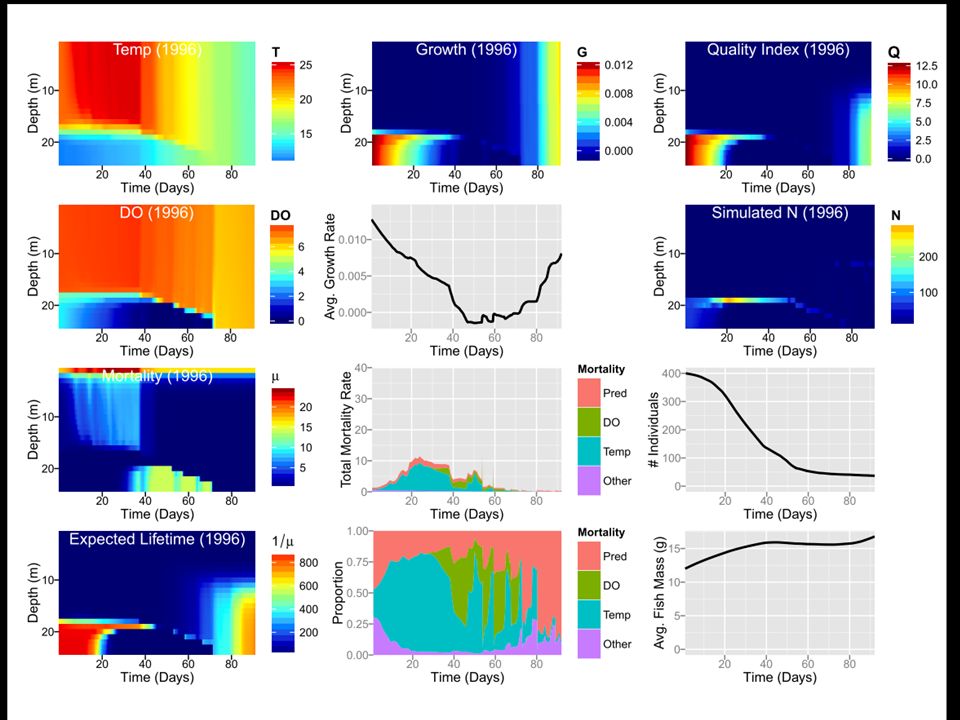
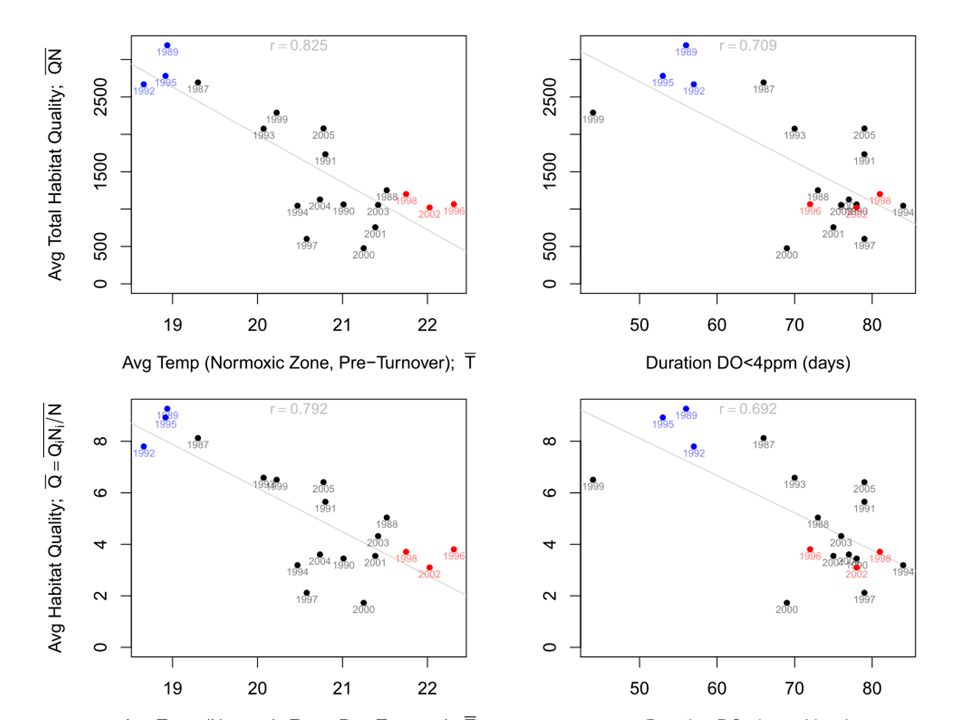
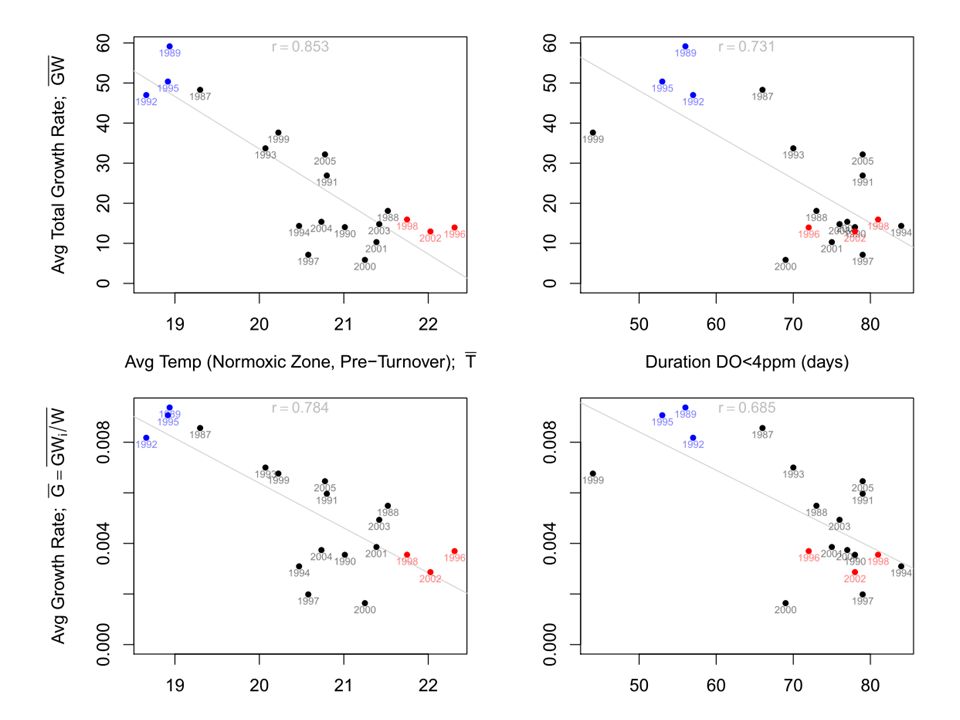
Annual Variation (1987-2005)
")
21
Oxygen TemperatureZP prey Fish Mass Growth Rate (G i ) Bioenergetics Model Bioenergetics parameters: Arend et al 2011, Lantry & Stewart 1990
 Bioenergetics Model Bioenergetics parameters: Arend et al 2011, Lantry & Stewart 1990")
22
Bioenergetics Model Growth rate given by C = Biomass consumption rate, F = Egestion, U = Excretion, R = Respiration Ex:

23
Mortality from predation, low DO, high T, other: Predation (by Walleye) depends on light, attack rates, response rates, success rates. Hypoxia: Temperature: Mortality

24
Movement Model Central Basin of Lake Erie, ignore horizontal space. Water column divided into 24 “patches” each roughly 1 meter deep. N i = # fish in patch i N1N1 N2N2 N3N3 N…N… N 24 Leave based on “patch” quality N1N1 N2N2 N3N3 N…N… N 24 Redistribute

25
Movement Model Central Basin of Lake Erie, ignore horizontal space. Water column divided into 24 “patches” each roughly 1 meter deep. N i = # fish in patch i N1N1 N2N2 N3N3 N…N… N 24 ∑mξiNi∑mξiNi mф i (N) N1N1 N2N2 N3N3 N…N… N 24
 N1N1 N2N2 N3N3 N…N… N 24.")
26
Improving the Movement Model Movement based on Q = G/μ can lead to tolerance of terribly high mortality rates! Solution? Stimulus ≠ Response! Q = g(G)f(1/μ) 1/μ f(1/μ)
f(1/μ) 1/μ f(1/μ).")
27
Improving the Movement Model Movement based on Q = G/μ can lead to tolerance of terribly high mortality rates! Solution? Stimulus ≠ Response! Q = g(G)f(1/μ) What about g(G)? – Predator encounters (stochastic) inhibit foraging. – Solution: use μ to discount ideal growth rate G g(G, μ) = G exp(-λ(μ) h) λ(μ) = attack rate, h = displacement duration.
f(1/μ) What about g(G). – Predator encounters (stochastic) inhibit foraging. – Solution: use μ to discount ideal growth rate G g(G, μ) = G exp(-λ(μ) h) λ(μ) = attack rate, h = displacement duration..")
28
Improving the Movement Model Movement based on Q = G/μ can lead to tolerance of terribly high mortality rates! Solution? Stimulus ≠ Response! Q = g(G)f(1/μ) Better solution! – Sensitivity h should be high during hard times, moderate to low during good times. – Solution: For time t, define q i = Q i /max(Q i ). Then ξ i = exp(-h Q i ) ξ i = exp(-h/max(Q i ) Q i ) ξ i = exp(-hq i )
f(1/μ) Better solution. – Sensitivity h should be high during hard times, moderate to low during good times. – Solution: For time t, define q i = Q i /max(Q i ). Then ξ i = exp(-h Q i ) ξ i = exp(-h/max(Q i ) Q i ) ξ i = exp(-hq i ).")
29
Model Central Basin of Lake Erie, ignoring horizontal space. A closed system, with the water column divided into 24 “patches” each roughly 1 meter deep.

36
Annual Variation (1987-2005)
")
42
Remarks Water warming and environmental hypoxia … …can have strong, negative impacts on pelagic fish: – Survival (direct) and growth (indirect) – Increased aggregation/density. This approach provides a unique and promising avenue to better quantify these effects. Micro-scale (<1m) environmental factors likely have big effects! Mortality/survival is a complex and poorly understood piece of the puzzle. But what about… Fish with other natural histories? Trophic interactions? Disease?
 environmental factors likely have big effects. Mortality/survival is a complex and poorly understood piece of the puzzle. But what about… Fish with other natural histories. Trophic interactions. Disease .")
43
Model + Infectious Disease S = # susceptible, I = # infected/infectious, R = # recovered/immune

45
Infection Risk Index

46
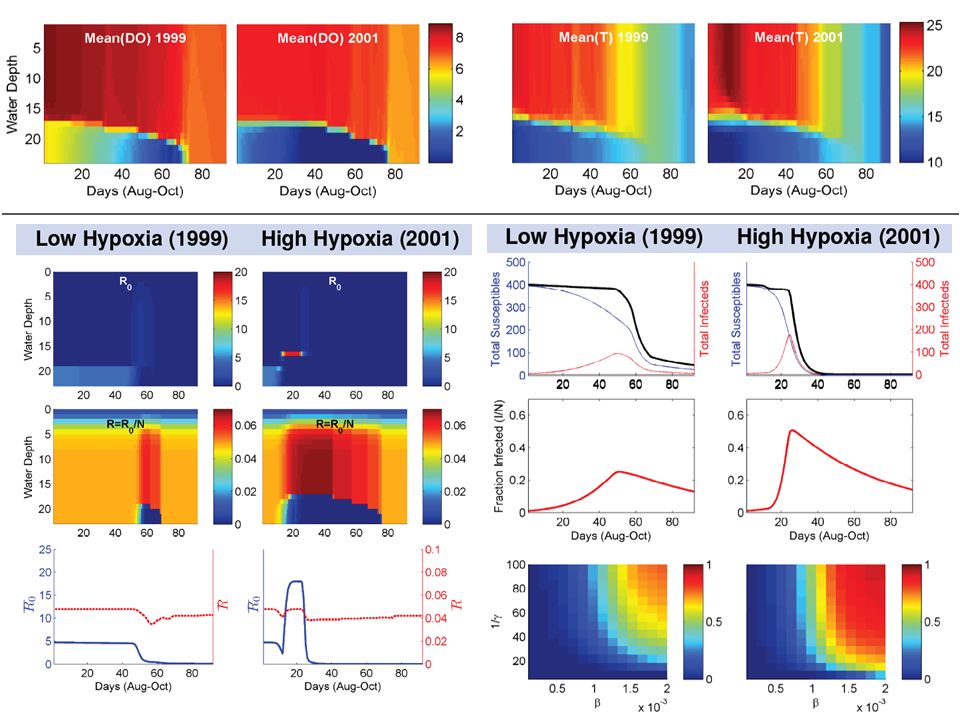
Stress Effects Low Hypoxia (1999)High Hypoxia (2001)
High Hypoxia (2001)")
47
Infection Risk Index Low Hypoxia (1999)High Hypoxia (2001)
High Hypoxia (2001)")
48
Remarks Hypoxia induced aggregation can increase disease risk. Stress effects appear to be less significant. Aquatic parasites: – more complex life histories than terrestrial parasites? – macro- versus micro-? – When does “stress + symbiosis = parasitism”?

49
In Conclusion Not a good time to be a cold-loving species… Human Induced Rapid Environmental Change (HIREC) is a complex cornerstone of “our” future. Bridging ecology, evolution, physiology, physical processes, climate change, epidemiology, etc. …requires REALLY good data! Simple (and not-so-simple) models, combined with data, are increasingly essential research tools.
 models, combined with data, are increasingly essential research tools..")
50
Questions?

51
In Conclusion Not a good time to be a cold-loving species… Human Induced Rapid Environmental Change (HIREC) is a complex cornerstone of “our” future. Bridging ecology, evolution, physiology, physical processes, climate change, epidemiology, etc. …requires REALLY good data! Simple (and not-so-simple) models, combined with data, are increasingly essential research tools.
 models, combined with data, are increasingly essential research tools..")
52
Any Questions? MathBio Resources R, python, C: many online resources! Introductory course materials free online. Texts by Anderson & May, Murray, Strogatz, Bolker, Edelstein-Keshet, Otto & Day, Ellner & Guckenheimer, plus series by SIAM, Springer... MBI (mbi.osu.edu), NIMBioS, others at mathinstitutes.org Society for Mathematical Biology, SIAM-LS, … Friends and colleagues!
, NIMBioS, others at mathinstitutes.org Society for Mathematical Biology, SIAM-LS, … Friends and colleagues!.")
53
Data from Lake Erie: 1987-2005

56
Central Lake Erie Hypoxia

57
Hypoxia (Low Dissolved O 2 ) Worldwide water-quality problem Hypoxia can – reduce fish growth rates and induce stress – reduce foraging success – force fish to aggregate in a 1-2m band of the water column, and – reduce availability of predation refugia. Consequences for fish disease poorly known. Warming climate = more severe hypoxia.

Similar presentations


 in the Chesapeake Bay.>")


. –Interference competition.>")
 1.Connectedness Based on observations 2.Energy flow web.>")


