Download presentation
Presentation is loading. Please wait.

1
Chapter 20: The Atmosphere, Climate and Global Warming

2
Overview Fundamental Global Warming Questions Weather and Climate
The Origin of the Global Warming Issue The Atmosphere How We Study Climate The Greenhouse Effect The Major Greenhouse Gases Climate Change and Feedback Loops Causes of Climate Change The Oceans and Climate Change Forecasting Climate Change Potential Rates of Global Climate Change Potential Environmental, Ecological and Human Effects of Global Warming Adjusting to Potential Global Warming

3
Fundamental Questions About Global Warming
Concern arises from two pieces of evidence: Increase in average surface temperature of the Earth from 1860 to the present 0.2˚C per decade since 1960 Increase in carbon dioxide concentrations in the atmosphere Measured on Mauna Loa in Hawaii by Charles Keeling

6
Fundamental Questions About Global Warming
What is the origin of rapid warming in the geologic record? Is the present rapid warming unprecedented or at least so rare that many living things will not be able to respond successfully to it? To what extent, have people caused it? What are likely to be the effects on people? What are likely to be the effects on all life on Earth? How can we make forecasts about it and other kinds of climate change? What can we do to minimize potential negative effects?

7
Weather and Climate Weather Climate is the average weather
what’s happening now in the atmosphere near the earth’s surface Temperature, pressure, cloudiness, precipitation, winds Climate is the average weather Usually refers to long periods of time Classified mainly by latitude and wet/dry

9
The Climate is Always Changing
Climate has warmed and cooled may times in Earth’s history Times of high temp involve relatively ice free periods Times of low temp involve glacial events

11
The Origins of the Global Warming Issue
Relationship between chemistry of planet’s atmosphere and planet’s surface temperature Certain gases trap heat energy and warm the planet Since this idea was first introduce has stirred controversy

12
The Atmosphere Thin layer of gases that envelops Earth Comprised of
Held near the surface by gravitation and pushed upward by thermal energy. Comprised of Nitrogen (78%) Oxygen (21%) Argon (0.9%) Carbon dioxide (0.03%) Water vapor Trace amounts of other gases/pollutants Dynamic system
 Oxygen (21%) Argon (0.9%) Carbon dioxide (0.03%) Water vapor. Trace amounts of other gases/pollutants. Dynamic system.")
13
Structure of the Atmosphere
Made up of several vertical layers Troposphere - bottom layer Where weather occurs Temperature decrease with elevation At the top is tropopause - acts as a lid Stratosphere - above the troposphere Stratospheric ozone layer just above the tropopause Protects again UV radiation

15
Atmospheric Processes
Processes generally defined by pressure, temperature, and water vapor content Pressure is force per unit area Caused by the weight of overlying atmospheric gases on those below Decreases with altitude Low pressure systems usually bring clouds High pressure systems usually bring clear skies

16
Atmospheric Processes
Temperature is the relative hotness or coldness of materials Measure of thermal energy Water vapor content is how much water is in the gaseous form Varies from 1% to 4%

17
Atmospheric Processes
Atmosphere moves due to Earth’s rotation Differential heating Produces global patterns of prevailing winds and latitudinal belts of high and low pressure

19
What Makes the Earth Warm
Almost all the energy from the sun Sunlight comes in a wide range of electromagnetic radiation Long to short wavelengths Most of the radiation that reaches the Earth is in the infrared and visible wavelengths

21
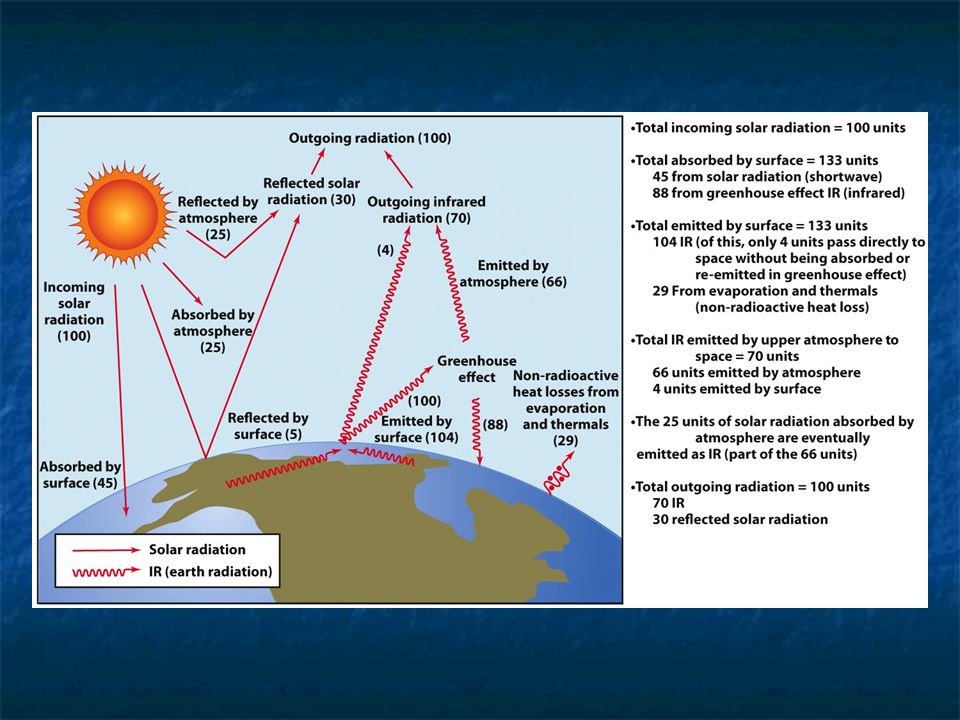
What Makes the Earth Warm
Under typical conditions Earth’s atmosphere: Reflects ~30% of the electromagnetic energy that comes in from the sun absorbs ~25% The remaining ~45% gets to the surface Radiates back to the atmosphere or into outer space

23
How We Study Climate Instrumental Records
Climate measurements began in 1860s Data from pre 19th century is Estimates Extrapolated Interpolated We have very accurate data since 1960 Improved instrumentation

24
How We Study Climate Historical Records Paleoproxy records
Go back a few centuries Mostly qualitative Books, newspapers, journal articles, personal journals, ships’ logs, travelers’ diaries, and farmers’ logs Paleoproxy records Proxy data- not strictly climatic, but provides insight into climate Tree rings, sediments, ice cores, fossil pollen, corals, and carbon‑14 (14C)
")
25
Proxy Climate Records Ice Cores
Ice cores have small bubbles of air Can measure carbon dioxide and methane levels from the time the ice was created Ice Cores Polar ice and mountain glaciers have ice records that go back 100s or 1000s of years Oldest is 800,000 years

26
Proxy Climate Records Tree Rings
Many trees create one growth ring per year Width, density and ionic composition of the ring are indicative of climate

27
Proxy Climate Records Sediment
Biological material (ex: pollen) is deposited on the land and stored for extended periods in lake, bog, and pond sediments Pollen is useful Quantity of pollen is an indicator of relative abundance of each plant species Pollen can be dated Can be used to construct a climate history
 is deposited on the land and stored for extended periods in lake, bog, and pond sediments. Pollen is useful. Quantity of pollen is an indicator of relative abundance of each plant species. Pollen can be dated. Can be used to construct a climate history.")
28
Proxy Climate Record Coral Coral exoskeleton made of calcium carbonate
Carbonate contains isotopes of oxygen Used to determine temp of water in which the coral grew

29
Proxy Climate Record Carbon-14 and sun sunspots

30
The Green House Effect Each gas in the atmosphere has its own absorption spectrum Certain gases are especially strong absorbers in the infrared They absorb radiation emitted by the warmed surfaces of the Earth They then re-emit this radiation This increases the temperature of the earth’s surface

32
The Green House Effect Natural phenomenon
Major greenhouse gases include Water vapor Carbon dioxide Methane Some oxides of nitrogen CFCs

35
Greenhouse Effect No one doubts that the greenhouse effect exists and affects planets The puzzle arises on the Earth about relative importance of greenhouse gases in affecting climate Evidence indicates that carbon dioxide, methane, and temperature rise and fall together Most scientists conclude that greenhouse gases are causing climate change

36
Positive and Negative Feedbacks
The atmosphere and its interactions w/ the ocean and land surfaces experience positive and negative feedbacks Negative feedback Warms temps warm air and lead to increased evaporation Evaporation leads to more cloud formation which reflects more sunlight which could cool the surface.

37
Positive and Negative Feedbacks
Positive feedback Warms temps warm air and lead to increased evaporation but instead of clouds forming remain as water vapor Water vapor is a greenhouse gas. The warmer it gets the more water vapor, and the process continues

38
Causes of Climate Change
19th century Scientists began to understand that climate changed greatly over long periods There were times of continental glaciations Evidence - debris at the edges of existing glaciers which looked the same as those deposited at lower elevations Cycles were apparent 100,000 year cycles divided into 20,000– 40,000 year periods

39
Causes of Climate Change
Milankovitch Cycles Explain why climate changes Earth is like a wobbling top following an elliptical orbit around the sun Three Cycles 26,000 year Earth Does not keep its poles at a constant angle in relation to the sun Wobble around the pole makes a complete cycle in 26,000 years

41
Causes of Climate Change
41,000 years The tilt of wobble also varies over a period of 41,000 years 100,000 years Elliptical orbit around the sun also changes Sometimes it is a more extreme ellipse; other times it is closer to a circle and this occurs over 100,000 years.

43
Causes of Climate Change
The combination of these lead to periodic changes in the amount of sunlight reaching the Earth Milankovitch showed that these variations correlated with major glacial and interglacial periods Don’t account for all climate variations

44
Solar Cycles The Sun Goes Through Cycles
Sometimes hotter, sometimes cooler Documented by differing amounts of isotopes trapped in glacial ice Variability of solar input of energy explains some of the climatic variability too

45
Atmospheric Transparency Affects Climate and Weather
Transparency of atmosphere to radiation affects the temp of the Earth From the sun coming in From the Earth’s surface going out Dust and aerosols absorb light Volcanoes, forest fires and farming put dust into the atmosphere Chemical and physical comp of atmosphere can make it warmer or cooler

46
The Ocean’s Effect on Climate Change
Water has the highest heat capacity of any compound Large amount of heat energy is stored in oceans Ocean absorbs dissolved CO2 As CO2 increases in atmosphere it also increases in the oceans

47
The Ocean’s Effect on Climate Change
Climate system driven (in part) by ocean conveyor belt A global circulation of ocean waters If the conveyor was shut down, major changes in climate would occur
 by ocean conveyor belt. A global circulation of ocean waters. If the conveyor was shut down, major changes in climate would occur.")
48
El Niño and Climate El Niño refers to a specific periodic variation of Pacific Ocean currents Under non-El Niño conditions Trade-winds blow west across the tropical Pacific Warm surface water pile up in Western Pacific

49
El Niño and Climate During El Niño years
Trade winds weaken Western moving current weakens or reverses As a result eastern equatorial ocean unusually warm High rates of precipitation and flooding in Peru Changes global atmospheric circulation Causes changes in weather in regions that are far removed from tropical Pacific

50
El Niño and Climate Surface water temperature rise off the South American coast inhibits the upwelling of nutrient-rich cold water from deeper levels Upwelling releases carbon dioxide El Niño events reduce the amount of oceanic carbon outgassing

52
Forecasting Climate Change
Two ways to forecast the future: Empirical and theoretical Empirical approach is to go back to the geological idea of uniformitarianism The past is the key to the future Has led to the extensive research on climates and atmospheric conditions of the past

53
Predicting the Future of the Climate
Problem with Empirical approach Temperature records are recent and not widespread Difficult to extrapolate, interpolate and estimate Hadley Meteorological Center in Great Britain Reconstructing temp records

54
Predicting the Future of the Climate
Computer simulation General Circulation Models (GCM) Based around the atmosphere being divided into rectangular solids Each a few km high and several km N or S For each the flux of energy and matter is calculated to each adjacent cell Steady state model - cannot account for randomness
 Based around the atmosphere being divided into rectangular solids. Each a few km high and several km N or S. For each the flux of energy and matter is calculated to each adjacent cell. Steady state model - cannot account for randomness.")
56
Potential Rates of Global Climate Change
Global surface temp has increased 0.2°C/ decade in the past 30 years. Eight warmest years have occurred since 1997 Continued warming of 0.2°C /decade is projected.

57
Potential Rates of Global Climate Change
By 2030 CO2 concentration in the atmosphere will have doubled from pre-Industrial Revolution concentrations Average global temperature will have risen approximately 1° to 2°C Even greater temperature increases at poles Polar amplification

58
Potential Effects of Global Warming
Changes in River Flow Melting of glacial ice & reductions in snow cover Rainfall will likely increase, but runoff will be more rapid than if snow slowly melts Reservoirs will overflow - more water will flow to the ocean

59
Potential Effects of Global Warming
Rise in Sea Level Since last ice age, sea level has risen 1 ft/century Global warming could double this A major warming could increase sea levels Expansion of liquid water as water warms Melting of ice sheets on land whose waters then flow into the ocean About half the people on Earth live on or near the coast - vulnerable to flooding

60
Potential Effects of Global Warming
Rise in sea level could: Threatens island nations Increase coastal erosion on open beaches and cause property loss. Cause landward progression of estuaries and salt marshes Lead to lost of coastal wetlands Threaten ground water supply in coastal communities

61
Tuvalu, the world’s smallest nation, may succumb to sea level rise

62
Potential Effects of Global Warming
Glaciers and Antarctic Ice Cap Far more glaciers are retreating than advancing worldwide Northern Hemisphere sea ice coverage has declined an average of 10.7% per decade since 1970s

63
Potential Effects of Global Warming

64
Potential Effects of Global Warming
The central ice cap on Antarctica is growing This is consistent w/ prediction of global climate change models As Earth warms, more snow falls on Antarctica The rate of melting of the Greenland ice sheet has doubled since 1998

66
Potential Effects of Global Warming
Changes in Biological Diversity The Intergovernmental Panel on Climate Change (IPCC) report states that “approximately 2–20% of species assessed so far are likely to be at increased risk of extinction as global mean temperatures exceed a warming of 2 to 3°C above preindustrial levels.”
 report states that. approximately 2–20% of species assessed so far are likely to be at increased risk of extinction as global mean temperatures exceed a warming of 2 to 3°C above preindustrial levels.")
67
Potential Effects of Global Warming
Black guillemots Birds that nest on Cooper Island, Alaska, The abundance of this species has decreased Recession of sea ice occurred before chicks were mature enough to survive on their own Parent birds feed on Arctic cod found under the sea ice Distance from feeding grounds to nest must be <30 km In recent years - 250km to feeding grounds Lost an important source of food for locals

69
Potential Effects of Global Warming
Agricultural Productivity-globally Likely to increase in some regions and decline in others Locations most likely negatively effected Mid-latitude food production Lands in the southern part of the N. Hemisphere May become more arid & soil moisture relationships will change Human Health Effects Difficult to forecast

70
Adjusting to Potential Global Warming
Two types Adapt Learn to live with future global climatic change Mitigate Work to reduce emissions of greenhouse gases

71
Adjusting to Potential Global Warming
How can carbon dioxide emissions be reduced? Energy planning that relies heavily on energy conservation and efficiency Use of alternative energy sources or natural gas Use of mass transit Greater economic incentives to energy- efficient technology Higher fuel-economy

72
Adjusting to Potential Global Warming
Burning forests to convert land to agriculture Accounts for ~20% of anthropogenic emissions of carbon dioxide Reduce this by minimizing burning and protecting the world’s forests Reforestation Planting more trees Increase biospheric sinks for carbon dioxide

73
Adjusting to Potential Global Warming
Geologic sequestration of carbon is another possible mitigation measure Capture carbon dioxide from power plants and industrial smokestacks Compress the gas and change it to a mixture of both liquid and gas Inject it deep underground Have the potential to sequester as much as 1,000 gigatons of carbon

74
International Agreements to Mitigate Global Warming
Two major approaches International agreements in which each nation agrees to some specific limit on emissions Carbon trading

75
Carbon Trading A nation or nation agrees to a cap of carbon emissions
Then corporations and other entities are issued emission permits, allowing a certain quantity of emissions These can be traded Overall nation does not exceed the cap

76
International Agreements to Mitigate Global Warming
1988 First international meeting to discuss limiting greenhouse gases held (Toronto, Canada) 1992 Earth Summit in Rio de Janeiro, Brazil. General blueprint for reduction of global emissions suggested US thought it would be to costly and no legally binding limits set
 Earth Summit in Rio de Janeiro, Brazil. General blueprint for reduction of global emissions suggested. US thought it would be to costly and no legally binding limits set.")
77
International Agreements to Mitigate Global Warming
1997 Legally binding limits discussed in Kyoto, Japan. US eventually agreed to cut emissions to 7% below 1990 levels (leading scientists recommend cuts 60-80% below) Became a formal treaty in 2006
 Became a formal treaty in")
Similar presentations


 McGraw Hill Ryerson 2007 11.1 Natural Climate Change “Climate” describes the average conditions of a region. Climate is usually measured over a minimum.>")


 above Earth. Densest – N, O, & water vapor Stratosphere->")
 –Usually described in terms of average temperatures, precipitation,>")


