Download presentation
Presentation is loading. Please wait.

1
The Multilateral Trade System Lecture 17

2
Snapshot of U.S. Trade How Much? 1998: $1,587.4 Billion Imports and Exports of Goods and Services 1998 GDP $8,760.0 Billion Openness: 18.1% Source: Economic Report of the President, 2000

3
Top Ten Trading Partners ($U.S. Billions, August 2000) Canada268.9 Mexico161.5 Japan138.8 China73.1 Germany58 United Kingdom55.4 South Korea44.2 Taiwan42.9 France32.0 Singapore23.6 Source: U.S. Bureau of Economic Analysis Total: 898.4
 Canada268.9 Mexico161.5 Japan138.8 China73.1 Germany58 United Kingdom55.4 South Korea44.2 Taiwan42.9 France32.0 Singapore23.6 Source: U.S. Bureau of Economic Analysis Total:")
4
Top Ten Deficits ($U.S. Billions, August 2000) Japan-54.0 China-52.4 Canada-32.9 Germany-19.4 Mexico-16.0 Taiwan-10 Italy-9.6 Malaysia-9.2 Venezuela-8.4 South Korea-7.0 Source: U.S. Bureau of Economic Analysis
 Japan-54.0 China-52.4 Canada-32.9 Germany-19.4 Mexico-16.0 Taiwan-10 Italy-9.6 Malaysia-9.2 Venezuela-8.4 South Korea-7.0 Source: U.S. Bureau of Economic Analysis.")
5
Top 9 Surpluses, 2000 ($US Billions) Netherlands12.3 Australia6.0 Brazil4.5 Belgium4.0 Hong Kong3.2 Egypt2.4 Argentina1.6 United Arab Emirates1.3 Panama1.3 Source: U.S. Bureau of Economic Analysis

6
US Exports and Imports ($Million) ExportsImports Aircraft49,611Motor Vehicles96,888 Auto Parts29,398Crude Oil50,662 Computers26,715Computers49,173 Telecom Equip24,381Computer Components 31,906 Computer Components 20,811Auto Parts26,044 Motor Vehicles17,060Toys and Sporting Goods 18,991 Piston Engines12,388Apparel17,961 Source: U.S. Department of Commerce

7
Why Accept Hegemonic Role? Altruism: Created the Postwar Economy Because it was Needed and No Other Country Could. Security: Created the Postwar Economy Because U.S. Security Interests Necessitated it (Liberalism). Materialistic: Created the Postwar Economic System Because American Economic Actors Stood to Realize Large Benefits From Open Trade and Stable Exchange Rates.
. Materialistic: Created the Postwar Economic System Because American Economic Actors Stood to Realize Large Benefits From Open Trade and Stable Exchange Rates..")
8
Why the GATT/WTO? Mercantilism versus Trade Theory Trade Theory: Imports Good, Exports Bad. Mercantilism: Exports Good, Imports Bad. Trade Liberalization Possible Only By Exchanging Concessions—You Open Your Market to My Exports, I Open My Market to Your Exports. Anarchic System Makes it Difficult to Enforce Trade Agreements (Prisoners’ Dilemma). GATT/WTO Provide Enforcement Mechanism Rules Increase Transparency (Who’s Cheating?) Dispute Settlement Mechanism Provides Neutral 3 rd Party to Examine and Resolve Disputes.
. GATT/WTO Provide Enforcement Mechanism Rules Increase Transparency (Who’s Cheating ) Dispute Settlement Mechanism Provides Neutral 3 rd Party to Examine and Resolve Disputes..")
9
Three Principles of the GATT/WTO Non-Discrimination Embodied in Most Favored Nation (MFN) (Article I) Reciprocity and Progressive Tariff Reductions Domestic Safeguards In 1994, the GATT Transformed in the World Trade Organization (WTO)
 (Article I) Reciprocity and Progressive Tariff Reductions Domestic Safeguards In 1994, the GATT Transformed in the World Trade Organization (WTO)")
10
The GATT/WTO Process GATT Bargaining Rounds Eight Rounds Between 1947 and 1994; 9 th Underway Kennedy Round (1962-1967) is High Water Mark of Tariff Reductions. Uruguay Round (1986-1993) Brings Institutional Change (World Trade Organization). Developing Countries Were Very Reluctant Participants: Didn’t Believe That Free Trade Worked to Their Advantage Believed GATT Bargaining Process Biased Against their Exports
 Brings Institutional Change (World Trade Organization). Developing Countries Were Very Reluctant Participants: Didn’t Believe That Free Trade Worked to Their Advantage Believed GATT Bargaining Process Biased Against their Exports.")
11
Consequences of the GATT

12
1. Tariff Reductions United States European Union Japan 195060% 196014% 18% 197010%9%11% 19806%7%6% 20004% 5%

13
2. Growth of World Trade

14
3. Growth of Foreign Direct Investment

15
4. Global Division of Labor

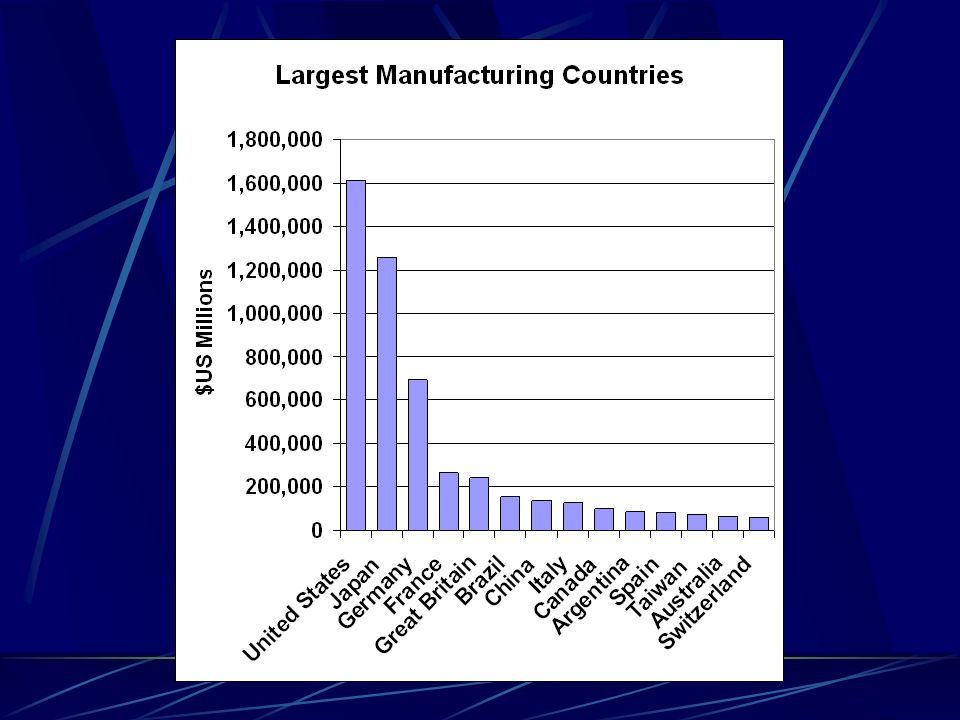
17
Distribution of Manufacturing Production

18
Distribution of LDC Manufacturing

19
North-South Distribution of Foreign Direct Investment

20
Distribution of LDC FDI

21
The Global Division of Labor Advanced Industrialized Countries Comparative Advantage in Capital and Human Capital Intensive Goods—Pharmaceuticals, Computers and Software, Telecommunications Systems, Aircraft. Asian Newly Industrializing Countries Comparative Advantage in Mature Capital Intensive Goods—Steel, Semiconductors, Autos. Other Developing Countries Comparative Advantage in Labor Intensive Goods (Apparel & Footwear; Assembly) and in Primary Commodities.
 and in Primary Commodities..")
Similar presentations


 –U.S., Canada,>")


 I.Scope §NAFTA Population:387 million §15 Nation EU Population:373.>")


 Symposium Presentation by Mike Nunes, Director, International Affairs Telecommunications Industry Association.>")
