Download presentation
Presentation is loading. Please wait.

1
User Friendly Software for Single Crystal TOF Neutron Scattering Data Visualization and Reduction Dennis Mikkelson 1, A.Schultz 2, P.Peterson 2, R.Mikkelson 1, T.Worlton 2, J.Hammonds 2, J. Cowan 2, Martha Miller 2, C. Bouzek 1, Michael Miller 1 1 University of Wisconsin-Stout 2 IPNS Division of Argonne National Laboratory

2
Outline Instruments & Data Visualization Data reduction process Calibration Software structure Future work

3
Momentum Change k k’ Q = k’ - k -k-k Q

5
The SCD at IPNS before upgrade to two detectors. (www.pns.anl.gov/instruments/scd /)
")
6
SCD data: 2 Detectors, 100x100 pixels x 300 time channels Wavelength range: 0.3 to 10Ǻ File size: 25 Mb Files per experiment: > 10 Total data per experiment: >250Mb File type: IPNS runfile (NeXus)
")
7
http://www.isis.rl.ac.uk/crystallography/SXD/index.htm

8
SXD data: 11-detectors 64x64 pixels x 1500 time channels Wavelength range:.2 to 10 Ǻ File size: 75 Mb Files per experiment: 5 ? Total data per experiment: > 225Mb File type: ISIS rawfile (NeXus)
.")
9
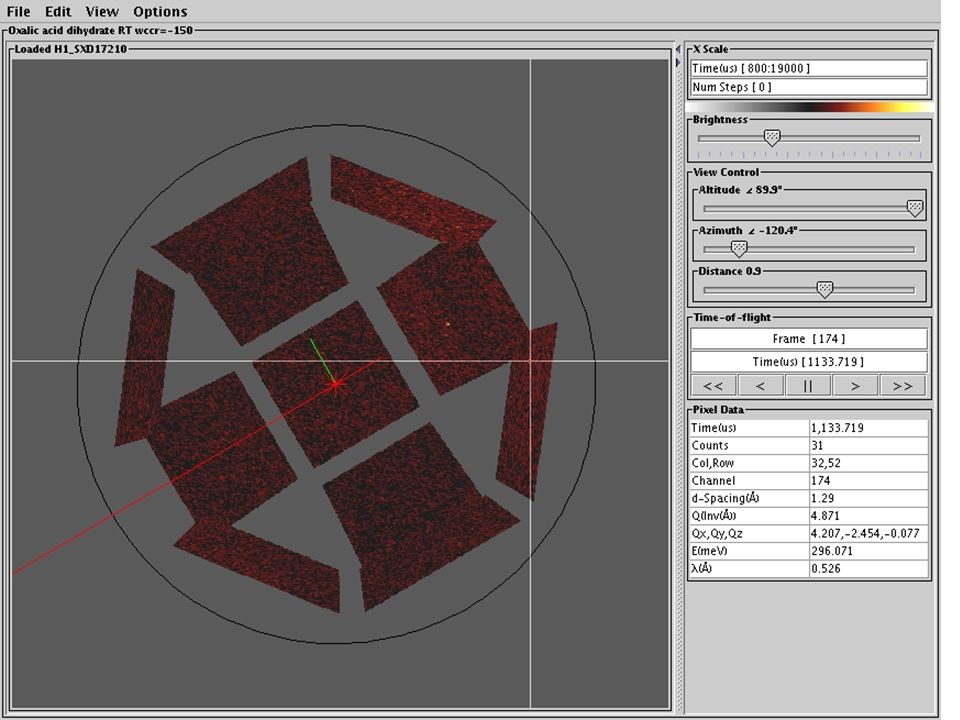
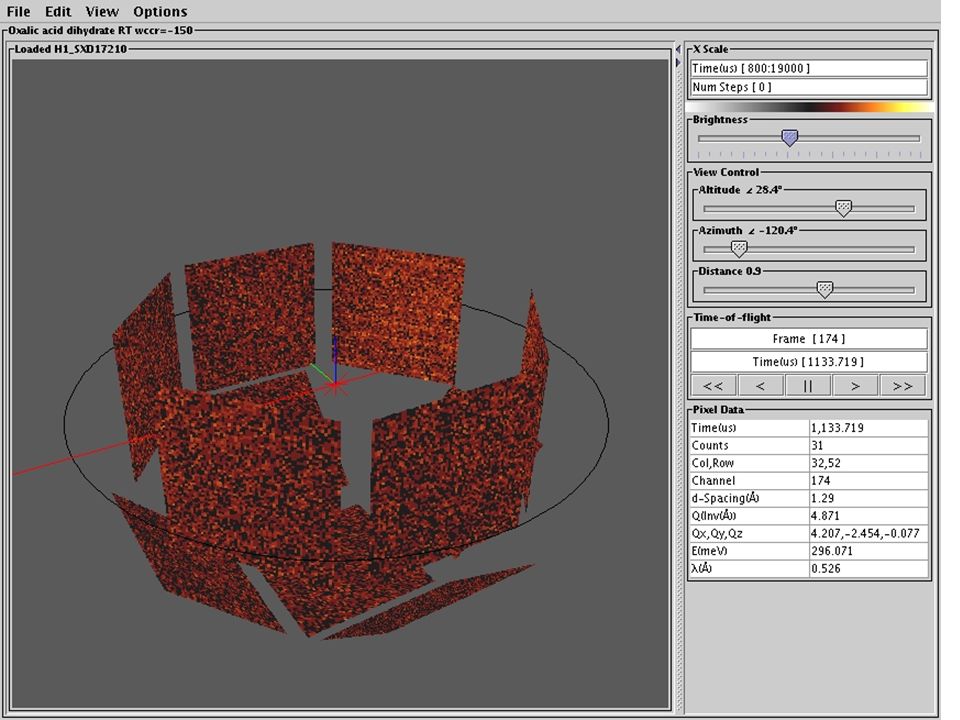
Data visualization: Interactive views –tables –per-detector image –list of spectra as image –3D view of instrument (from data file, NeXus) –hkl slices –reciprocal space
 –hkl slices –reciprocal space")
13
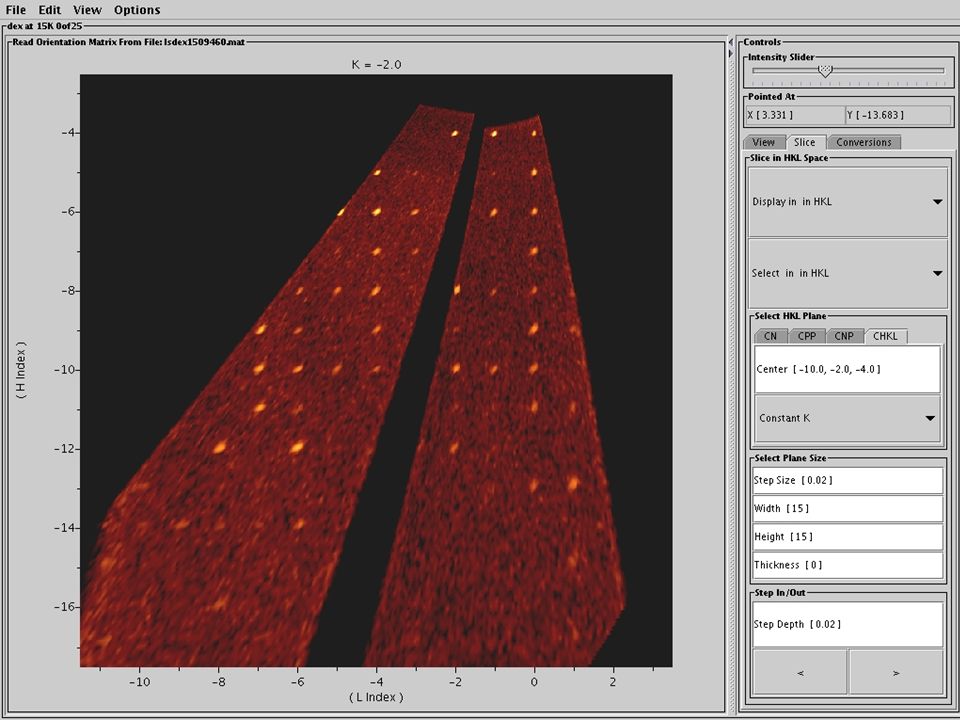
hkl slice viewer Interactive slices through reciprocal space –flexible plane selection –readout of wavelength, energy, hkl, Q –image controls, annotation, grids, etc. –“quick” calculation of chosen slice –step through sequence of slices

16
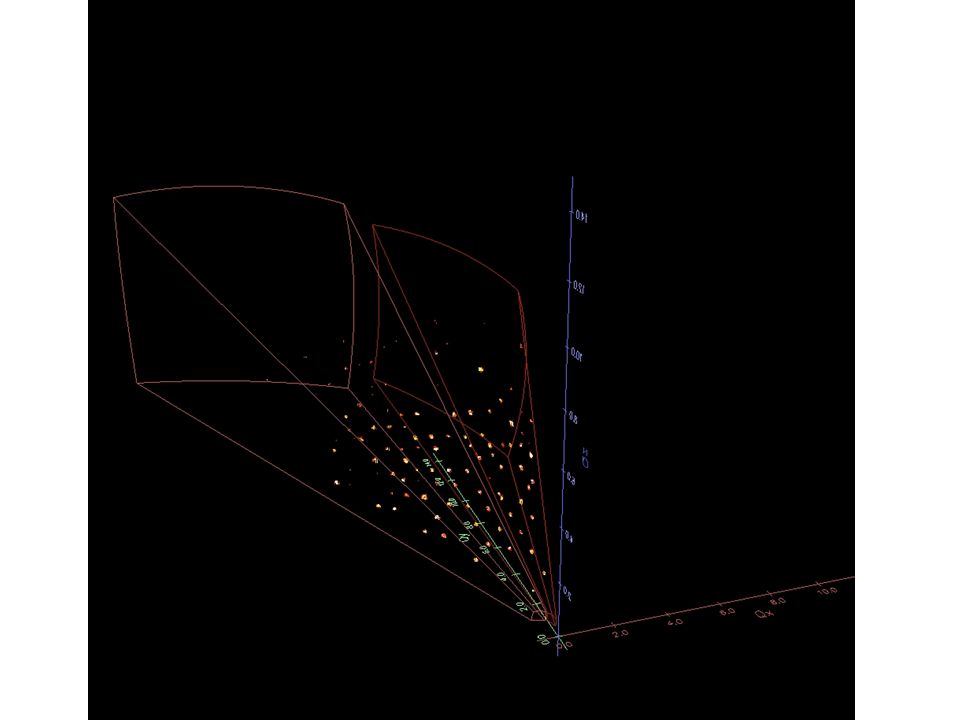
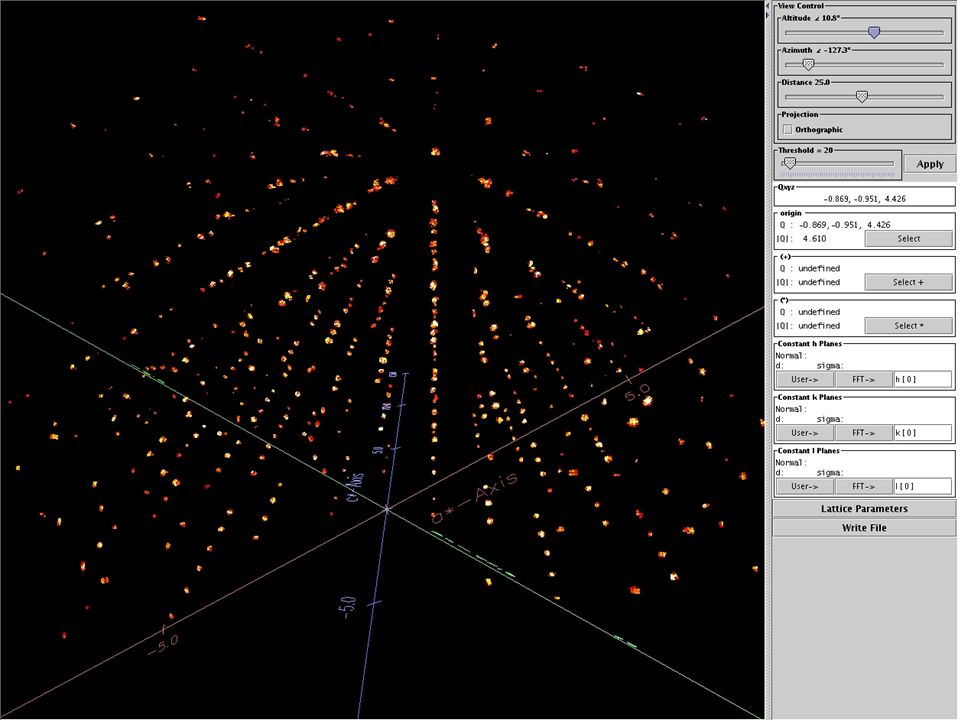
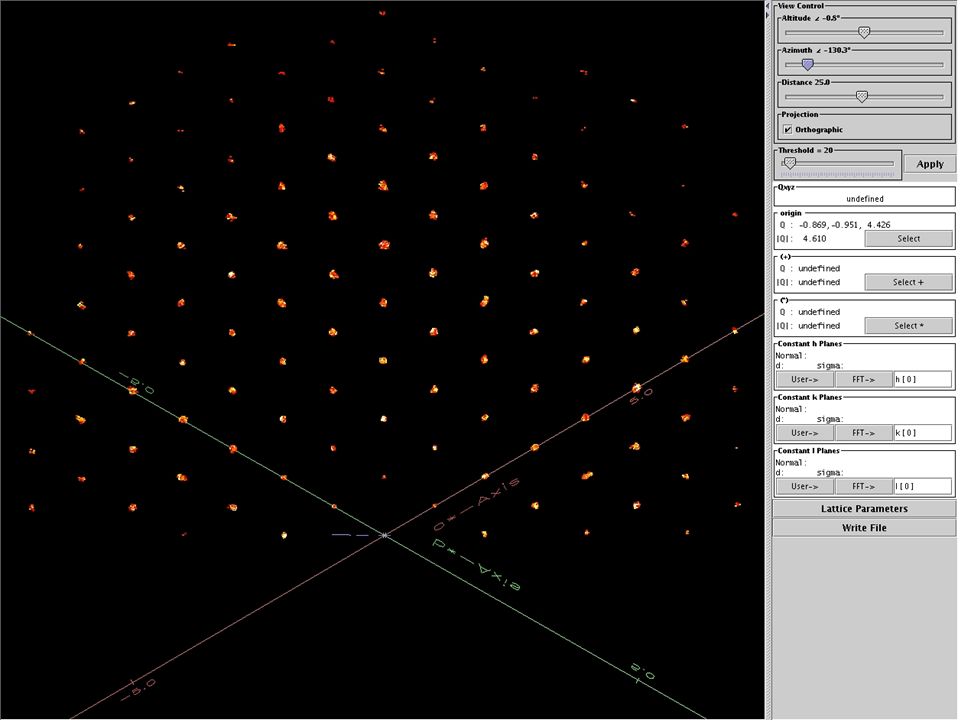
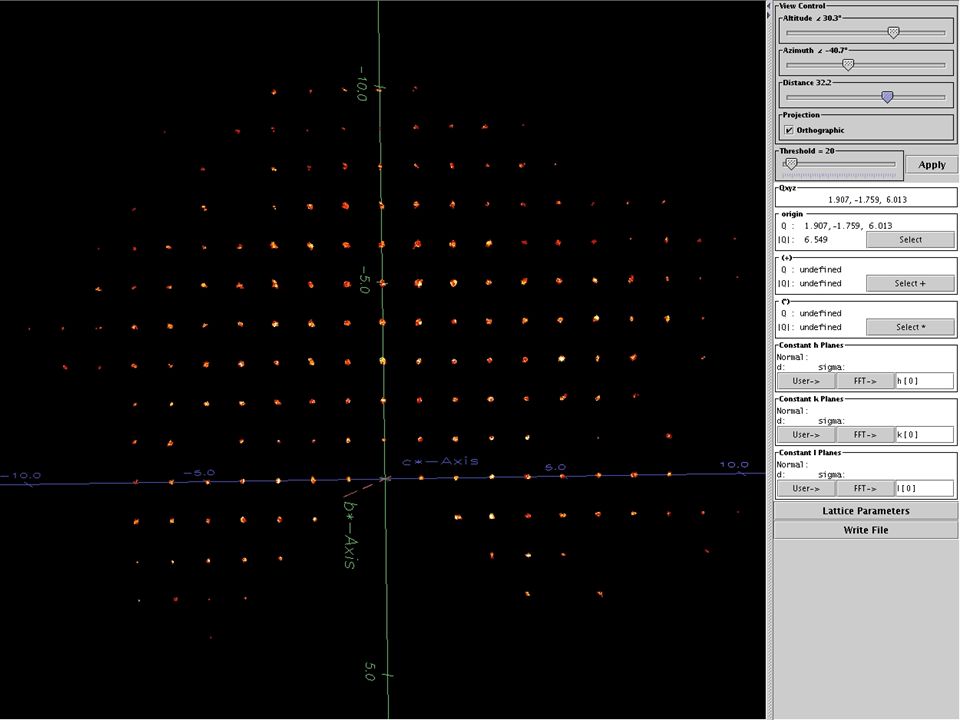
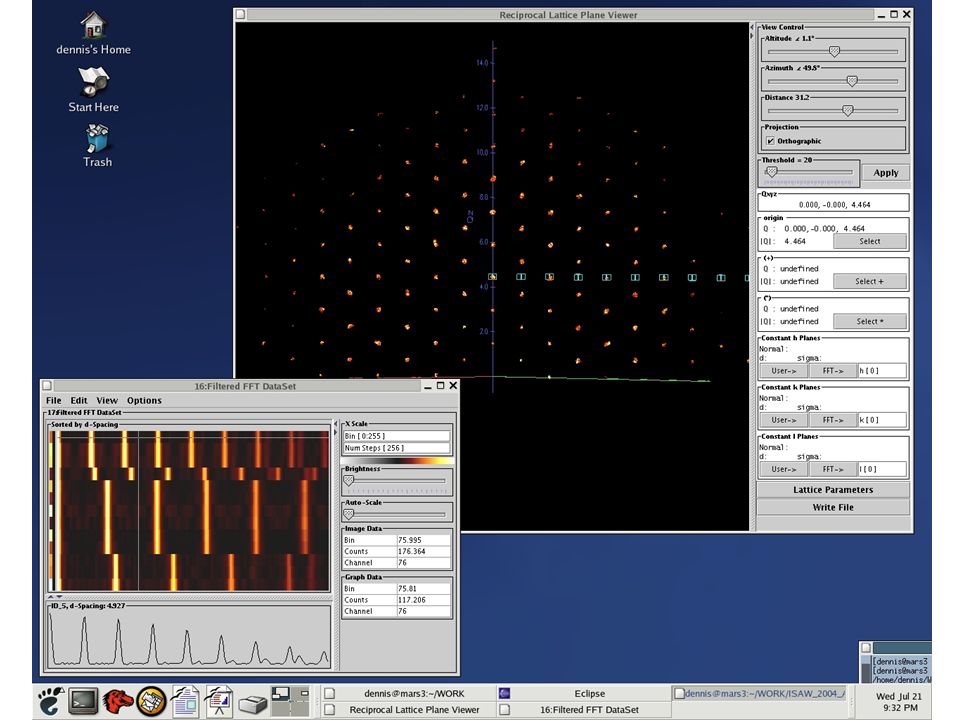
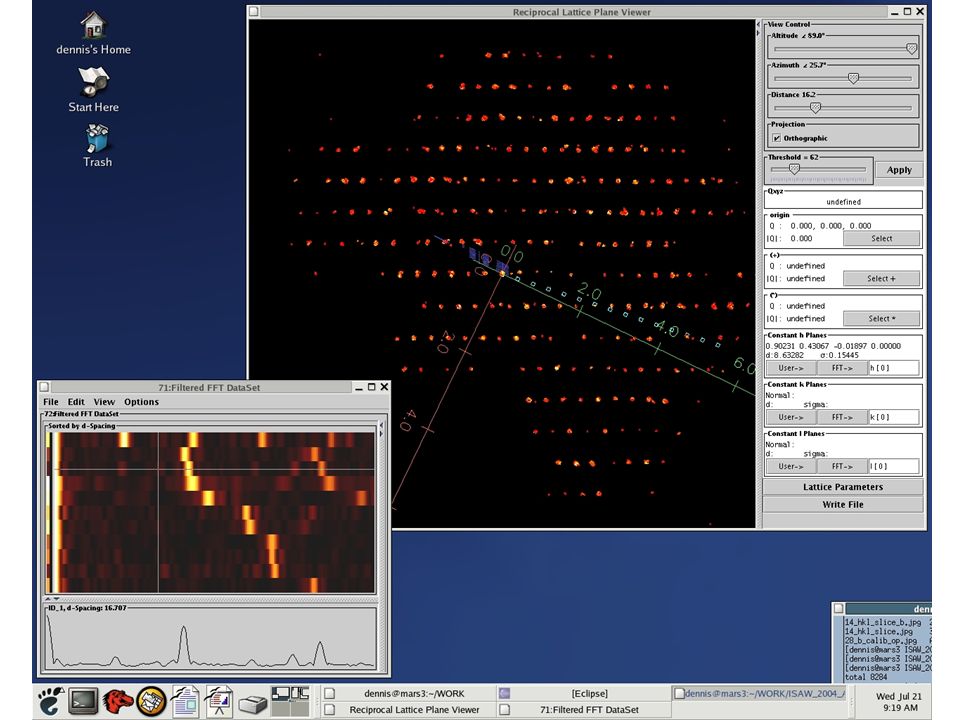
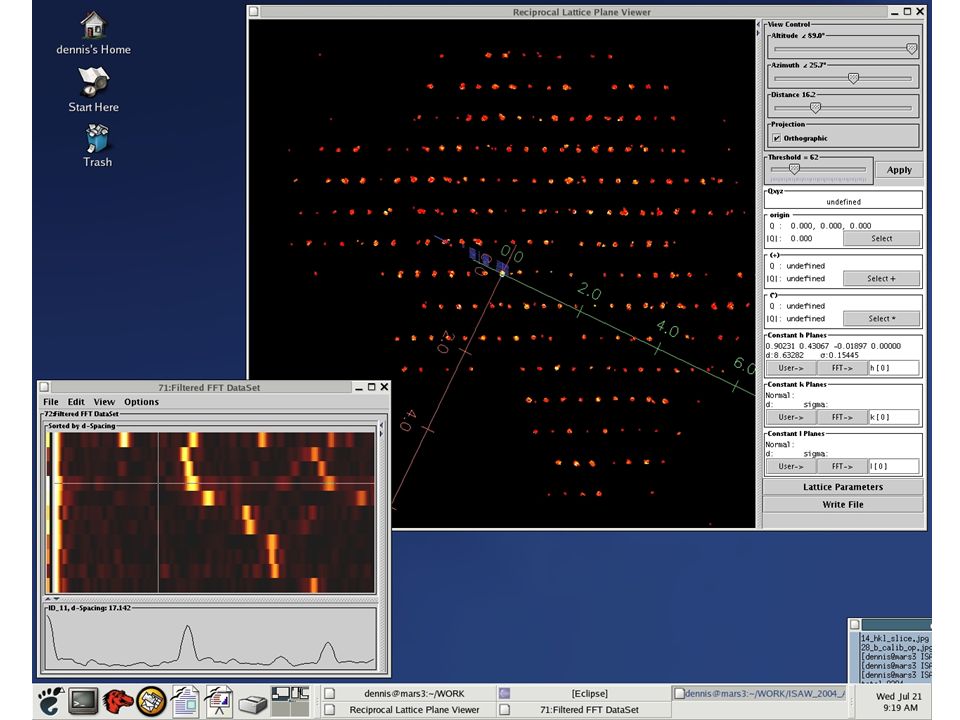
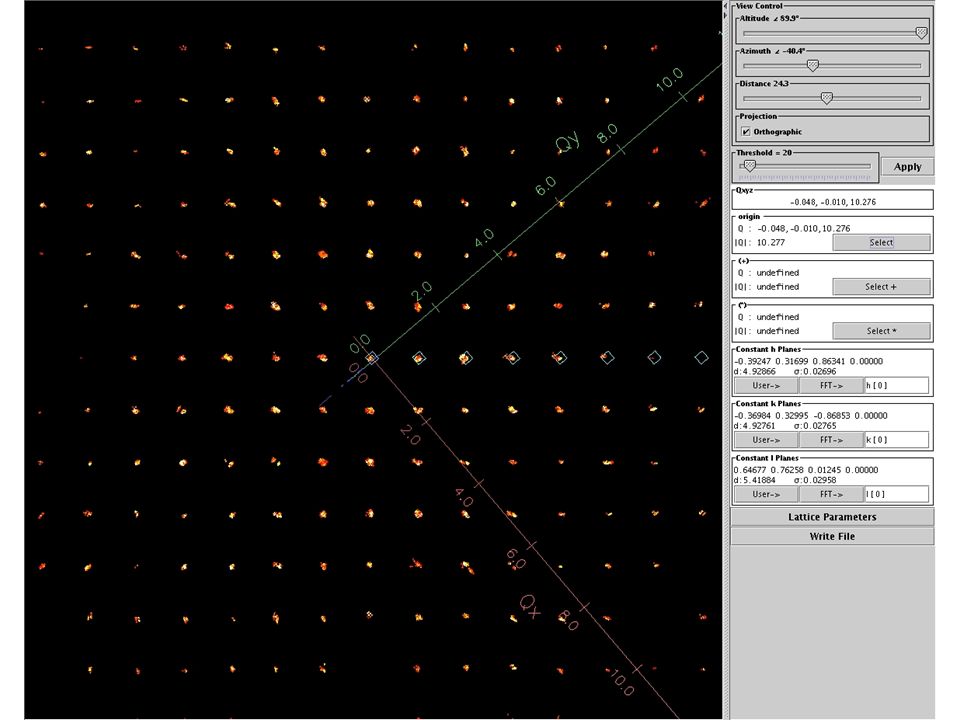
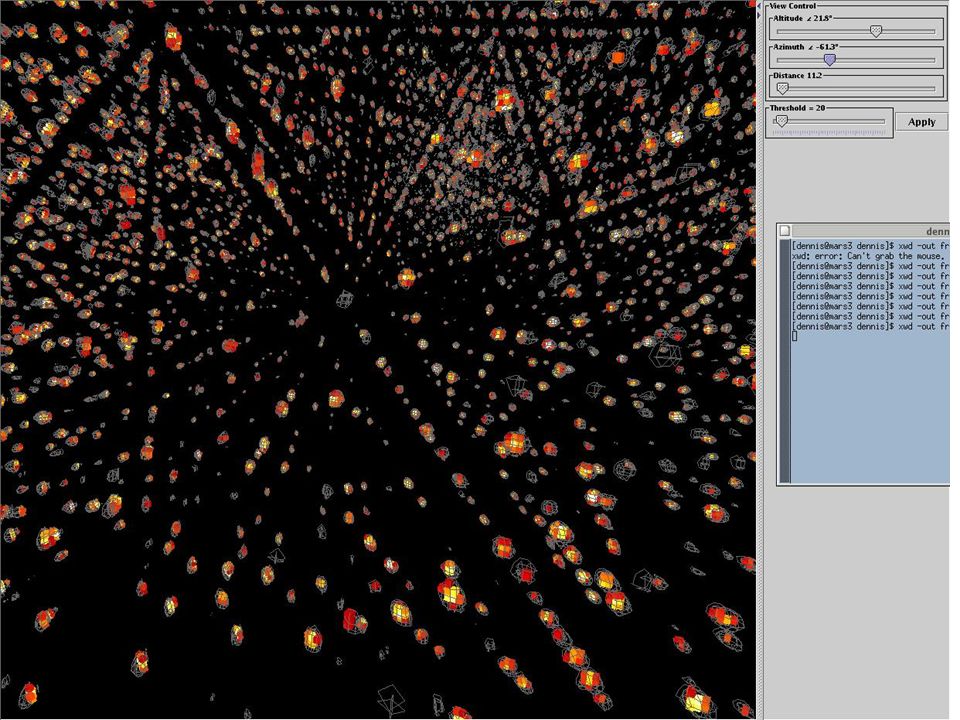
3D reciprocal space viewer Move around in 3D lattice Select planes by selecting points or FFT Filter to keep data on selected planes “Rossmann like” indexing Calculate lattice constants and orientation matrix Mark points where peaks are expected Draw region covered by data Orthogonal/perspective projection

24
Reduction Steps: Find peaks Initial indexing Scalar Least squares fit of orientation matrix Find orientation matrix for each run Integrate peaks

25
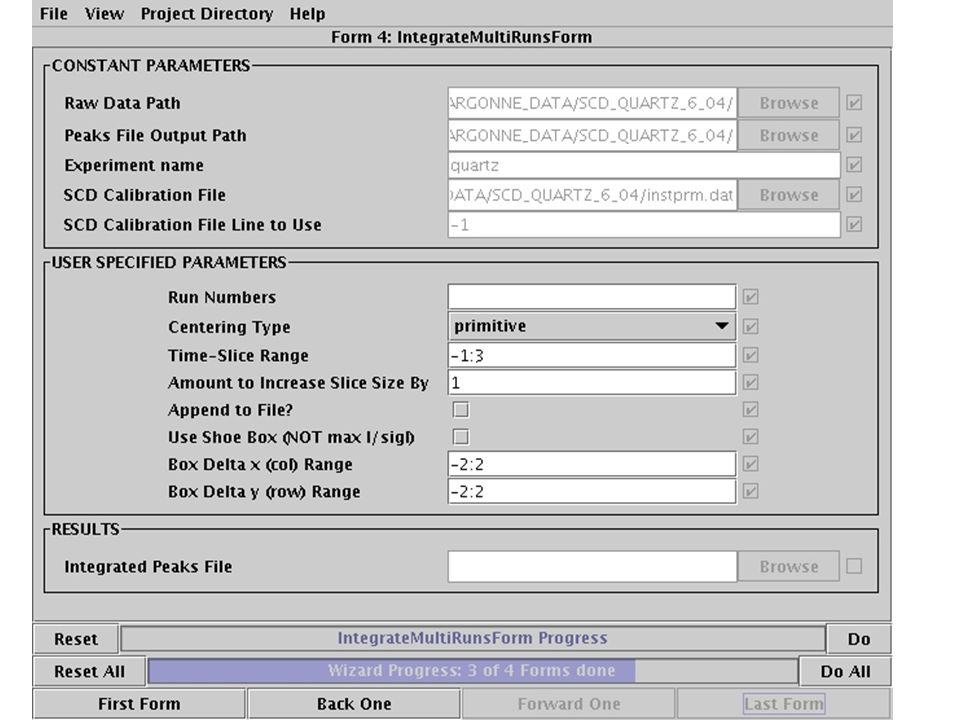
Wizards User friendly Help on each form Step forward & backward Save state to replay Easily generated from operators and scripts

34
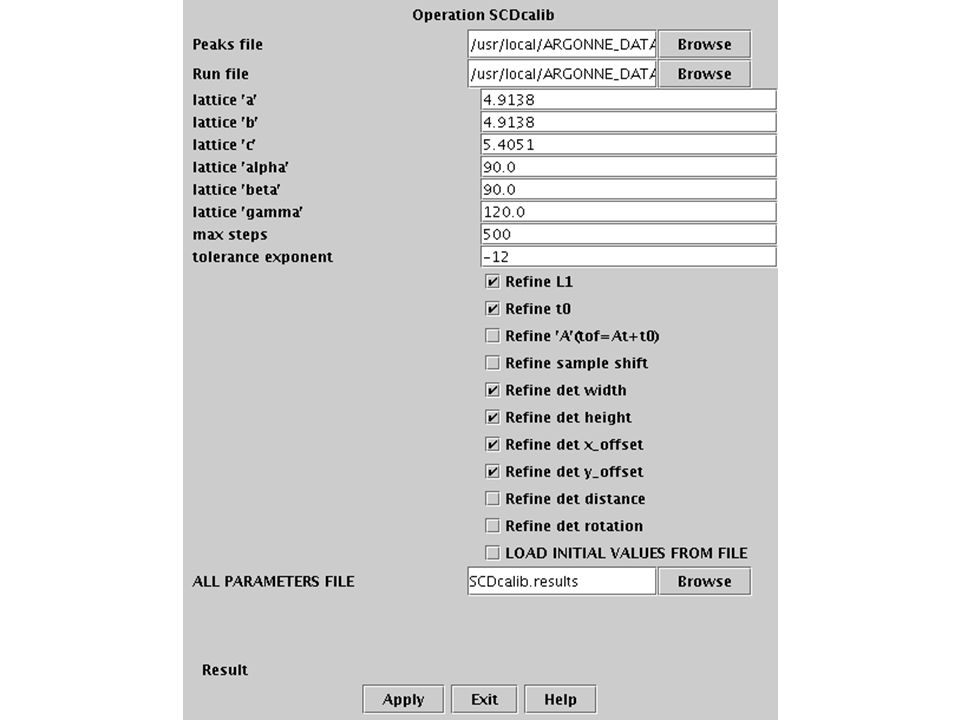
Calibration 1.Measure peaks from known sample (eg. quartz) at multiple crystal orientations to measure large region of reciprocal space. 2.Produce a collection of indexed peak positions. 3.Adjust "engineering" values for L0, t0, detector size, position, orientation and sample offset, to minimize sum-squared difference between measured and theoretical peak positions in Q.
 at multiple crystal orientations to measure large region of reciprocal space. 2.Produce a collection of indexed peak positions. 3.Adjust engineering values for L0, t0, detector size, position, orientation and sample offset, to minimize sum-squared difference between measured and theoretical peak positions in Q..")
35
Measured Peaks Map to Q In Lab Coords Qxyz Observed Map to Crystal Aligned Coords Instrument Parameters Goniometer Angles Marquardt Optimization Algorithm Sum Squared Differences h,k,l of Measured Peaks Map to Q Using UB Qxyz Theoretical B, The known Material Matrix U, The observed Rotation Matrix Least Squares Fit to find UB

39
Java "Clean" object model Good collection of GUI components Portable to Linux, Mac Ox-X, Solaris, Windows Good performance –Java: 500 Mflops –GNU C: 450 Mflops (overall scores on SciMark2 from NIST running on Linux 2.8 GHz P4, 800 Mhz FSB, using java -server)
")
40
Java-continued Support for 3D graphics hardware via –Java3D –OpenGL (jogl...) Support for networking and WWW. –Applets, Servlets, ports, CORBA,... Java doc... produces HTML documentation from comments in code. NOT single source (SUN, IBM,...) Free development tools
 Free development tools.")
41
ISAW ( Integrated Spectral Analysis Workbench ) Raw data access, visualization, reduction Developed in collaboration with IPNS Instruments –Single Crystal Diffractometers –Small Angle Diffractometers –Direct Geometry Spectrometers –Powder Diffractometers –Glass Liquid and Amorphous Material Diffractometer
 Raw data access, visualization, reduction Developed in collaboration with IPNS Instruments –Single Crystal Diffractometers –Small Angle Diffractometers –Direct Geometry Spectrometers –Powder Diffractometers –Glass Liquid and Amorphous Material Diffractometer")
42
ISAW-continued Remote data access ("LiveDataServer") Reads –IPNS runfiles –ISIS runfiles (sort of) –NeXus files (as defined) GNU GPL
 Reads –IPNS runfiles –ISIS runfiles (sort of) –NeXus files (as defined) GNU GPL")
43
ISAW structure Very modular tool kit (NOT just the GUI) Structured around basic concepts –DataSet, Data block –Viewer –Operator –Retriever –Writer Documented via javadocs, user manual, developer manual, tutorial, dynamically generated help files for operators.
 Structured around basic concepts –DataSet, Data block –Viewer –Operator –Retriever –Writer Documented via javadocs, user manual, developer manual, tutorial, dynamically generated help files for operators.")
44
Operators "Self-describing" units –parameter lists & types –documentation –used to generate pop-up dialogs & wizard forms Written in java, ISAW scripting language, jython, FORTRAN? Easily added to ISAW –write, compile and put in directory –will appear in ISAW menus –will be callable from scripts

45
Future work: "Finish" SCD visualization “Finish” support for ISIS SXD Read/Write NeXus files –benefits of portability! Extend Collaborations –SNS –DANSE –Los Alamos –ANSTO Powder Diffractometers Glass Liquid and Amorphous Material Diffractometers

46
Acknowledgements IPNS –Art Schultz –Peter Peterson (now ORNL) –Tom Worlton –John Hammonds –John Cowan –Martha Miller UW-Stout –Ruth Mikkelson –Chris Bouzek –Mike Miller University of Zaragoza –Larry Falvello National Science Foundation (DMR-0218882)
 –Tom Worlton –John Hammonds –John Cowan –Martha Miller UW-Stout –Ruth Mikkelson –Chris Bouzek –Mike Miller University of Zaragoza –Larry Falvello National Science Foundation (DMR )")
Similar presentations


 Java Virtual Machine â Core Java (API) Application Programming.>")


 ARCS Software Architecture (4 slides) SNS -- Caltech Interactions (3 slides)>")


, obtain a file containing the intensity ( I ) and standard deviation ( ( I ))>")
>")
>")