Download presentation
Presentation is loading. Please wait.

1
Jack Nguyen Xiaodong Ma 05/14/2008

2
For today Theory/Background, Testings – Jack Result, other two experiments– Xiaodong

3
OBJECTIVES OF PROJECT: OBJECTIVES OF PROJECT: Fabrication of FP Biosensors Repeated Analyze antigen/antibody (Influenza A/anti-Influenza A ) interactions Test different Techniques / Antigens MATERIALS: MATERIALS: Fiber Optic Strands, CTS Machine, Matlab, PMMA/Acetone solution, Protein G’(10µg/ml), 2% BSA in PBS, Influenza A(20µg/ml), Anti-Influenza A Ig G(20µg/ml), Distilled water, 3- aminopropyltriethoxysilane, Acetone, Ethanol, Microscope, Light, Controllable stage
 interactions Test different Techniques / Antigens MATERIALS: MATERIALS: Fiber Optic Strands, CTS Machine, Matlab, PMMA/Acetone solution, Protein G’(10µg/ml), 2% BSA in PBS, Influenza A(20µg/ml), Anti-Influenza A Ig G(20µg/ml), Distilled water, 3- aminopropyltriethoxysilane, Acetone, Ethanol, Microscope, Light, Controllable stage")
4
Budget Budget: $0, all materials provided by UML

5
Team Roles TASKSRESPONSIBILITY Lab Reports / PPT Jack, Xiaodong Fabrication of Biosensors Jack Lab Testings Jack, Xiaodong Data Analysis Xiaodong

6
Schedule Followed TASKSSTARTEND Sensors Fabrication4/01/085/13/08 Repeat Lab Testings4/01/085/13/08 Present. II/Report4/09/084/16/08 Present.III/Report4/16/085/14/08 Data Analyzation4/10/085/12/08 Test Diff. Antigens4/30/085/13/08 Analyze Diff. Anti.5/02/085/13/08 Finalization All Testings5/10/085/14/08

8
Principle of FP cavity sensor.

9
Schematic diagram showing the fringe shift

10
Schematic graph of biosensor Pro.G Influenza A Primary Antibody poly(methyl 2- methylpropenoate) Optical Fiber
 Optical Fiber")
11
Fabrication of Biosensor

12
SENSORPMMAPBS BSAWATERPro.G WATERPBSIgG Inf.APBSWATER PBSDATA Procedure

13
Time Duration Fabrication FP sensor : 30 Minutes PMMA: 2 Hours Pro.G: 1.5 Hours BSA: 1.5 Hours IgG: 1.5 Hours Influ. A: 1.5 Hours Total PBS: 5 Hours Total Hours for a typical lab test: 13-16 Hr When a lab test fails, we start all over with the FP sensor fabrication

14
Experimental setup Chiller CTS Matlab Program Biomaterials Fiber

15
Experimental setup Polymer tube Glass tube Fiber

16
Fringes in the air

17
Fringes in the PBS

18
Result I without BSA

19
Result II without BSA

20
Result III with BSA

22
Experimental setup Stage power Connector to CTS Detector Stage Sensor

23
Result

25
Experimental setup VIS Spectrometer Detector Light Source SiO 2 /Si

26
Experimental steps Wash out the dust of SiO 2 /Si substrates several times by DI water. Wash the SiO 2 /Si substrates by sonication in acetone, ethanol and DI water for 15 min, respetively. Put the cleaned and dry SiO 2 /Si substrates in 2% solution of 3- aminopropyltriethoxysilane in acetone (3-aminopropyltriethoxysilane : acetone =1 : 49 by volume ) at room temperature for 30 seconds. Measure the substrates’ spectra by VIS spectrometer after SiO 2 /Si substrates dried. Drop Pr.G’ on SiO 2 /Si substrates for 1.5 h, wash by DI water 3 times, air-dry and detect its spectra. (For comparison experiment, drop BSA on the substrates first and then wash and detect spectra.) Drop anti-Inf.A IgG on the surface for 1.5 h, wash by DI water 3 times, air-dry and test its spectra. (For comparison experiment, drop Pr.G’ on the surface with BSA and wash, dry detect spectra.) Drop Inf.A on the surface for 1.5, wash by DI water 3 times, air-dry and then measure its spectra. Analyze the spectra of two groups experiment.
 at room temperature for 30 seconds. Measure the substrates’ spectra by VIS spectrometer after SiO 2 /Si substrates dried. Drop Pr.G’ on SiO 2 /Si substrates for 1.5 h, wash by DI water 3 times, air-dry and detect its spectra. (For comparison experiment, drop BSA on the substrates first and then wash and detect spectra.) Drop anti-Inf.A IgG on the surface for 1.5 h, wash by DI water 3 times, air-dry and test its spectra. (For comparison experiment, drop Pr.G’ on the surface with BSA and wash, dry detect spectra.) Drop Inf.A on the surface for 1.5, wash by DI water 3 times, air-dry and then measure its spectra. Analyze the spectra of two groups experiment..")
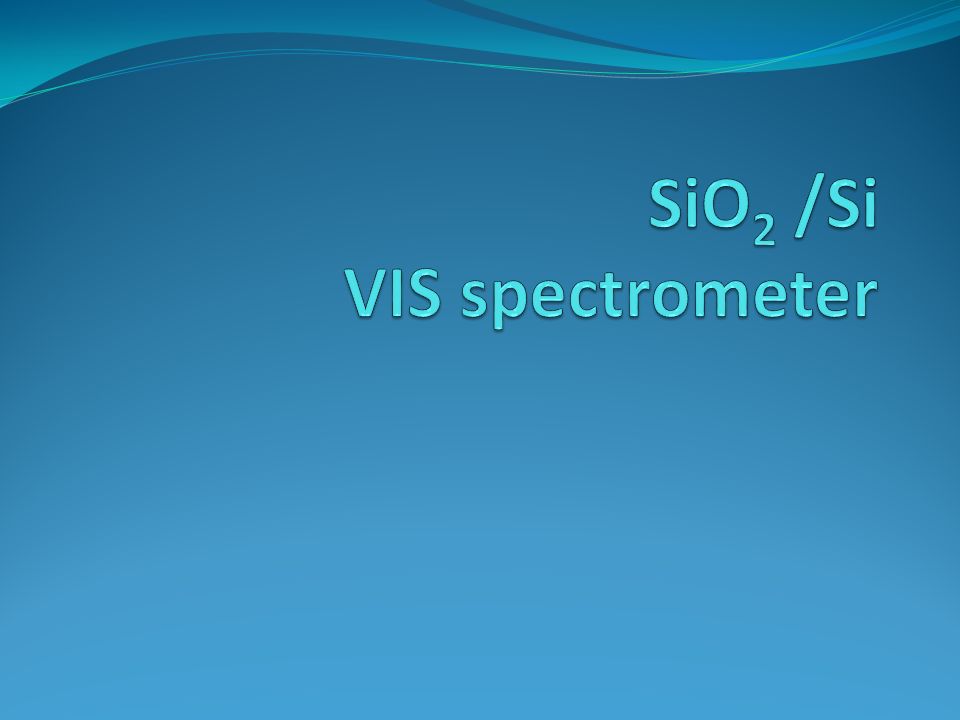
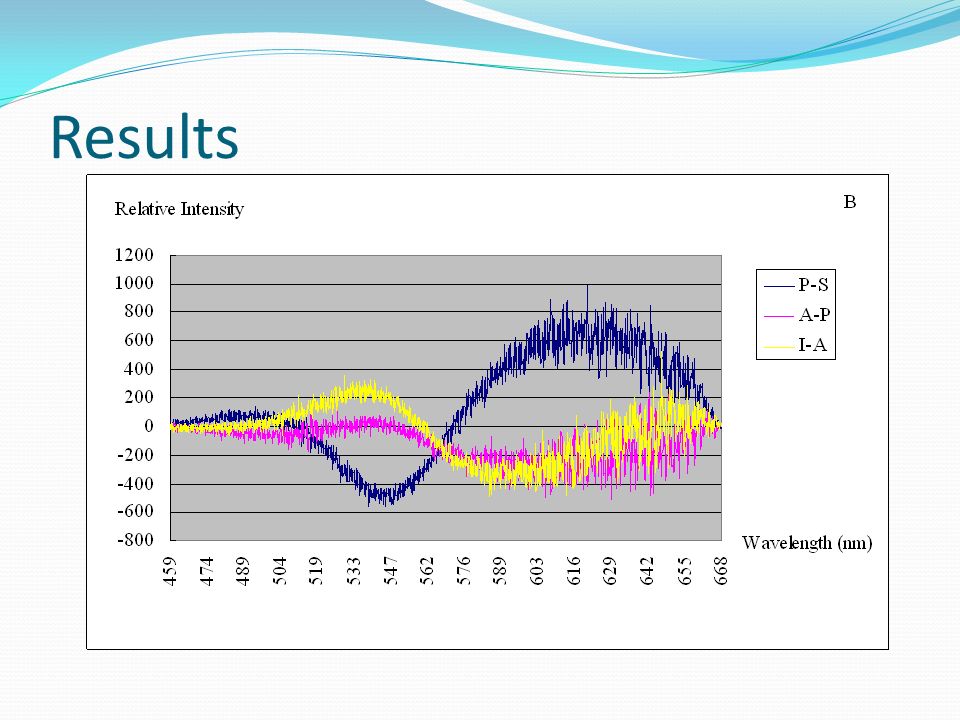
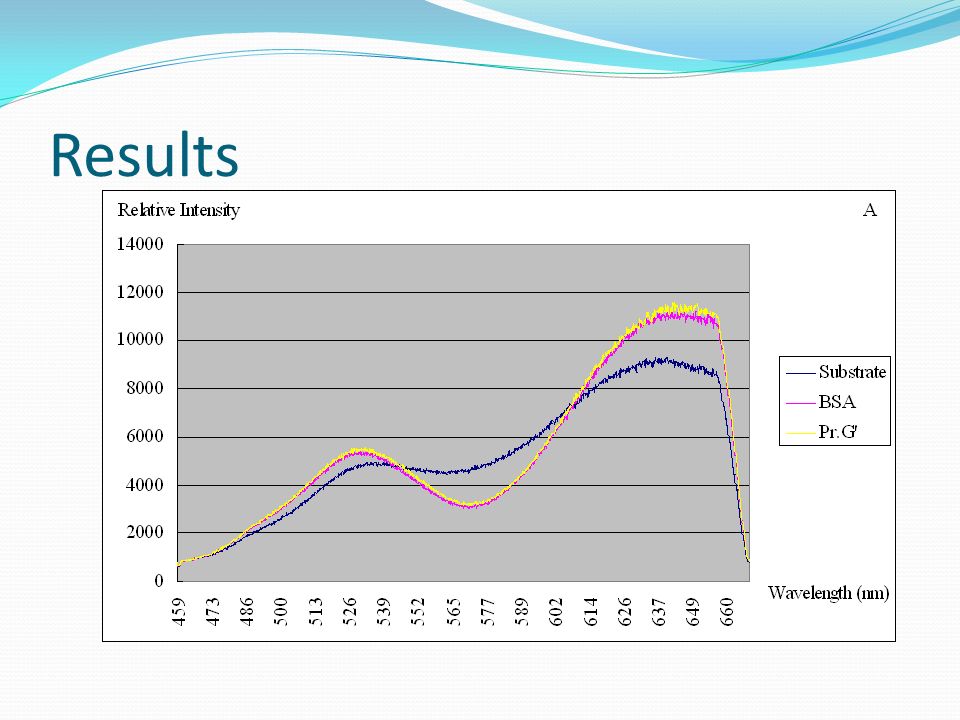
27
Results

Similar presentations


>")

i. ABO blood grouping.>")


.>")

 in microbiology. Functions : To allow us to study.>")


 The term D U is widely used to describe cells which have : a quantitative reduction.>")