Download presentation
Presentation is loading. Please wait.

1
Welcome Back! Let’s do the name tent thing again when Brye gets in, and also please hand in your ice cream flow chart.

2
Internal Process Model Monitor Role Competency: Managing Collective Performance

3
Agenda Introduction to TQI Flow chart Gladys Morgan’s check in Develop a fishbone (Ishikawa) diagram Use to make improvement recommendations
 diagram Use to make improvement recommendations")
4
Learning Goals Be able to: Apply the 3 central questions (aim, measures, changes) to real life situations Develop a flowchart of a process Develop a fishbone diagram Use these tools to make improvement suggestions
 to real life situations Develop a flowchart of a process Develop a fishbone diagram Use these tools to make improvement suggestions")
5
Variation is the enemy of quality Because it reduces our ability to predict (and control) outcomes Recall the foci of the Internal Process model…
 outcomes Recall the foci of the Internal Process model…")
6
Special Causes Due to specific circumstances Only affect people/things in a certain time period or place May take actions to restabilize the system NOT the focus of TQI

7
Common Causes Built into the system Affect everyone/thing Improvement requires changing the system itself These ARE the focus of TQI

8
Key Figures Walter A. Shewhart W. Edwards Deming Joseph Juran

9
Three Fundamental Questions Behind Trial and Learning 1.Aim 2.Measures 3.Changes

10
Aim: What are we trying to accomplish?

11
Measures: How will we know that change is an improvement? -- builds on current knowledge, using baseline data

12
Changes: What changes can we make that will result in improvement? -- explored through the cycle for learning and improvement

13
PDCA: The Cycle for Learning and Improvement Plan Do Check (Study) Act
 Act")
14
Building Long Term Improvements Repeated use of PDCA cycle Maximizing system performance –Why top management is key Data driven (includes feelings) Testing on a small scale –across a wide range of conditions Continuous Quality Improvement
 Testing on a small scale –across a wide range of conditions Continuous Quality Improvement")
15
Your TQI Tool Kit: Process Watch/Walk Flow Chart Fishbone (Ishikawa) Diagram Control Chart
 Diagram Control Chart")
16
A Process Is … A series of actions that repeatedly transform inputs into outputs

17
Process Walk/Watch Senior management walk through process Observing, discussing at the task level Tool for increasing process knowledge –IBM managers and mainframe computers

18
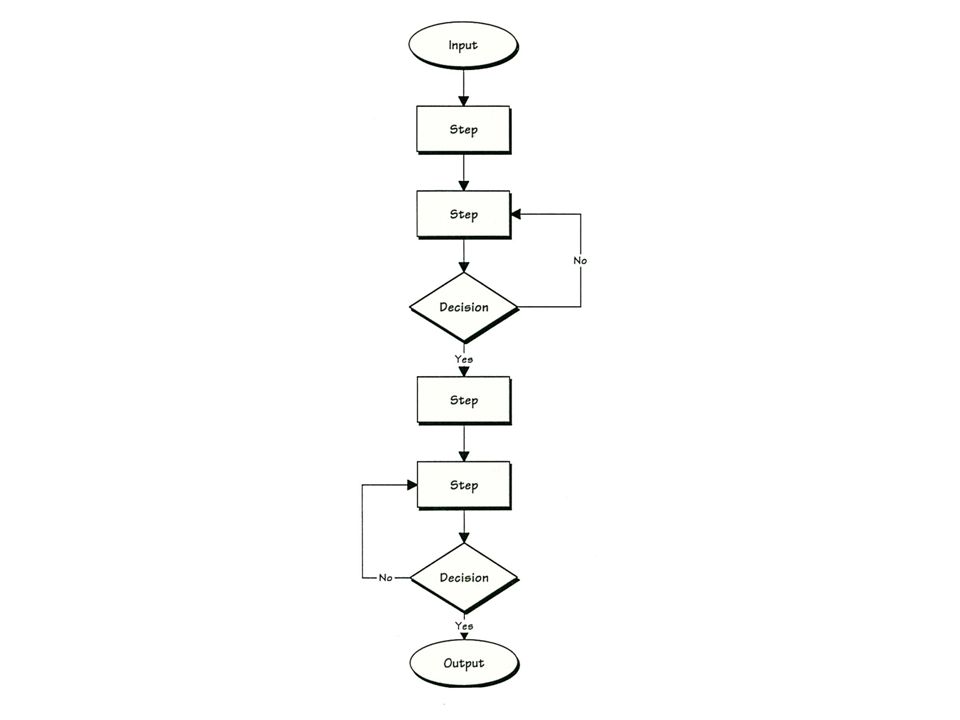
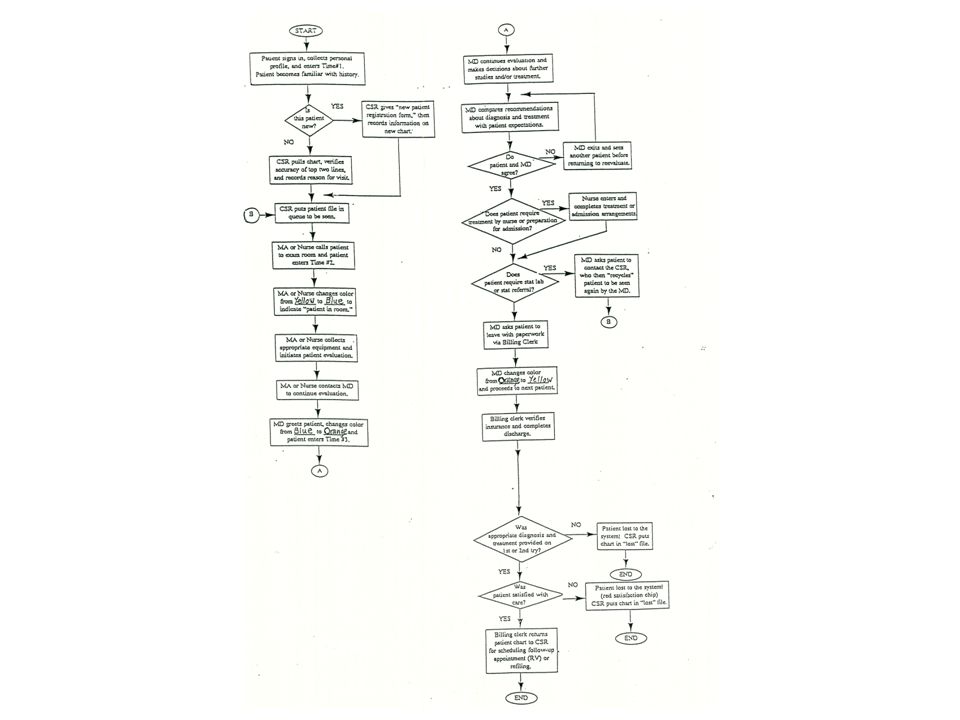
Flowcharting: Picturing the Sequence A/1

21
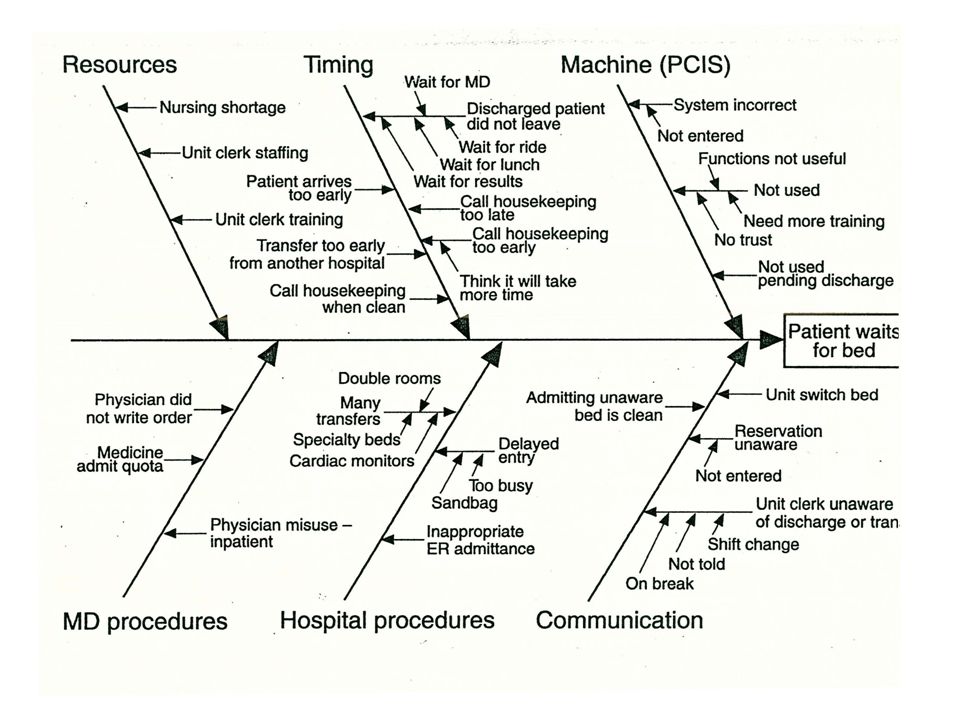
Fishbone/Cause-and-Effect (Ishikawa) Identify causes of process problems Focus on facts Dispersion analysis uses cause categories –Policies- People –Procedures- Environment –Plant Process clarification uses steps
 Identify causes of process problems Focus on facts Dispersion analysis uses cause categories –Policies- People –Procedures- Environment –Plant Process clarification uses steps")
22
People Environment Outcome Policies Procedures Plant Cause and Effect Diagram

24
Coming Up Thursday meet in Pollack laptop library –Control charts –Bring Memory Jogger –Read starting p. 36 about control charts Next Tuesday integration

Similar presentations


>")

 Process control (for Sporadic problems)>")

