Download presentation
Presentation is loading. Please wait.

1
Waushara COUNTY Waushara COUNTY DEMOGRAPHIC OVERVIEW 2008 Waushara County

2
Geography, Human Activity 18 Towns, 6 Villages, & 1¼ Cities “1/3, 1/3, 1/3” Central Wisconsin 626 square miles

3
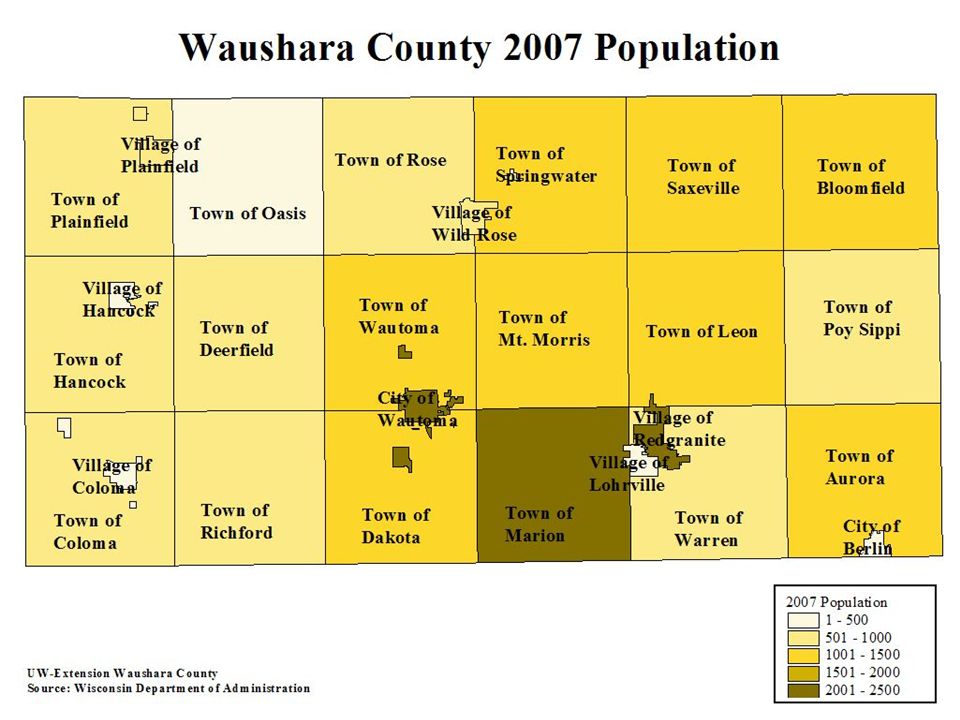
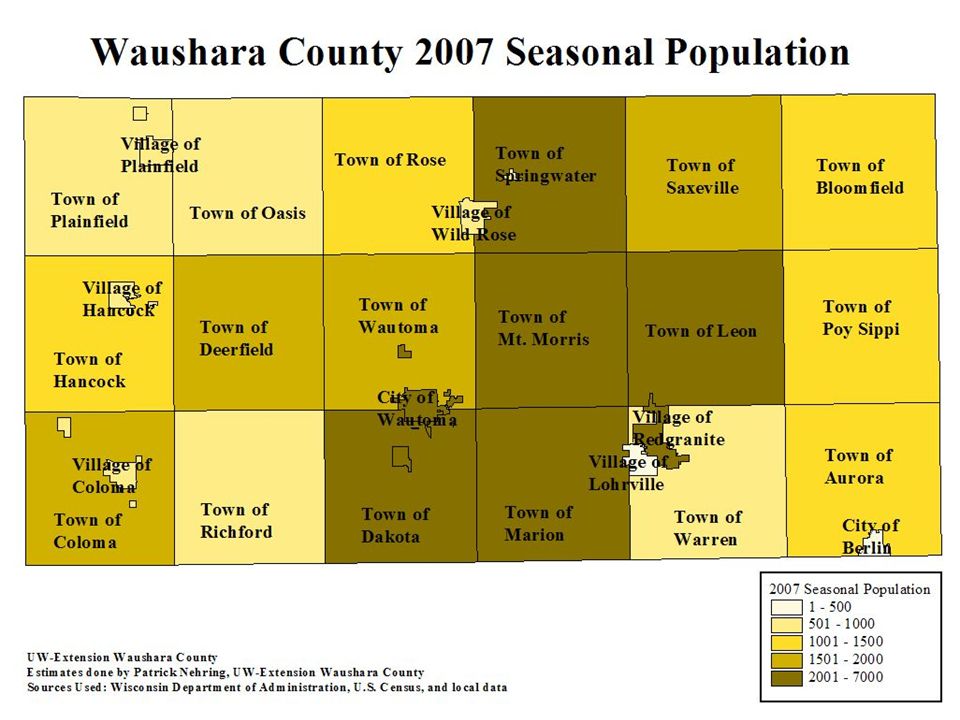
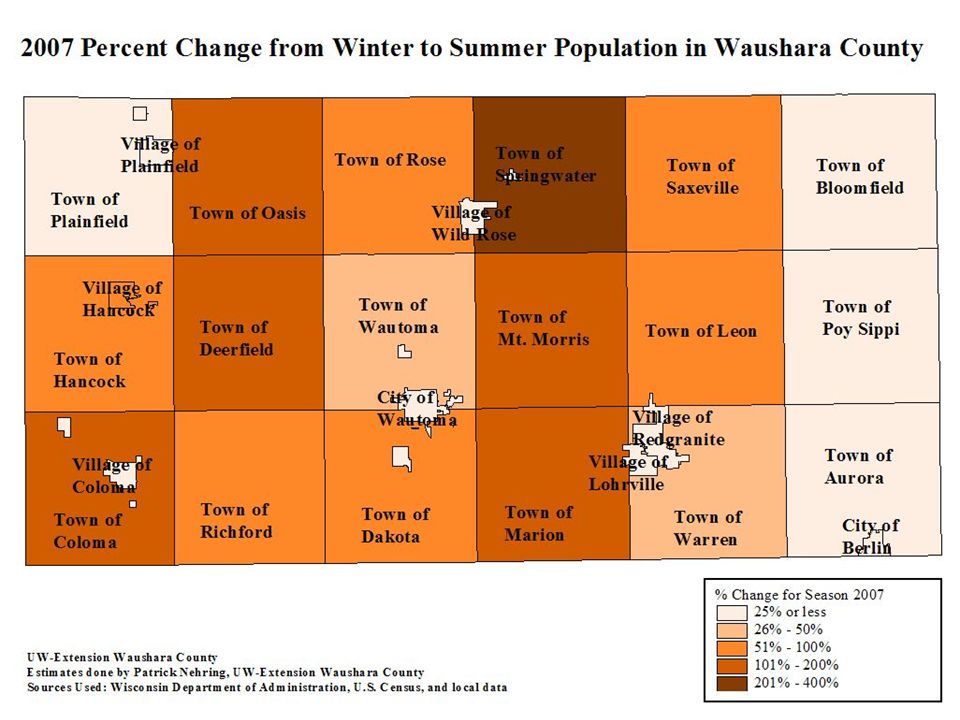
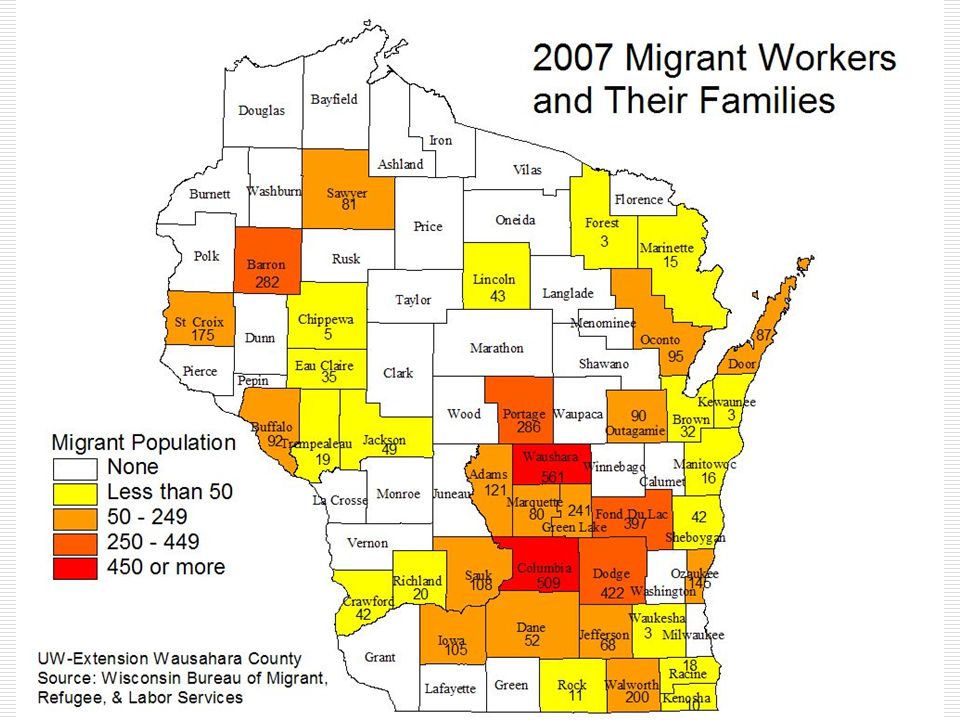
Population, Race, and Ethnicity Trends Official 2007 Population Estimate: 25,215 Wisconsin Department of Administration Estimated 2007 Seasonal Population: 44,371 Estimates calculated by Patrick Nehring, UW-Extension Waushara County using U.S. Census, Wisconsin Department of Administration, and local data 2007 Migrant Worker Population, includes workers and family members : 561 Bureau of Migrant, Refugee, and Labor Services Estimated 2020 Population: 27,726 Wisconsin Department of Administration

4
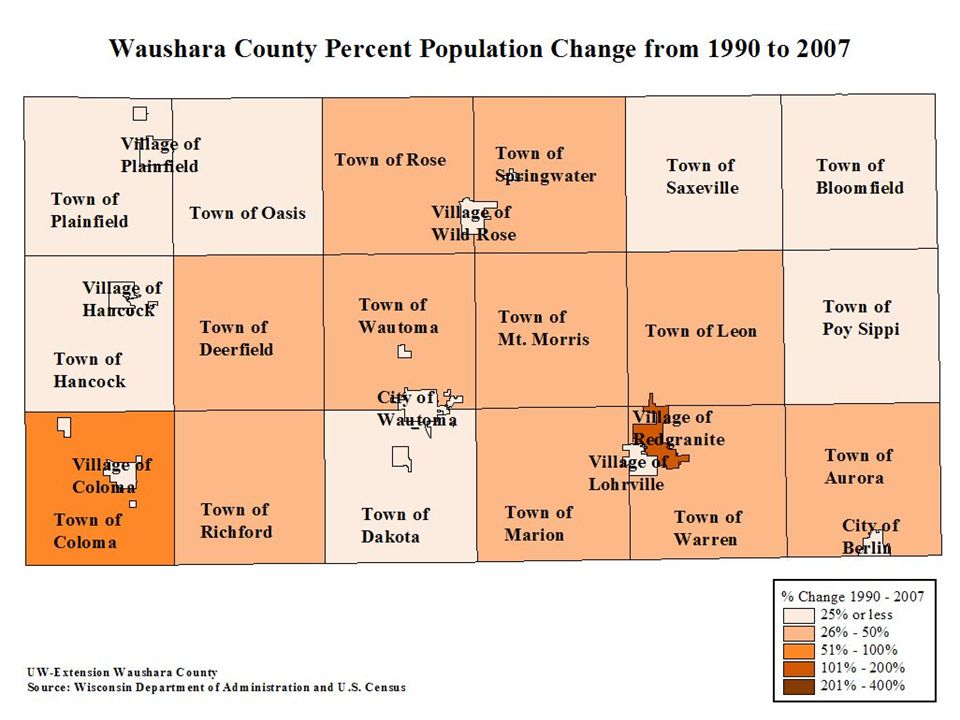
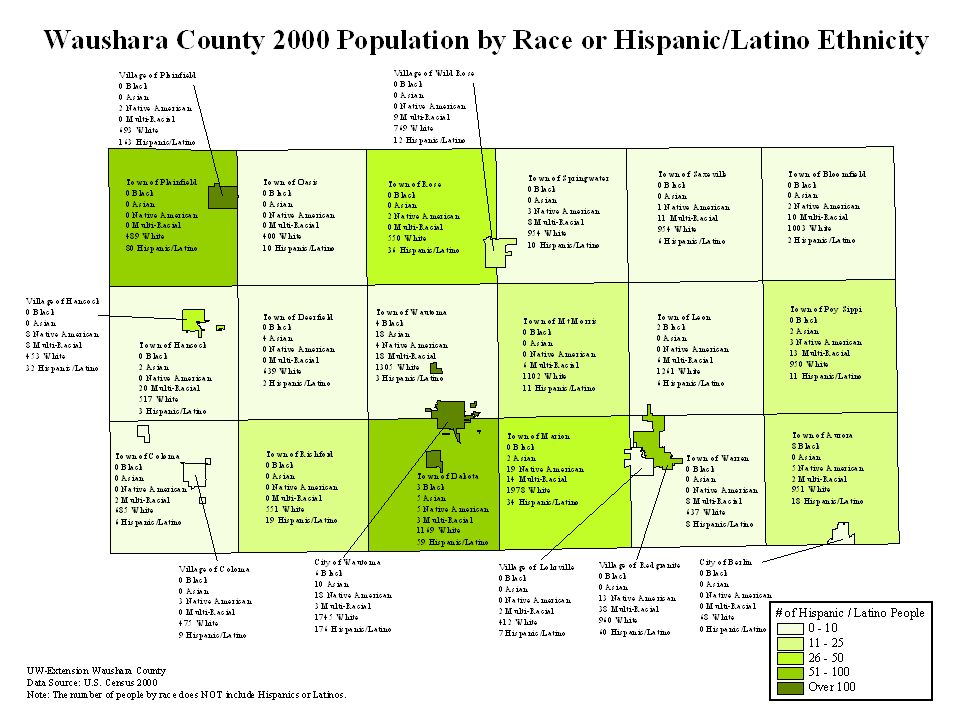
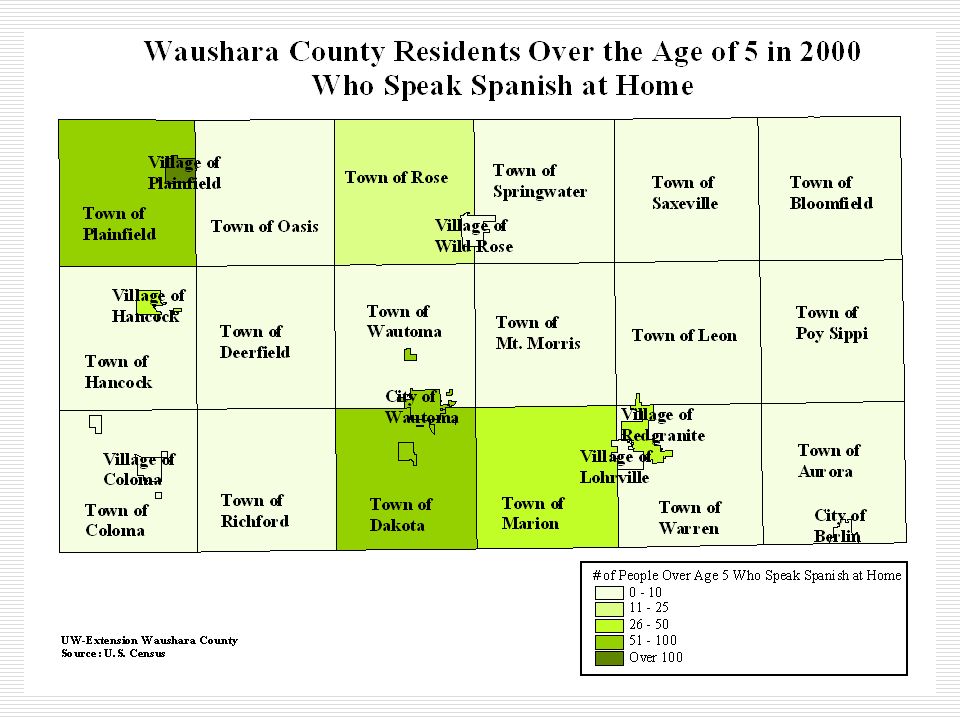
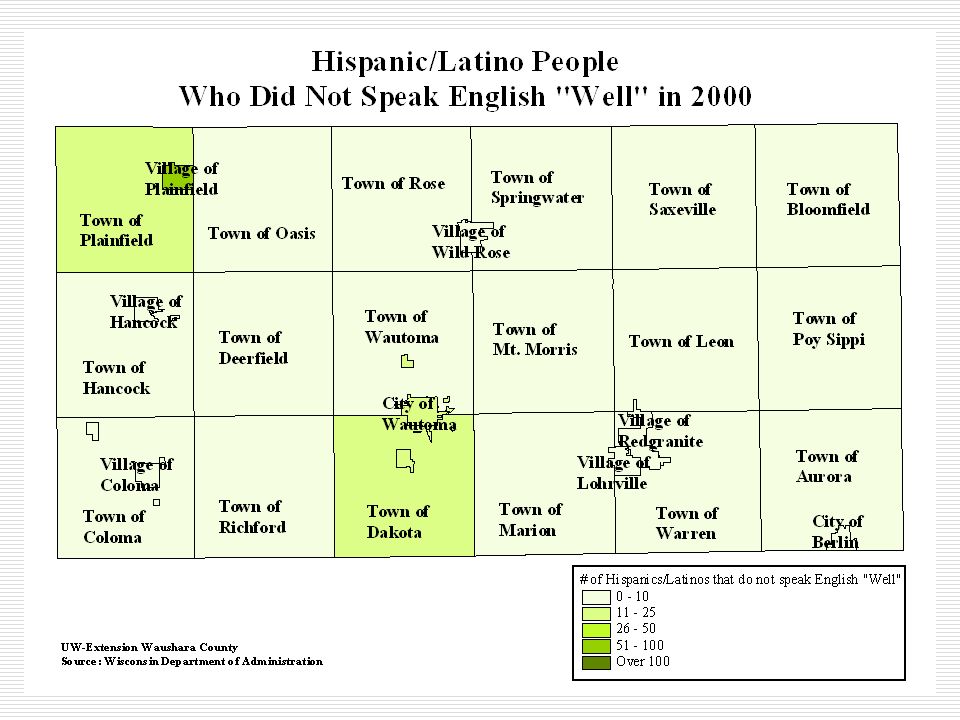
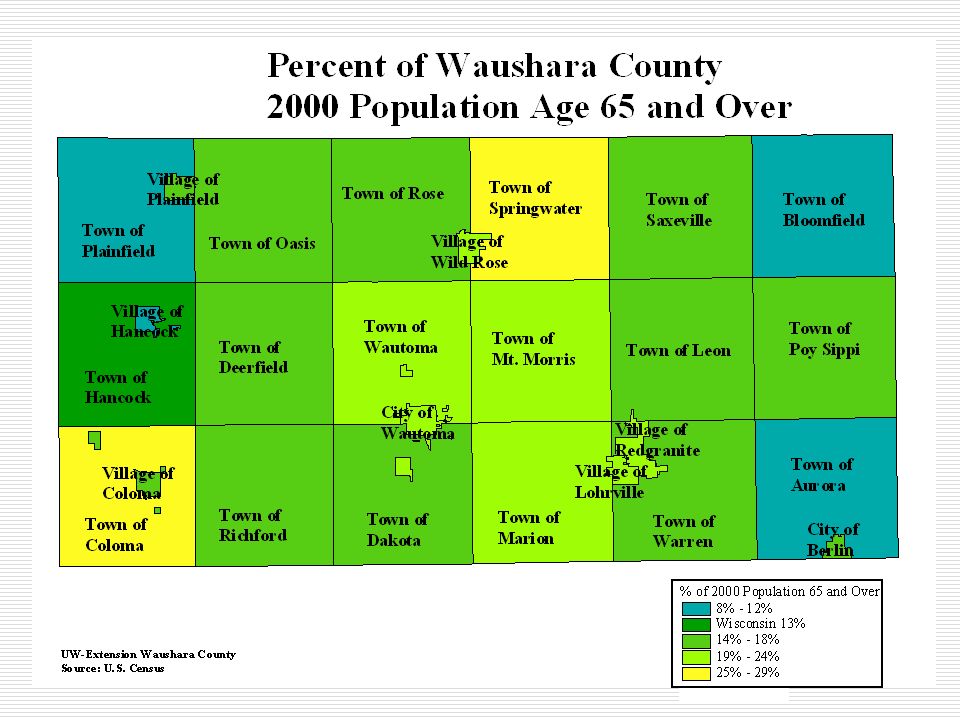
Population, Race, and Ethnicity Trends Waushara County has a significant elderly population, 18.3% of the population in Waushara County compared to 15.2% of Wisconsin’s population are 65 and older. U.S. Census Bureau 2007 Population Estimate Hispanic/Latino is the largest racial/ethnic minority group in Waushara County. This population has increased from 2.0% of the population or 379 people in 1990 to 5.1% of the population or 1,206 people in 2007. U.S. Census Bureau 1990 Census and 2007 Population Estimate

12
Number of Migrant Workers, Their Spouses, and Their Children Source: Bureau of Migrant, Refugee, and Labor Services

13
Population by Race Source: U.S. Census Bureau 2007 Estimates

14
Population by Ethnicity Source: U.S. Census Bureau 2007 Estimates

18
Percent of Waushara County Hispanic/Latino Population that speak English and/or Spanish Source: U.S. Census 2000 Note: Spanish Only, includes Hispanic/Latinos that speak English “not at all” or “ not well”

19
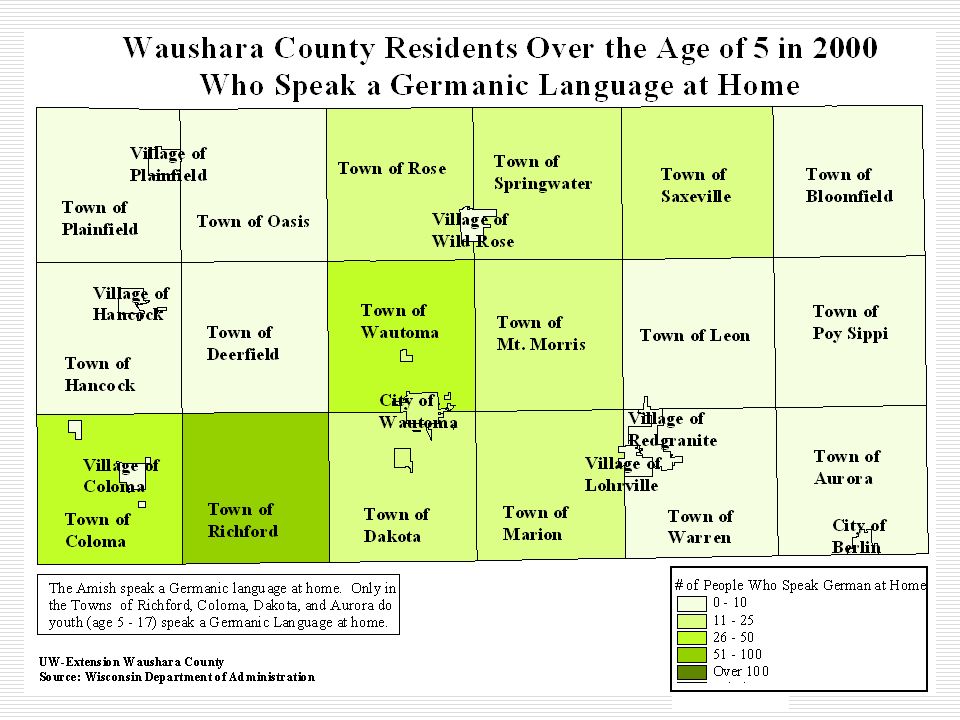
2000 Percent of Waushara County Population by Ethnic Heritage German 48% Polish 11% Irish 10% English 8% Norwegian 6% French 4% Hispanic/Latino 4% Mexican 3% Italian 3% Source: U.S. Census 2000

21
Number of Adherents Claimed by Various Religious Bodies in Waushara County in 2000 Catholic Church: 3,936 Evangelical Lutheran Church in America: 2,460 Lutheran – Missouri Synod: 1,380 United Methodist Church: 1,251 Wisconsin Evangelical Lutheran Synod: 650 Assembly of God: 455 New Testament Association of Independent Baptist Churches and other Fundamental Baptist Assoc./Fellowships: 276 United Church of Christ: 257 Evangelical Free Church of America: 200 Wesleyan Church: 140 Old Order Amish: 132 National Association of Congregational Christian Churches: 74 Presbyterian Church (USA): 65 General Association of Regular Baptist Churches: 65 Conservative Congregational Christian Conference: 45 Mennonite: 40 Religious Congregations and Membership in the United States 2000 Association of Statisticians of American Religious Bodies (ASARB) Total number of reported members from churches/religious bodies in the county equals about 50% of the population, 11,510.
: 65 General Association of Regular Baptist Churches: 65 Conservative Congregational Christian Conference: 45 Mennonite: 40 Religious Congregations and Membership in the United States 2000 Association of Statisticians of American Religious Bodies (ASARB) Total number of reported members from churches/religious bodies in the county equals about 50% of the population, 11,510.")
22
2006 Waushara County Population by Age Source: Wisconsin Department of Health and Family Services

24
Education In Waushara County in 2000, 21% of the population over age 25 is without a high school diploma, and 12% of the population has bachelors or graduate degrees. In the same year the reverse was true for the whole state of Wisconsin, 15% of the population over age 25 did not have a high school diploma, and 22% of the population had bachelors or graduate degrees Source: 2000 US Census

25
2000 Waushara County Population, Age 25 and Over by Education Attainment Source: U.S. Census 2000

26
2004 Self-sufficiency Wage Adams County$11.05 Green Lake County$13.14 Waushara County$13.21 Waupaca County $13.21 Marquette County $13.78 Source: UW-Extension Wisconsin Food Security Project Website 2004 Average Hourly Wage$11.43 Source: Wisconsin Department of Workforce Development

27
2007 Wages Average Annual Wage Waushara County: $26,453 Adams County: $27,485 Green Lake County: $30,040 Marquette County: $26,121 Portage County: $33,117 Waupaca County: $30,499 Winnebago County: $40,957 Source: Wisconsin Department of Workforce Development

28
Benefits Benefits offered by Employers in Waushara County Paid vacations (84.1%) Health insurance to employee (63.5%) Health insurance to family (53.2%) Retirement Plan (48.4%) Benefits received by workers residing in Waushara County Health insurance to employee (57.0%) Health insurance to family (54.7%) Paid vacations (54.0%) Pension Plans (44.3%) 70% of Waushara County workers said health insurance was most important to them Source: Labor Market Conditions in Waushara County 2001 UW-Extension and Waushara County Economic Development Corporation
 Health insurance to employee (63.5%) Health insurance to family (53.2%) Retirement Plan (48.4%) Benefits received by workers residing in Waushara County Health insurance to employee (57.0%) Health insurance to family (54.7%) Paid vacations (54.0%) Pension Plans (44.3%) 70% of Waushara County workers said health insurance was most important to them Source: Labor Market Conditions in Waushara County 2001 UW-Extension and Waushara County Economic Development Corporation")
29
Workforce 2007 Average Unemployment Rate was 5.4%. The Wisconsin unemployment rate was 4.9%. Source: Wisconsin Department of Workforce Development 48% of employed Waushara County residents, over age 16, work outside of the county. Source: 2000 US Census

30
Employees Working in Waushara County – County of Residence Waushara County Employed Residents – County of Employment

31
Live in: Work in: Count:Travel to: From: Count: Waushara Co. WI Waushara 5,398 Winnebago 1,162 Portage 334 Green Lake 926 Green Lake 224 Waupaca 654 Marquette 217 Portage 505 Winnebago 163 Outagamie 321 Waupaca 131 Marquette 317 Adams 106 Fond du Lac 277 Wood 53 Adams 105 Milwaukee 35 Wood 91 Outagamie 30 Milwaukee 86 Elsewhere 204 Dodge 57 Grand Total 6,895 Dane 45 Waukesha 45 Washington 37 Brown 35 Cook Co. IL 31 Elsewhere 196 Grand Total 10,288 Source: U.S. Census 2000 2000 Worker Flow

32
Waushara County Businesses Total of approximately 2,036 non-farm business establishments in 2006 503 Establishments have 1 or more employees, totaling 4,692 jobs (In 2000: 522 Establishments with 4,413 jobs) U.S. Census - County Business Patterns 89% have 1-19 employees 1,533 Non-employer Establishments (1,187 Establishments in 2000, a 29% increase) U.S. Census – Nonemployer Establishments 717 Farms in 2002 (634 Farms in 1997) National Agriculture Statistics Service – Census of Agriculture 156 Farms employ 2,752 hired workers (In 2000: 194 Farms with 2,659 hired workers)
 U.S. Census – Nonemployer Establishments 717 Farms in 2002 (634 Farms in 1997) National Agriculture Statistics Service – Census of Agriculture 156 Farms employ 2,752 hired workers (In 2000: 194 Farms with 2,659 hired workers).")
33
Taken from the 2005 Waushara County Health Profile at: http://dhs.wisconsin.gov/localdata/pdf/05pubhlth/waushara05.pdf 5,542 children under the age of 18 241 births, 30% to single mothers 29 births are to teenage mothers 25% of births are to mothers w/o high school diploma About 648 children, birth-4 receive WIC 45% of children on F&R Lunch program 2005 Data for Children Living in Waushara County

34
Median Family Income - Waushara County versus State of Wisconsin Sources: U.S. Census Data 1980, 1990, 2000 and 2008 Wisconsin Council on Children and Families Web Site

35
Family Income in 1999 US Housing and Urban Development and US Census 2000

36
Poverty Percent of 2005 population that live below poverty Waushara County = 10.3% Wisconsin = 10.2%. Percent of the 2005 population under age 18 in poverty Waushara County = 16.4% Wisconsin = 14.0% US Census Bureau Small Area Income & Poverty Estimates Percent of the 2000 population over age 65 in poverty Waushara County = 10.8% Wisconsin = 7.4% US Census Bureau Small Area Income & Poverty Estimates

37
Poverty Distribution

38
2006 Area County Comparison Percent of population receiving Food Stamps Source: UW Extension Food Security Project Web site

39
Food Stamp Participation Estimates for Permanent Residents Source: Wisconsin Department of Health and Family Services, 2008

40
Food Share Case Load Recipients by Calendar year & Season: Source: Wisconsin Department of Health and Family Services, 2008 http://dhs.wisconsin.gov/em/rsdata/fs-caseload-recip-by-cy.htm

42
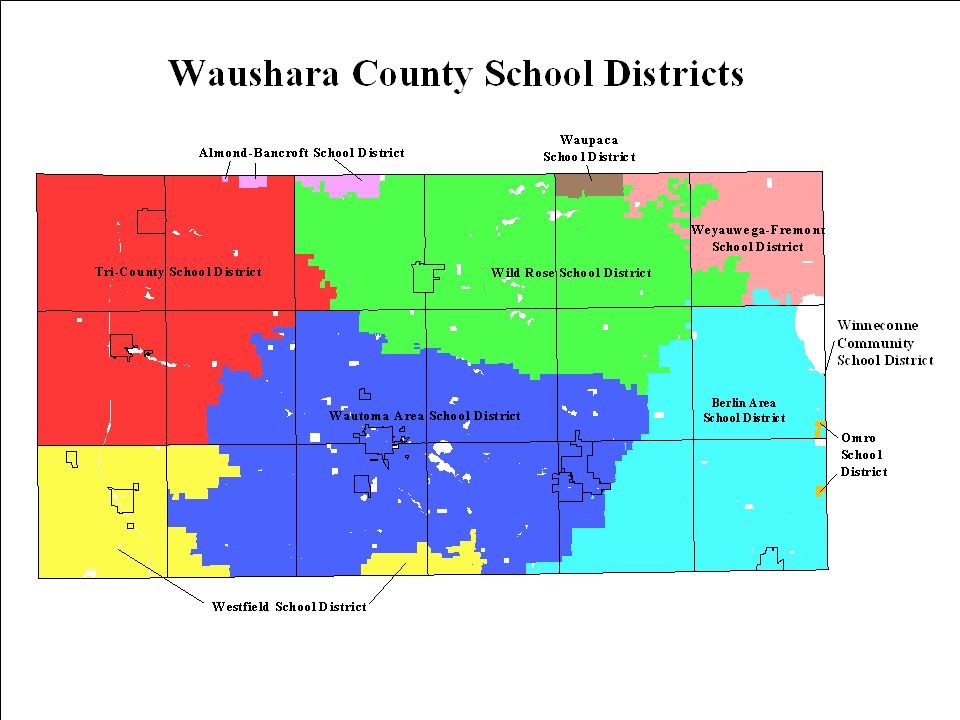
Percent Receiving Free & Reduced Lunches by School Source: UW Extension Food Security Project Web site & DPI

43
K-12 Population by Racial Characteristics Public School Districts in Waushara County Source: Wisconsin Department of Public Instruction 2002-2003 2007-2008

44
Additional Sources for Statistics about Waushara County and Beyond Internet Sources Of Demographic and Economic Data For Communities in Wisconsin by Patrick Nehring, UW-Extension Waushara Cnty www.uwex.edu/ces/cty/waushara/cnred/stats.html www.uwex.edu/ces/cty/waushara/cnred/stats.html Applied Population Laboratory www.ssc.wisc.edu/poplab/index.html WisStat www.wisstat.wisc.edu/ www.wisstat.wisc.edu/

45
For More Information Contact: Waushara County P.O. Box 487 209 S. Ste Marie Street Wautoma, WI 54982 (920) 787-0416
")
46
Groups who received this PowerPoint: County Board of Supervisors Redgranite Economic Development Committee God’s People In Action (a faith-based not-for-profit group) Department of Workforce Development Staff W2 Steering Committee Agriculture Day Participants Job Center Employee Relations Team Employees of Coldwell Banker Realty Department of Human Services Area School District Representative Extension Education Committee Luther Olson & Louis Molepske: Representatives to the Assembly Bob Welch & Julie Lassa: State Senators Safe & Stable Families Committee Waushara County Representative for Alzheimer’s Association
 Department of Workforce Development Staff W2 Steering Committee Agriculture Day Participants Job Center Employee Relations Team Employees of Coldwell Banker Realty Department of Human Services Area School District Representative Extension Education Committee Luther Olson & Louis Molepske: Representatives to the Assembly Bob Welch & Julie Lassa: State Senators Safe & Stable Families Committee Waushara County Representative for Alzheimer’s Association")
Similar presentations