Download presentation
Presentation is loading. Please wait.

1
Internal migration flows in Northern Ireland: exploring patterns and motivations in a divided society Gemma Catney PhD Research Student Centre for Spatial Territorial Analysis and Research (C-STAR) School of Geography, Archaeology and Palaeoecology (GAP) Queen’s University, Belfast UPTAP Session 2, RGS-IBG Annual Conference, 2006
 School of Geography, Archaeology and Palaeoecology (GAP) Queen’s University, Belfast UPTAP Session 2, RGS-IBG Annual Conference, 2006")
2
Residential Segregation in Northern Ireland Religious residential segregation in NI – media and academic research New academic research pointing towards residential segregation as either decreasing or staying the same However, large geographic variations, with some increases in segregation in particular areas, and persistence in others But why?

3
Internal migration in Northern Ireland In situ growth and/or migration Simpson (2004), in Urban Studies Migration – reinforcement, erosion, creation of residential segregation? How far is community background important in migration decision-making? Under-explored and little understood

4
Presentation outline The geography of migration in NI Migration rates Mobility differentials Internal migration and residential segregation Migration rates by community background Global regression: demographic composition and migration Local regression (GWR) Before and after migration Segregation indices, etc. Further work: current and future Conclusions

5
Methodology in brief QUANTITATIVE Migration rates and differentials Geographically weighted regression (GWR) SI modelling DATA SOURCES Census of pop. of NI (2001) Census grid square data (1971-2001) Residents (movers and non-movers) Key informants (community reps, property developers, etc.) QUALITATIVE Semi- structured interviews Focus groups Cognitive Mapping
 Census grid square data ( ) Residents (movers and non-movers) Key informants (community reps, property developers, etc.) QUALITATIVE Semi- structured interviews Focus groups Cognitive Mapping.")
6
In- and out-migration Inflow rate (per 1000 pop.) Outflow rate (per 1000 pop.)
 Outflow rate (per 1000 pop.)")
7
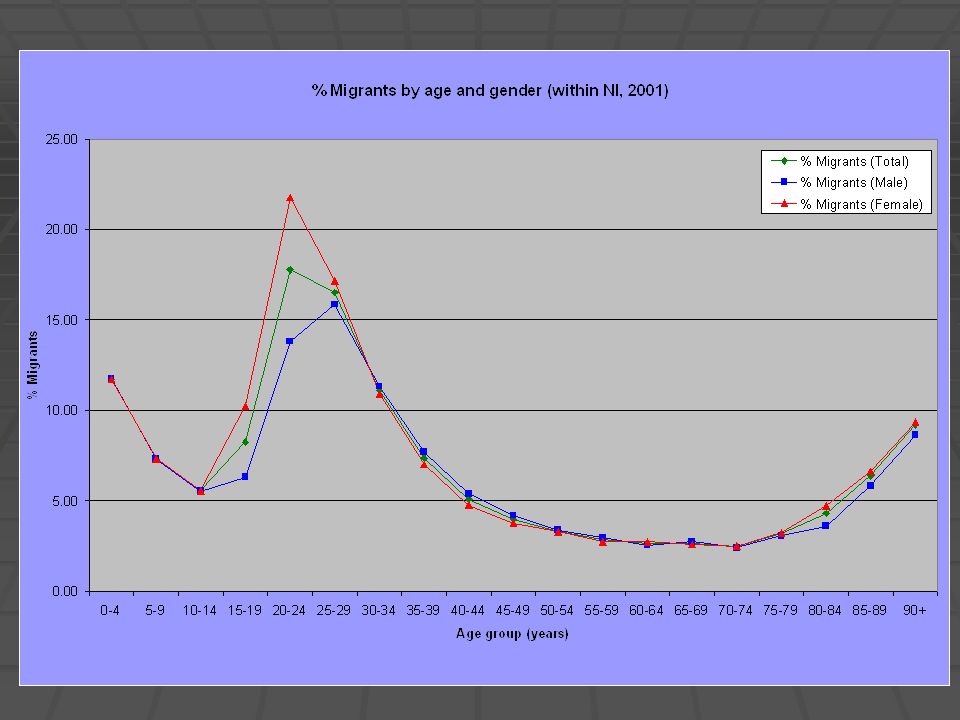
VariableMost mobileLeast mobile Age20-24 (17.77%)65-74 (2.56%) GenderFemale (7.89%)Male (7.29%) Community backgroundProtestant (7.50%)Catholic (7.49%) ReligionCatholic (7.19%)Protestant (7.11%) Marital status Separated (but still legally married) (13.71%) Widowed (4.37%) Economically active Economically active (8.56%) Economically inactive (6.50%) Economic activity Full-time student (17.29%) Self-employed (5.49%) Economic inactivity Student (11.00%) Retired (2.59%) QualificationsHigher level qualifications (10.86%) No qualifications (4.79%) Limiting long-term illness (LLTI) No LLTI (8.03%)LLTI (5.92%) Family statusNot in a family (12.16%)In a couple family (5.78%) Ethnic groupOther ethnic group (11.57%)White (7.57%) Resident typeLiving in a communal establishment (24.78%) Living in a household (7.32%)
65-74 (2.56%) GenderFemale (7.89%)Male (7.29%) Community backgroundProtestant (7.50%)Catholic (7.49%) ReligionCatholic (7.19%)Protestant (7.11%) Marital status Separated (but still legally married) (13.71%) Widowed (4.37%) Economically active Economically active (8.56%) Economically inactive (6.50%) Economic activity Full-time student (17.29%) Self-employed (5.49%) Economic inactivity Student (11.00%) Retired (2.59%) QualificationsHigher level qualifications (10.86%) No qualifications (4.79%) Limiting long-term illness (LLTI) No LLTI (8.03%)LLTI (5.92%) Family statusNot in a family (12.16%)In a couple family (5.78%) Ethnic groupOther ethnic group (11.57%)White (7.57%) Resident typeLiving in a communal establishment (24.78%) Living in a household (7.32%)")
9
Internal migration and residential segregation: solving the problem Count (area) data Global regression – demographic composition and migration Geographically Weighted Regression Before and after migration Segregation indices and conc. profiles % Differences (CB)
.")
10
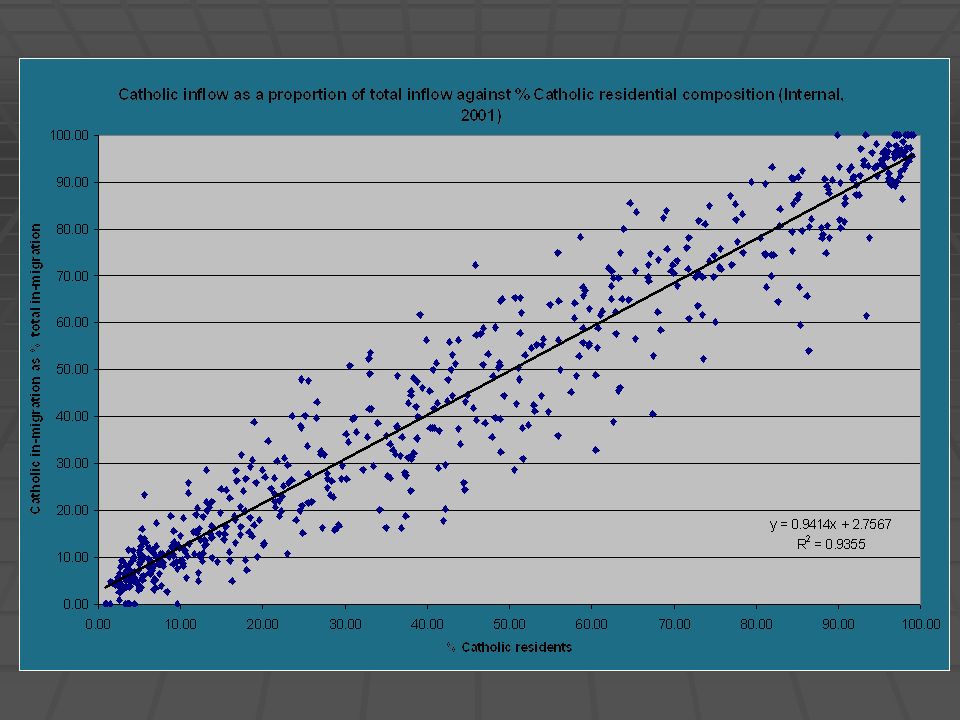
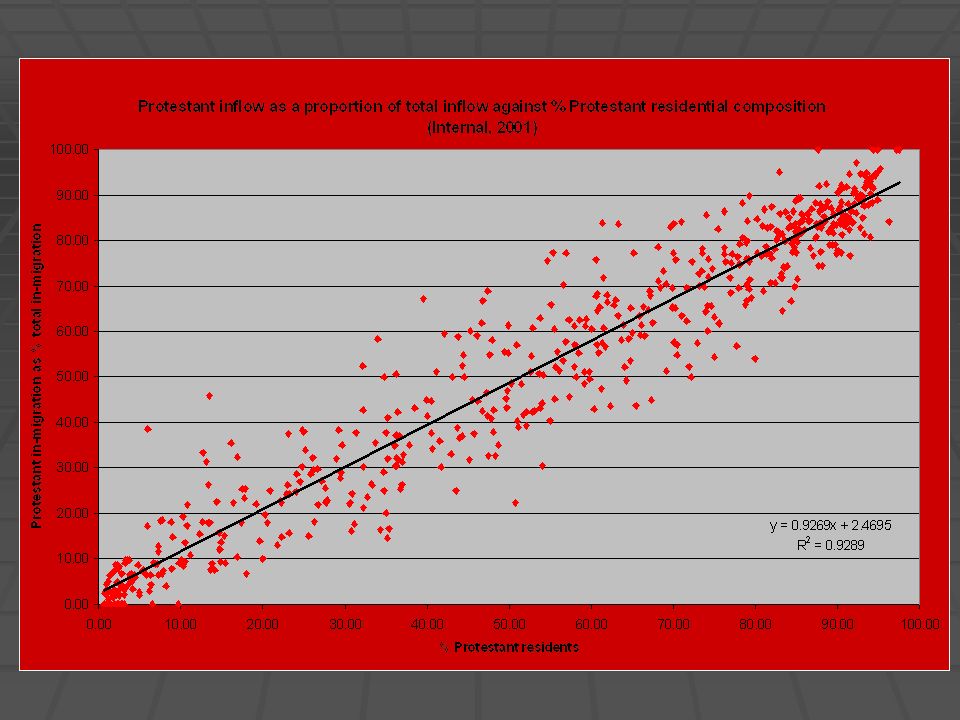
Migration rates by community background Catholic inflow over total inflow Catholic outflow over total outflow

13
(b) Deciles of % Protestant residents against % Protestant outflow (a) Deciles of % Catholic residents against % Catholic outflow
 Deciles of % Protestant residents against % Protestant outflow (a) Deciles of % Catholic residents against % Catholic outflow")
14
What is GWR? Normal regression assumes that a relationship between variables holds at each location Geographically Weighted Regression (GWR) accounts for spatial variations in the relationships between variables GWR produces regression coefficients at (the centroid of) each selected location, facilitating an assessment of how the relationship between a set of variables changes from place to place
 accounts for spatial variations in the relationships between variables GWR produces regression coefficients at (the centroid of) each selected location, facilitating an assessment of how the relationship between a set of variables changes from place to place.")
15
GWR and migration Local variations in the regression between demographic composition and in- and out- migration not accounted for with global regression Useful in understanding these relationships, and in predicting future change % residents by community background and inflow / outflow by community background as proportion of all inflow / outflow

16
GWR: Catholic residents against Catholic inflow

17
GWR predictions (independent = 50%)
")
18
Before and after migration Examine population after migration (2001) and before migration (2000) Potential issues: Potential issues: In situ growth: data on births and deaths Internal migrants only: no GB (or further) data on community background Possibilities: Proportions (% CB) Proportions (% CB) Segregation indices Segregation indices Concentration profiles Concentration profiles
 and before migration (2000) Potential issues: Potential issues: In situ growth: data on births and deaths Internal migrants only: no GB (or further) data on community background Possibilities: Proportions (% CB) Proportions (% CB) Segregation indices Segregation indices Concentration profiles Concentration profiles")
19
Segregation indices: the role of migration D S S* x P* y x P* x x P* y 2 x P* x 2 Before0.6011680.2714880.3296800.2464220.7535780.2992420.700758 After0.6010590.2714370.3296210.2465180.7534820.2993600.700640 Change-0.000109-0.000051-0.0000590.000095-0.0000960.000118-0.000118

20
Segregation indices: the role of migration Overall indication of minimal change, with decreasing segregation and greater mixing But, these are global measures Can use, for example, % Catholic and Protestant before and after migration Do show considerable local variations – some areas increasing, some decreasing

21
Other work: current and future Origin-destination (flow) data SI modelling Logistic regression Principal Components Analysis Etc Qualitative research Interviews, focus groups and cognitive mapping Selected case study areas (Belfast)
 data SI modelling Logistic regression Principal Components Analysis Etc Qualitative research Interviews, focus groups and cognitive mapping Selected case study areas (Belfast)")
22
Transect: South Belfast

23
Summary and conclusions Some insight into the geography of migration in NI Methods for exploring the relationship between internal migration and residential segregation Migration has a role to play in the creation, reinforcement and erosion of segregation Positive relationship between demographic composition and migration Local variations in the relationships Variable from place to place, but broadly suggests a decline in segregation due (at least in part) to migration
 to migration")
24
Acknowledgements UPTAP My supervisor, Dr Ian Shuttleworth, for his comments and advice NISRA, for the provision of Census data Department for Employment and Learning (DEL), for funding Contested Cities, Urban Universities (CU2) research team and funding body (European Programme Peace 2)
, for funding Contested Cities, Urban Universities (CU2) research team and funding body (European Programme Peace 2)")
Similar presentations
 & Paul Ell (Queens University, Belfast)>")


 Paul.>")


, UNFPA – India>")


