Download presentation
Presentation is loading. Please wait.

1
From Clinical Observations to Research Hierarchy of Study Designs Dr. Dick Menzies June 10 th, 2005

2
Overview of study designs Observational Studies –Descriptive studies Case reports Case series Reported data Cross sectional studies Ecologic studies –Analytic studies Case control studies Cohort studies –Diagnostic test evaluations Experimental studies Randomized control trials – individual level Field trials - community or group level

3
Step 1: Case Reports Report of a single occurrence of new disease or unusual occurrence of a known disease –Eg., Pneumocystis pneumonia in young homosexual men. –Pulmonary embolus in young woman on oral contraceptives –Myocardial infarction in a child Strengths – rapid and cheap –Useful to alert community to a new disease –This is useful if others are seeing the same thing. Weaknesses – rare events do happen! –Someone always wins the lottery –Clinicians have to recognize and diagnose the disease –Have to recognize that it is unusual.

4
Step 2: Small case series This means 3 or more of the same condition –Unusual events - as for case reports –Generally adds a little more than case reports –More cases equals potentially more weight But, rare events can happen - in clusters –3 cases of Angiosarcoma in workers from a PVC factory –Three people on same street win lottery –Both of these occurred. Which do you think was due to chance alone?

7
Step 3: After the case report/case series. Need to review and understand disease 1.1 Case definition –Who gets it, clinical features, outcomes? –The more detailed the better (autopsy) 2.2 What is or appears to be the biology? Apparent latency Manifestations - what organs affected Pathogenesis - probable or known 3.3 Review the literature This is often forgotten, or under-utilized But is essential to avoid mistakes and wasting time
 2.2 What is or appears to be the biology. Apparent latency Manifestations - what organs affected Pathogenesis - probable or known 3.3 Review the literature This is often forgotten, or under-utilized But is essential to avoid mistakes and wasting time.")
8
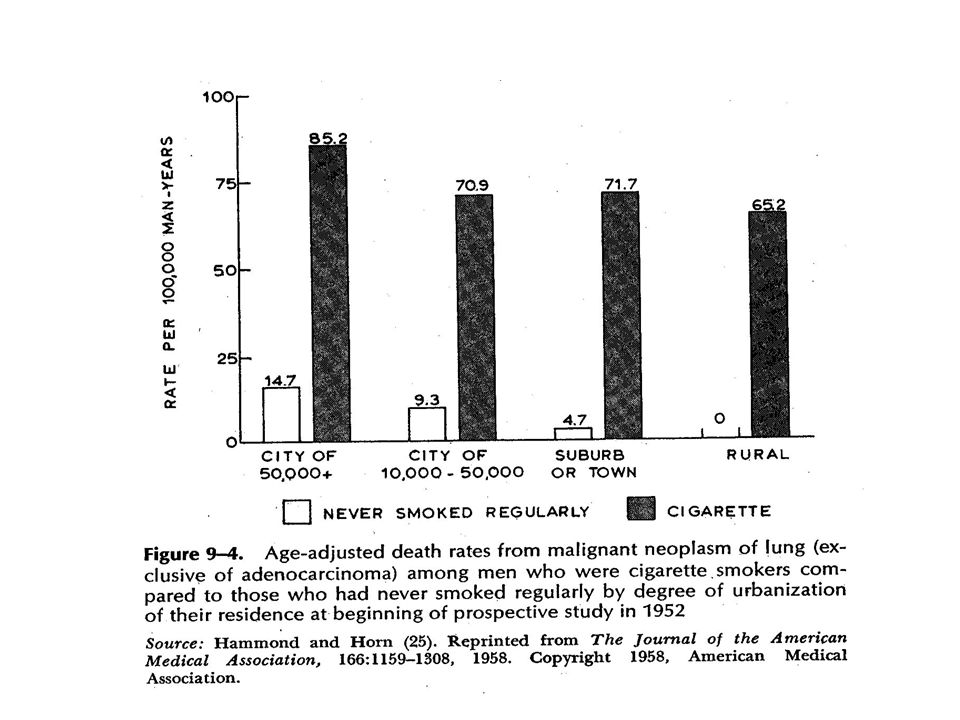
3: Understanding the disease - latency and duration Latency refers to interval between exposure and disease. Short latency – many infectious disease Long latency – many chronic diseases or occupational diseases –Eg., cigarette smoking and lung cancer –Asbestos and mesothelioma

9
Latency between exposure and disease onset ShortLong Duration of Illness Short (acute) Influenza Food Poisoning Trauma Stroke Myocardial infarction Herpes Zoster Long (Chronic) Chlorine gas In-vitro teratogen Tertiary syphilis COPD Rheumatic heart disease 3: The relationship between latency and duration
 Influenza Food Poisoning Trauma Stroke Myocardial infarction Herpes Zoster Long (Chronic) Chlorine gas In-vitro teratogen Tertiary syphilis COPD Rheumatic heart disease 3: The relationship between latency and duration")
10
Step 4a: Large Case Series Description of a large number of patients with a new disease, or receiving a new treatment or new operation Can help to refine case definition. No controls or comparison population –Implicit comparison with standard, or previous therapy –Historical controls or concurrent non-randomized controls Advantages – quick, easy and cheap –Comprehensive - Includes all cases Disadvantages – if results appear better can not be sure it is due to: –Better results of new treatment, or, Better selection of patients –Eg: surgery for MDR-TB yields better survival than in patients who did not have surgery

11
Step 4b: Reported Data - a form of large case series Reported data commonly used –(TB, HIV, Cancers) Useful to define incidence/prevalence in a population, and trends over time. –Some risk factors can be identified, if characteristics of general population known –Description of clinical characteristics and outcomes can be useful. Most useful if reporting is very complete.

15
Step 4c: Ecologic Studies General Design Pick a condition or disease that is reported,or you have information at a group level. –Eg., cancer rates by state or city –or, Complication or mortality rates by hospital Get info re determinants or exposures at the same group or community level –Eg Census data, Air pollution data, Climate, Analyze association between disease or condition and exposures - both at group level

19
Advantages Usually very easy and quick studies Take advantage of already reported data And already gathered information about the populations (eg., from census) Disadvantages Relationship may be due to completely unmeasured factors Substantial potential for confounding 4c: Ecologic Studies
 Disadvantages Relationship may be due to completely unmeasured factors Substantial potential for confounding 4c: Ecologic Studies")
24
Step 5 - Directly gathering your own data: Prevalence or Analytic studies? Prevalence surveys are the simplest to design but can be harder to conduct Analytic - Case-control are much harder to design correctly, but can be easier to carry out Analytic - Cohort studies - not-so-hard to design, but very hard to carry out So, lets start with a Prevalence study

25
Step 5 - Prevalence or cross-sectional studies Objectives: –Define risk factors (exposures) for disease –Also define occurrence/ importance in a population General approach: –Pick a disease or condition (can pick several) –Identify the possible determinants or risk factors (can pick several) –Pick a population, get them to agree (one time survey) –Survey the population Determine who has/has not the disease or condition Identify who has/has not the possible determinants Assess the relationship between disease presence and the determinants
 for disease –Also define occurrence/ importance in a population General approach: –Pick a disease or condition (can pick several) –Identify the possible determinants or risk factors (can pick several) –Pick a population, get them to agree (one time survey) –Survey the population Determine who has/has not the disease or condition Identify who has/has not the possible determinants Assess the relationship between disease presence and the determinants")
26
Advantages Good for chronic diseases (prevalence) Good for common diseases Also good for fairly common exposures Allows one to measure multiple disease or conditions and multiple determinants or risk factors Disadvantages Measurement of exposure can be difficult –Recall problems if long latency –Accuracy if changes over time (Alcohol, smoking, blood pressure) Can not distinguish cause and effect (Tobacco Industry) 5: Cross-sectional or Prevalence Studies (continued)
 Good for common diseases Also good for fairly common exposures Allows one to measure multiple disease or conditions and multiple determinants or risk factors Disadvantages Measurement of exposure can be difficult –Recall problems if long latency –Accuracy if changes over time (Alcohol, smoking, blood pressure) Can not distinguish cause and effect (Tobacco Industry) 5: Cross-sectional or Prevalence Studies (continued)")
27
Step 6: Analytic Studies – Case Control General design Identify a group of patients with disease, or conditions = cases Identify similar group but without disease or conditions = controls Measure risk factors or determinants in both Assess if exposure more likely (odds > 1) in cases than controls
 in cases than controls")
28
Advantages Relatively cheap and quick Particularly useful for studying rare conditions –Or conditions with long latency Disadvantages Controls, Controls, Controls –Very difficult to select proper controls –This is the source of most problems in case control studies –And is why they are generally considered weak evidence. Difficulties of retrospective exposure assessment –particularly if long latency 6: Case Control Studies

29
Step 7: Analytic Studies – Cohorts General design Find a group of healthy people (without condition/ disease) –Eg.: military, workforce, nurses Measure their characteristics at baseline –Particularly exposures of interest Follow them for a period of time Measure occurrence of disease or condition
 –Eg.: military, workforce, nurses Measure their characteristics at baseline –Particularly exposures of interest Follow them for a period of time Measure occurrence of disease or condition")
30
Advantages Can measure many exposures or determinants Can measure many diseases Much better to know cause and effect Disadvantages Long and expensive (often very $$$) Good for common diseases (some cancers, cardiovascular) Inefficient for rare diseases or with long latency Also what if you fail to measure key determinants –(Solution = freezer) 7: Cohort Studies
 Good for common diseases (some cancers, cardiovascular) Inefficient for rare diseases or with long latency Also what if you fail to measure key determinants –(Solution = freezer) 7: Cohort Studies")
31
Step 7a: Studies of Diagnostic Tests General design Usually prospective Find group of patients with condition –Ideally when they are being investigated for it Try new test & standard or reference tests Establish a final accurate diagnosis in all –Need a GOLD standard. Compare new test to old test(s) –agreement, sensitivity and specificity
 –agreement, sensitivity and specificity.")
32
Advantages Relatively cheap, and quick If condition is reasonable common Disadvantages Must define final diagnosis correctly. Must have a gold standard Persons doing new test must be blinded Population must be representative –eg. Patients with advanced disease vs. healthy volunteers 7a: Diagnostic Test Studies

33
The final step: Experimental Studies – Randomized Trials General Design Pick an intervention – usually a form of treatment –You can only pick one Find a group of patients that agree to participate –Have to be representative of condition Give the new treatment to some –Some get the old (or no) treatment –Do this randomly Follow all to see outcomes
 treatment –Do this randomly Follow all to see outcomes")
34
Advantages Best way to evaluate effect of an intervention Best control of bias and confounding Disadvantages Not easy or feasible for all interventions Not useful for studies or risk factors or natural history Difficult to apply for most diagnostic tests Substantial refusal or drop-out rates can restrict generalizability Population selected may not be representative –Young healthier adults –No pregnancy, no kids, no elderly PLEASE! Experimental Studies – Randomized Trials

35
Experimental Community or Field Trials General Design Pick an intervention to be applied at a community level –Fluoride in water, public education, vaccination Find several communities or population groups Apply intervention to some and not others –Randomly again Measure outcomes at population or group level

36
Advantages Only way to study some interventions May offer better assessment of likely impact of these interventions Disadvantages All the same problems as ecologic studies Also some important ethical issues (eg., fluoride) Community or Field Trials
 Community or Field Trials")
Similar presentations


>")


. What is a cohort?>")


 ASSISTANT PROFESSOR>")
 Dr. Khalid El Tohami.>")
 Betty C. Jung, RN, MPH, CHES.>")


